Tendency of DNA sequences that are close together on a chromosome to be inherited together
"Genetic map" redirects here; not to be confused with Gene mapping.
Genetic linkage is the tendency of DNA sequences that are close together on a chromosome to be inherited together during the meiosis phase of sexual reproduction. Two genetic markers that are physically near to each other are unlikely to be separated onto different chromatids during chromosomal crossover, and are therefore said to be more linked than markers that are far apart. In other words, the nearer two genes are on a chromosome, the lower the chance of recombination between them, and the more likely they are to be inherited together. Markers on different chromosomes are perfectly unlinked, although the penetrance of potentially deleterious alleles may be influenced by the presence of other alleles, and these other alleles may be located on other chromosomes than that on which a particular potentially deleterious allele is located.[1]
Genetic linkage is the most prominent exception to Gregor Mendel's Law of Independent Assortment. The first experiment to demonstrate linkage was carried out in 1905. At the time, the reason why certain traits tend to be inherited together was unknown. Later work revealed that genes are physical structures related by physical distance.
The typical unit of genetic linkage is the centimorgan (cM). A distance of 1 cM between two markers means that the markers are separated to different chromosomes on average once per 100 meiotic product, thus once per 50 meioses.
Discovery
Gregor Mendel's Law of Independent Assortment states that every trait is inherited independently of every other trait. But shortly after Mendel's work was rediscovered, exceptions to this rule were found. In 1905, the British geneticists William Bateson, Edith Rebecca Saunders and Reginald Punnett cross-bred pea plants in experiments similar to Mendel's.[2][3] They were interested in trait inheritance in the sweet pea and were studying two genes—the gene for flower colour (P, purple, and p, red) and the gene affecting the shape of pollen grains (L, long, and l, round). They crossed the pure lines PPLL and ppll and then self-crossed the resulting PpLl lines.[citation needed]
According to Mendelian genetics, the expected phenotypes would occur in a 9:3:3:1 ratio of PL:Pl:pL:pl. To their surprise, they observed an increased frequency of PL and pl and a decreased frequency of Pl and pL:[citation needed]
Bateson, Saunders, and Punnett experiment
Phenotype and genotype
Observed
Expected from 9:3:3:1 ratio
Purple, long (P_L_)
284
216
Purple, round (P_ll)
21
72
Red, long (ppL_)
21
72
Red, round (ppll)
55
24
Their experiment revealed linkage between the P and L alleles and the p and l alleles. The frequency of P occurring together with L and p occurring together with l is greater than that of the recombinant Pl and pL. The recombination frequency is more difficult to compute in an F2 cross than a backcross,[4] but the lack of fit between observed and expected numbers of progeny in the above table indicate it is less than 50%. This indicated that two factors interacted in some way to create this difference by masking the appearance of the other two phenotypes. This led to the conclusion that some traits are related to each other because of their near proximity to each other on a chromosome.[citation needed]
The understanding of linkage was expanded by the work of Thomas Hunt Morgan. Morgan's observation that the amount of crossing over between linked genes differs led to the idea that crossover frequency might indicate the distance separating genes on the chromosome. The centimorgan, which expresses the frequency of crossing over, is named in his honour.[citation needed]
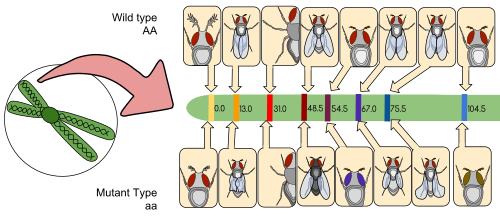
A linkage map (also known as a genetic map) is a table for a species or experimental population that shows the position of its known genes or genetic markers relative to each other in terms of recombination frequency, rather than a specific physical distance along each chromosome. Linkage maps were first developed by Alfred Sturtevant, a student of Thomas Hunt Morgan.[citation needed]
A linkage map is a map based on the frequencies of recombination between markers during crossover of homologous chromosomes. The greater the frequency of recombination (segregation) between two genetic markers, the further apart they are assumed to be. Conversely, the lower the frequency of recombination between the markers, the smaller the physical distance between them. Historically, the markers originally used were detectable phenotypes (enzyme production, eye colour) derived from coding DNA sequences; eventually, confirmed or assumed noncoding DNA sequences such as microsatellites or those generating restriction fragment length polymorphisms (RFLPs) have been used.[citation needed]
Linkage maps help researchers to locate other markers, such as other genes by testing for genetic linkage of the already known markers. In the early stages of developing a linkage map, the data are used to assemble linkage groups, a set of genes which are known to be linked. As knowledge advances, more markers can be added to a group, until the group covers an entire chromosome.[6] For well-studied organisms the linkage groups correspond one-to-one with the chromosomes.[citation needed]
Linkage analysis is a genetic method that searches for chromosomal segments that cosegregate with the ailment phenotype through families.[7] It can be used to map genes for both binary and quantitative traits.[7] Linkage analysis may be either parametric (if we know the relationship between phenotypic and genetic similarity) or non-parametric. Parametric linkage analysis is the traditional approach, whereby the probability that a gene important for a disease is linked to a genetic marker is studied through the LOD score, which assesses the probability that a given pedigree, where the disease and the marker are cosegregating, is due to the existence of linkage (with a given linkage value) or to chance. Non-parametric linkage analysis, in turn, studies the probability of an allele being identical by descent with itself.[citation needed]
Pedigree illustrating Parametric Linkage Analysis
Parametric linkage analysis
The LOD score (logarithm (base 10) of odds), developed by Newton Morton,[8] is a statistical test often used for linkage analysis in human, animal, and plant populations. The LOD score compares the likelihood of obtaining the test data if the two loci are indeed linked, to the likelihood of observing the same data purely by chance. Positive LOD scores favour the presence of linkage, whereas negative LOD scores indicate that linkage is less likely. Computerised LOD score analysis is a simple way to analyse complex family pedigrees in order to determine the linkage between Mendelian traits (or between a trait and a marker, or two markers).[citation needed]
The method is described in greater detail by Strachan and Read. Briefly, it works as follows:[citation needed]
Make a number of estimates of recombination frequency
Calculate a LOD score for each estimate
The estimate with the highest LOD score will be considered the best estimate
The LOD score is calculated as follows:
NR denotes the number of non-recombinant offspring, and R denotes the number of recombinant offspring. The reason 0.5 is used in the denominator is that any alleles that are completely unlinked (e.g. alleles on separate chromosomes) have a 50% chance of recombination, due to independent assortment. θis the recombinant fraction, i.e. the fraction of births in which recombination has happened between the studied genetic marker and the putative gene associated with the disease. Thus, it is equal to R / (NR + R).[citation needed]
By convention, a LOD score greater than 3.0 is considered evidence for linkage, as it indicates 1000 to 1 odds that the linkage being observed did not occur by chance. On the other hand, a LOD score less than −2.0 is considered evidence to exclude linkage. Although it is very unlikely that a LOD score of 3 would be obtained from a single pedigree, the mathematical properties of the test allow data from a number of pedigrees to be combined by summing their LOD scores. A LOD score of 3 translates to a p-value of approximately 0.05,[9] and no multiple testing correction (e.g. Bonferroni correction) is required.[10]
Limitations
Linkage analysis has a number of methodological and theoretical limitations that can significantly increase the type-1 error rate and reduce the power to map human quantitative trait loci (QTL).[11] While linkage analysis was successfully used to identify genetic variants that contribute to rare disorders such as Huntington disease, it did not perform that well when applied to more common disorders such as heart disease or different forms of cancer.[12] An explanation for this is that the genetic mechanisms affecting common disorders are different from those causing some rare disorders.[13]
Recombination frequency
Recombination frequency is a measure of genetic linkage and is used in the creation of a genetic linkage map. Recombination frequency (θ) is the frequency with which a single chromosomal crossover will take place between two genes during meiosis. A centimorgan (cM) is a unit that describes a recombination frequency of 1%. In this way we can measure the genetic distance between two loci, based upon their recombination frequency. This is a good estimate of the real distance. Double crossovers would turn into no recombination. In this case we cannot tell if crossovers took place. If the loci we're analysing are very close (less than 7 cM) a double crossover is very unlikely. When distances become higher, the likelihood of a double crossover increases. As the likelihood of a double crossover increases one could systematically underestimate the genetic distance between two loci, unless one used an appropriate mathematical model.[citation needed]
Double linkage is more of a historical concern for plants. In animals, double crossover happens rarely. In humans, for example, one chromosome has two crossovers on average during meiosis. Furthermore, modern geneticists have enough genes that only nearby genes need to be linkage-analyzed, unlike the early days when only a few genes were known.[14]
During meiosis, chromosomes assort randomly into gametes, such that the segregation of alleles of one gene is independent of alleles of another gene. This is stated in Mendel's Second Law and is known as the law of independent assortment. The law of independent assortment always holds true for genes that are located on different chromosomes, but for genes that are on the same chromosome, it does not always hold true.[citation needed]
As an example of independent assortment, consider the crossing of the pure-bred homozygote parental strain with genotypeAABB with a different pure-bred strain with genotype aabb. A and a and B and b represent the alleles of genes A and B. Crossing these homozygous parental strains will result in F1 generation offspring that are double heterozygotes with genotype AaBb. The F1 offspring AaBb produces gametes that are AB, Ab, aB, and ab with equal frequencies (25%) because the alleles of gene A assort independently of the alleles for gene B during meiosis. Note that 2 of the 4 gametes (50%)—Ab and aB—were not present in the parental generation. These gametes represent recombinant gametes. Recombinant gametes are those gametes that differ from both of the haploid gametes that made up the original diploid cell. In this example, the recombination frequency is 50% since 2 of the 4 gametes were recombinant gametes.[citation needed]
The recombination frequency will be 50% when two genes are located on different chromosomes or when they are widely separated on the same chromosome. This is a consequence of independent assortment.[citation needed]
When two genes are close together on the same chromosome, they do not assort independently and are said to be linked. Whereas genes located on different chromosomes assort independently and have a recombination frequency of 50%, linked genes have a recombination frequency that is less than 50%.[citation needed]
As an example of linkage, consider the classic experiment by William Bateson and Reginald Punnett.[15] They were interested in trait inheritance in the sweet pea and were studying two genes—the gene for flower colour (P, purple, and p, red) and the gene affecting the shape of pollen grains (L, long, and l, round). They crossed the pure lines PPLL and ppll and then self-crossed the resulting PpLl lines. According to Mendelian genetics, the expected phenotypes would occur in a 9:3:3:1 ratio of PL:Pl:pL:pl. To their surprise, they observed an increased frequency of PL and pl and a decreased frequency of Pl and pL (see table below).
Bateson and Punnett experiment
Phenotype and genotype
Observed
Expected from 9:3:3:1 ratio
Purple, long (P_L_)
284
216
Purple, round (P_ll)
21
72
Red, long (ppL_)
21
72
Red, round (ppll)
55
24
Unlinked Genes vs. Linked Genes
Their experiment revealed linkage between the P and L alleles and the p and l alleles. The frequency of P occurring together with L and with p occurring together with l is greater than that of the recombinant Pl and pL. The recombination frequency is more difficult to compute in an F2 cross than a backcross,[4] but the lack of fit between observed and expected numbers of progeny in the above table indicate it is less than 50%.[citation needed]
The progeny in this case received two dominant alleles linked on one chromosome (referred to as coupling or cis arrangement). However, after crossover, some progeny could have received one parental chromosome with a dominant allele for one trait (e.g. Purple) linked to a recessive allele for a second trait (e.g. round) with the opposite being true for the other parental chromosome (e.g. red and Long). This is referred to as repulsion or a trans arrangement. The phenotype here would still be purple and long but a test cross of this individual with the recessive parent would produce progeny with much greater proportion of the two crossover phenotypes. While such a problem may not seem likely from this example, unfavourable repulsion linkages do appear when breeding for disease resistance in some crops.[citation needed]
The two possible arrangements, cis and trans, of alleles in a double heterozygote are referred to as gametic phases, and phasing is the process of determining which of the two is present in a given individual.[citation needed]
When two genes are located on the same chromosome, the chance of a crossover producing recombination between the genes is related to the distance between the two genes. Thus, the use of recombination frequencies has been used to develop linkage maps or genetic maps.[citation needed]
However, it is important to note that recombination frequency tends to underestimate the distance between two linked genes. This is because as the two genes are located farther apart, the chance of double or even number of crossovers between them also increases. Double or even number of crossovers between the two genes results in them being cosegregated to the same gamete, yielding a parental progeny instead of the expected recombinant progeny. As mentioned above, the Kosambi and Haldane transformations attempt to correct for multiple crossovers.[16]
Linkage of genetic sites within a gene
In the early 1950s the prevailing view was that the genes in a chromosome are discrete entities, indivisible by genetic recombination and arranged like beads on a string. During 1955 to 1959, Benzer performed genetic recombination experiments using rII mutants of bacteriophage T4. He found that, on the basis of recombination tests, the sites of mutation could be mapped in a linear order.[17][18] This result provided evidence for the key idea that the gene has a linear structure equivalent to a length of DNA with many sites that can independently mutate.[citation needed]
Edgar et al.[19] performed mapping experiments with r mutants of bacteriophage T4 showing that recombination frequencies between rII mutants are not strictly additive. The recombination frequency from a cross of two rII mutants (a x d) is usually less than the sum of recombination frequencies for adjacent internal sub-intervals (a x b) + (b x c) + (c x d). Although not strictly additive, a systematic relationship was observed[20] that likely reflects the underlying molecular mechanism of genetic recombination.
Variation of recombination frequency
While recombination of chromosomes is an essential process during meiosis, there is a large range of frequency of cross overs across organisms and within species. Sexually dimorphic rates of recombination are termed heterochiasmy, and are observed more often than a common rate between male and females. In mammals, females often have a higher rate of recombination compared to males. It is theorised that there are unique selections acting or meiotic drivers which influence the difference in rates. The difference in rates may also reflect the vastly different environments and conditions of meiosis in oogenesis and spermatogenesis.[21]
Genes affecting recombination frequency
Mutations in genes that encode proteins involved in the processing of DNA often affect recombination frequency. In bacteriophage T4, mutations that reduce expression of the replicative DNA polymerase [gene product 43 (gp43)] increase recombination (decrease linkage) several fold.[22][23] The increase in recombination may be due to replication errors by the defective DNA polymerase that are themselves recombination events such as template switches, i.e. copy choice recombination events.[24] Recombination is also increased by mutations that reduce the expression of DNA ligase (gp30)[25][23] and dCMP hydroxymethylase (gp42),[22][23] two enzymes employed in DNA synthesis.
Recombination is reduced (linkage increased) by mutations in genes that encode proteins with nuclease functions (gp46 and gp47)[25][23] and a DNA-binding protein (gp32)[23] Mutation in the bacteriophage uvsX gene also substantially reduces recombination.[26] The uvsX gene is analogous to the well studied recA gene of Escherichia coli that plays a central role in recombination.[27]
Meiosis indicators
With very large pedigrees or with very dense genetic marker data, such as from whole-genome sequencing, it is possible to precisely locate recombinations. With this type of genetic analysis, a meiosis indicator is assigned to each position of the genome for each meiosis in a pedigree. The indicator indicates which copy of the parental chromosome contributes to the transmitted gamete at that position. For example, if the allele from the 'first' copy of the parental chromosome is transmitted, a '0' might be assigned to that meiosis. If the allele from the 'second' copy of the parental chromosome is transmitted, a '1' would be assigned to that meiosis. The two alleles in the parent came, one each, from two grandparents. These indicators are then used to determine identical-by-descent (IBD) states or inheritance states, which are in turn used to identify genes responsible for diseases.[citation needed]
1 2 Cantor, Rita M. (2013), "Analysis of Genetic Linkage", in Rimoin, David; Pyeritz, Reed; Korf, Bruce (eds.), Emery and Rimoin's Principles and Practice of Medical Genetics (6thed.), Academic Press, pp.1–9, doi:10.1016/b978-0-12-383834-6.00010-0, ISBN978-0-12-383834-6
↑ McKee, Bruce D. (2004-03-15). "Homologous pairing and chromosome dynamics in meiosis and mitosis". Biochimica et Biophysica Acta (BBA) - Gene Structure and Expression. 1677 (1–3): 165–180. doi:10.1016/j.bbaexp.2003.11.017. ISSN0006-3002. PMID15020057.
1 2 Bernstein H. The effect on recombination of mutational defects in the DNA-polymerase and deoxycytidylate hydroxymethylase of phage T4D. Genetics. 1967;56(4):755-769
1 2 3 4 5 Berger H, Warren AJ, Fry KE. Variations in genetic recombination due to amber mutations in T4D bacteriophage. J Virol. 1969;3(2):171-175. doi:10.1128/JVI.3.2.171-175.1969
↑ Bernstein H. On the mechanism of intragenic recombination. I. The rII region of bacteriophage T4. (1962) Journal of Theoretical Biology. 1962; 3, 335-353. https://doi.org/10.1016/S0022-5193(62)80030-7
1 2 Bernstein H. Repair and recombination in phage T4. I. Genes affecting recombination. Cold Spring Harb Symp Quant Biol. 1968;33:325-331. doi:10.1101/sqb.1968.033.01.037
↑ Hamlett NV, Berger H. Mutations altering genetic recombination and repair of DNA in bacteriophage T4. Virology. 1975;63(2):539-567. doi:10.1016/0042-6822(75)90326-8
↑ Fujisawa H, Yonesaki T, Minagawa T. Sequence of the T4 recombination gene, uvsX, and its comparison with that of the recA gene of Escherichia coli. Nucleic Acids Res. 1985;13(20):7473-7481. doi:10.1093/nar/13.20.7473
This page is based on this Wikipedia article Text is available under the CC BY-SA 4.0 license; additional terms may apply. Images, videos and audio are available under their respective licenses.