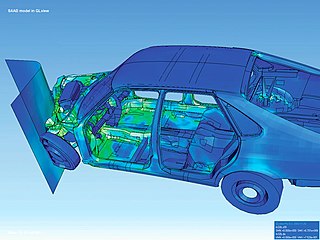
Scientific visualization is an interdisciplinary branch of science concerned with the visualization of scientific phenomena. It is also considered a subset of computer graphics, a branch of computer science. The purpose of scientific visualization is to graphically illustrate scientific data to enable scientists to understand, illustrate, and glean insight from their data. Research into how people read and misread various types of visualizations is helping to determine what types and features of visualizations are most understandable and effective in conveying information.

Visualization, also known as Graphics Visualization, is any technique for creating images, diagrams, or animations to communicate a message. Visualization through visual imagery has been an effective way to communicate both abstract and concrete ideas since the dawn of humanity. from history include cave paintings, Egyptian hieroglyphs, Greek geometry, and Leonardo da Vinci's revolutionary methods of technical drawing for engineering purposes that actively involve scientific requirements.

In scientific visualization and computer graphics, volume rendering is a set of techniques used to display a 2D projection of a 3D discretely sampled data set, typically a 3D scalar field.

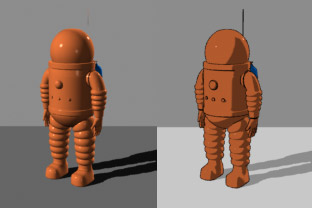
Non-photorealistic rendering (NPR) is an area of computer graphics that focuses on enabling a wide variety of expressive styles for digital art, in contrast to traditional computer graphics, which focuses on photorealism. NPR is inspired by other artistic modes such as painting, drawing, technical illustration, and animated cartoons. NPR has appeared in movies and video games in the form of cel-shaded animation as well as in scientific visualization, architectural illustration and experimental animation.
Bernhard Preim is a specialist in human–computer interface design as well as in visual computing for medicine. He is currently professor of visualization at University of Magdeburg, Germany.
Thomas Albert "Tom" DeFanti is an American computer graphics researcher and pioneer. His work has ranged from early computer animation, to scientific visualization, virtual reality, and grid computing. He is a distinguished professor of Computer Science at the University of Illinois at Chicago, and a research scientist at the California Institute for Telecommunications and Information Technology (Calit2).

Patrick M. Hanrahan is an American computer graphics researcher, the Canon USA Professor of Computer Science and Electrical Engineering in the Computer Graphics Laboratory at Stanford University. His research focuses on rendering algorithms, graphics processing units, as well as scientific illustration and visualization. He has received numerous awards, including the 2019 Turing Award.

Lawrence Jay Rosenblum is an American mathematician, and Program Director for Graphics and Visualization at the National Science Foundation.

The Scientific Computing and Imaging (SCI) Institute is a permanent research institute at the University of Utah that focuses on the development of new scientific computing and visualization techniques, tools, and systems with primary applications to biomedical engineering. The SCI Institute is noted worldwide in the visualization community for contributions by faculty, alumni, and staff. Faculty are associated primarily with the School of Computing, Department of Bioengineering, Department of Mathematics, and Department of Electrical and Computer Engineering, with auxiliary faculty in the Medical School and School of Architecture.

Voreen is an open-source volume visualization library and development platform. Through the use of GPU-based volume rendering techniques it allows high frame rates on standard graphics hardware to support interactive volume exploration.

Christopher Ray Johnson is an American computer scientist. He is a distinguished professor of computer science at the University of Utah, and founding director of the Scientific Computing and Imaging Institute (SCI). His research interests are in the areas of scientific computing and scientific visualization.

Computer-generated imagery (CGI) is a specific-technology or application of computer graphics for creating or improving images in art, printed media, simulators, videos and video games. These images are either static or dynamic. CGI both refers to 2D computer graphics and 3D computer graphics with the purpose of designing characters, virtual worlds, or scenes and special effects. The application of CGI for creating/improving animations is called computer animation, or CGI animation.

In scientific visualization, line integral convolution (LIC) is a method to visualize a vector field at high spatial resolutions. The LIC technique was first proposed by Brian Cabral and Leith Casey Leedom in 1993.
In scientific visualization a tensor glyph is an object that can visualize all or most of the nine degrees of freedom, such as acceleration, twist, or shear – of a matrix. It is used for tensor field visualization, where a data-matrix is available at every point in the grid. "Glyphs, or icons, depict multiple data values by mapping them onto the shape, size, orientation, and surface appearance of a base geometric primitive." Tensor glyphs are a particular case of multivariate data glyphs.

The Kahlert School of Computing is a school within the College of Engineering at the University of Utah in Salt Lake City, Utah.

The Visualization Handbook is a textbook by Charles D. Hansen and Christopher R. Johnson that serves as a survey of the field of scientific visualization by presenting the basic concepts and algorithms in addition to a current review of visualization research topics and tools. It is commonly used as a textbook for scientific visualization graduate courses. It is also commonly cited as a reference for scientific visualization and computer graphics in published papers, with almost 500 citations documented on Google Scholar.
The IEEE Visualization Conference (VIS) is an annual conference on scientific visualization, information visualization, and visual analytics administrated by the IEEE Computer Society Technical Committee on Visualization and Graphics. As ranked by Google Scholar's h-index metric in 2016, VIS is the highest rated venue for visualization research and the second-highest rated conference for computer graphics over all. It has an 'A' rating from the Australian Ranking of ICT Conferences, an 'A' rating from the Brazilian ministry of education, and an 'A' rating from the China Computer Federation (CCF). The conference is highly selective with generally < 25% acceptance rates for all papers.
Charles "Chuck" D. Hansen is an American computer scientist at the University of Utah who works on scientific visualization. He is a Distinguished Professor, a Fellow of the IEEE and a founding faculty member of the Scientific Computing and Imaging Institute. He was an associate editor-in-chief of IEEE Transactions on Visualization and Graphics.

Hanspeter Pfister is a Swiss computer scientist. He is the An Wang Professor of Computer Science at the Harvard John A. Paulson School of Engineering and Applied Sciences and an affiliate faculty member of the Center for Brain Science at Harvard University. His research in visual computing lies at the intersection of scientific visualization, information visualization, computer graphics, and computer vision and spans a wide range of topics, including biomedical image analysis and visualization, image and video analysis, and visual analytics in data science.

Kwan-Liu Ma is an American computer scientist. He was born and grew up in Taipei, Taiwan and came to the United States pursuing advanced study in 1983. He is a distinguished professor of computer science at the University of California, Davis. His research interests include visualization, computer graphics, human computer interaction, and high-performance computing.


