The Hubbert peak theory says that for any given geographical area, from an individual oil-producing region to the planet as a whole, the rate of petroleum production tends to follow a bell-shaped curve. It is one of the primary theories on peak oil.
Choosing a particular curve determines a point of maximum production based on discovery rates, production rates, and cumulative production. Early in the curve (pre-peak), the production rate increases due to the discovery rate and the addition of infrastructure. Late in the curve (post-peak), production declines because of resource depletion.
The Hubbert peak theory is based on the observation that the amount of oil under the ground in any region is finite; therefore, the rate of discovery, which initially increases quickly, must reach a maximum and then decline. In the US, oil extraction followed the discovery curve after a time lag of 32 to 35 years.[1][2] The theory is named after American geophysicist M. King Hubbert, who created a method of modeling the production curve given an assumed ultimate recovery volume.
Hubbert's peak
"Hubbert's peak" can refer to the peaking of production in a particular area, which has now been observed for many fields and regions.
Hubbert's peak was thought to have been achieved in the United States contiguous 48 states (that is, excluding Alaska and Hawaii) in the early 1970s. Oil extraction peaked at 10.2million barrels (1.62×10^6m3) per day in 1970 and then declined over the subsequent 35 years in a pattern that closely followed the one predicted by Hubbert in the mid-1950s. However, beginning in the late 20th century, advances in extraction technology, particularly those that led to the extraction of tight oil and unconventional oil resulted in a large increase in U.S. oil production. Thus, establishing a pattern that deviated drastically from the model predicted by Hubbert for the contiguous 48-states as a whole. Production from wells utilizing these advanced extraction techniques exhibit a rate of decline far greater than traditional means. In November 2017 the United States once again surpassed the 10 million barrel mark for the first time since 1970.[3]
Peak oil as a proper noun, or "Hubbert's peak" applied more generally, refers to a predicted event: the peak of the entire planet's oil production. After peak oil, according to the Hubbert Peak Theory, the rate of oil production on Earth would enter a terminal decline. Based on his theory, in a paper[4] he presented to the American Petroleum Institute in 1956, Hubbert correctly predicted that production of oil from conventional sources would peak in the continental United States around 1965–1970. Hubbert further predicted a worldwide peak at "about half a century" from publication and approximately 12 gigabarrels (GB) a year in magnitude. In a 1976 TV interview[5] Hubbert added that the actions of OPEC might flatten the global production curve but this would only delay the peak for perhaps 10 years. The development of new technologies has provided access to large quantities of unconventional resources, and the boost in production has largely discounted Hubbert's prediction.[citation needed]
Hubbert's theory
Hubbert curve
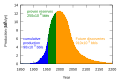
The standard Hubbert curve. For applications, the x and y scales are replaced by time and production scales.U.S. oil production and imports 1910 to 2012
In 1956, Hubbert proposed that fossil fuel production in a given region over time would follow a roughly bell-shaped curve without giving a precise formula; he later used the Hubbert curve, the derivative of the logistic curve,[6][7] for estimating future production using past observed discoveries.
Hubbert assumed that after fossil fuel reserves (oil reserves, coal reserves, and natural gas reserves) are discovered, production at first increases approximately exponentially, as more extraction commences and more efficient facilities are installed. At some point, a peak output is reached, and production begins declining until it approximates an exponential decline.
The Hubbert curve satisfies these constraints. Furthermore, it is symmetrical, with the peak of production reached when half of the fossil fuel that will ultimately be produced has been produced. It also has a single peak.
Given past oil discovery and production data, a Hubbert curve that attempts to approximate past discovery data may be constructed and used to provide estimates for future production. In particular, the date of peak oil production or the total amount of oil ultimately produced can be estimated that way. Cavallo[8] defines the Hubbert curve used to predict the U.S. peak as the derivative of:
where max is the total resource available (ultimate recovery of crude oil), the cumulative production, and and are constants. The year of maximum annual production (peak) is:
so now the cumulative production reaches the half of the total available resource:
The Hubbert equation assumes that oil production is symmetrical about the peak. Others have used similar but non-symmetrical equations which may provide better a fit to empirical production data.[9]
The sum of multiple Hubbert curves, a technique not developed by Hubbert himself, may be used in order to model more complicated real life scenarios. When new production methods, namely hydraulic fracturing, were pioneered on the previously unproductive oil-bearing Shale formations, the sudden, dramatic increase in production necessitated a distinct curve. Advances in technologies such as these are limited, but when a paradigm shifting idea impacts production and causes a need for a new curve to be added to the old curve, or the entire curve to be reworked. It should be noted, & it is well documented, that production from shale wells are unlike that of traditional well. A traditional oil well's rate of decline is shallow, & exhibits a slow, predictable rate of decline as the reservoir is drawn down (Drinking of Milkshake). Whereas production from shale wells, assuming successful fracturing, will see its peak production at the moment the well is brought in, with a drastic rate of decline shortly thereafter. However, one revolutionary aspect of these types of production methods are the ability to refracture the well. Production may be brought back up, to near peak levels with a reapplication of the fracturing technology to the subject formation. Once again releasing the hydrocarbons trapped tightly within the shale & allowing them to be drawn to the surface. This process allows the for an outward manipulation of the curve, simply by purposefully neglecting to rework the well until the operator's desired market conditions are present.[10]
Reliability
Crude oil
Hubbert's upper-bound prediction for US crude oil production (1956), and actual lower-48 states production through 2016
Hubbert, in his 1956 paper,[4] presented two scenarios for US crude oil production:
most likely estimate: a logistic curve with a logistic growth rate equal to 6%, an ultimate resource equal to 150 Giga-barrels (Gb) and a peak in 1965. The size of the ultimate resource was taken from a synthesis of estimates by well-known oil geologists and the US Geological Survey, which Hubbert judged to be the most likely case.
upper-bound estimate: a logistic curve with a logistic growth rate equal to 6% and ultimate resource equal to 200 Giga-barrels and a peak in 1970.
Hubbert's upper-bound estimate, which he regarded as optimistic, accurately predicted that US oil production would peak in 1970, although the actual peak was 17% higher than Hubbert's curve. Production declined, as Hubbert had predicted, and stayed within 10 percent of Hubbert's predicted value from 1974 through 1994; since then, actual production has been significantly greater than the Hubbert curve. The development of new technologies has provided access to large quantities of unconventional resources, and the boost of production has largely discounted Hubbert's prediction.[citation needed]
Hubbert's 1956 production curves depended on geological estimates of ultimate recoverable oil resources, but he was dissatisfied by the uncertainty this introduced, given the various estimates ranging from 110 billion to 590 billion barrels for the US. Starting in his 1962 publication, he made his calculations, including that of ultimate recovery, based only on mathematical analysis of production rates, proved reserves, and new discoveries, independent of any geological estimates of future discoveries. He concluded that the ultimate recoverable oil resource of the contiguous 48 states was 170 billion barrels, with a production peak in 1966 or 1967. He considered that because his model incorporated past technical advances, that any future advances would occur at the same rate, and were also incorporated.[11] Hubbert continued to defend his calculation of 170 billion barrels in his publications of 1965 and 1967, although by 1967 he had moved the peak forward slightly, to 1968 or 1969.[12][13]
A post-hoc analysis of peaked oil wells, fields, regions and nations found that Hubbert's model was the "most widely useful" (providing the best fit to the data), though many areas studied had a sharper "peak" than predicted.[14]
A 2007 study of oil depletion by the UK Energy Research Centre pointed out that there is no theoretical and no robust practical reason to assume that oil production will follow a logistic curve. Neither is there any reason to assume that the peak will occur when half the ultimate recoverable resource has been produced; and in fact, empirical evidence appears to contradict this idea. An analysis of a 55 post-peak countries found that the average peak was at 25 percent of the ultimate recovery.[15]
Natural gas
Hubbert's 1962 prediction of US lower 48-state gas production, versus actual production through 2012
Hubbert also predicted that natural gas production would follow a logistic curve similar to that of oil. The graph shows actual gas production in blue compared to his predicted gas production for the United States in red, published in 1962.[16]
Economics
Oil imports by country pre-2006
Energy return on energy investment
The ratio of energy extracted to the energy expended in the process is often referred to as the Energy Return on Energy Investment (EROI or EROEI). Should the EROEI drops to one, or equivalently the Net energy gain falls to zero, the oil production is no longer a net energy source.
There is a difference between a barrel of oil, which is a measure of oil, and a barrel of oil equivalent (BOE), which is a measure of energy. Many sources of energy, such as fission, solar, wind, and coal, are not subject to the same near-term supply restrictions that oil is.[citation needed] Accordingly, even an oil source with an EROEI of 0.5 can be usefully exploited if the energy required to produce that oil comes from a cheap and plentiful energy source. Availability of cheap, but hard to transport, natural gas in some oil fields has led to using natural gas to fuel enhanced oil recovery. Similarly, natural gas in huge amounts is used to power most Athabasca tar sands plants. Cheap natural gas has also led[citation needed] to ethanol fuel produced with a net EROEI of less than 1, although figures in this area are controversial because methods to measure EROEI are in debate.
The assumption of inevitable declining volumes of oil and gas produced per unit of effort is contrary to recent experience in the US. In the United States, as of 2017, there has been an ongoing decade-long increase in the productivity of oil and gas drilling in all the major tight oil and gas plays. The US Energy Information Administration reports, for instance, that in the Bakken Shale production area of North Dakota, the volume of oil produced per day of drilling rig time in January 2017 was 4 times the oil volume per day of drilling five years previous, in January 2012, and nearly 10 times the oil volume per day of ten years previous, in January 2007. In the Marcellus gas region of the northeast, The volume of gas produced per day of drilling time in January 2017 was 3 times the gas volume per day of drilling five years previous, in January 2012, and 28 times the gas volume per day of drilling ten years previous, in January 2007.[17]
Insofar as economic growth is driven by oil consumption growth, post-peak societies must adapt. Hubbert believed:[18]
Our principal constraints are cultural. During the last two centuries, we have known nothing but exponential growth and in parallel, we have evolved what amounts to an exponential-growth culture, a culture so heavily dependent upon the continuance of exponential growth for its stability that it is incapable of reckoning with problems of non-growth.
—M. King Hubbert, "Exponential Growth as a Transient Phenomenon in Human History"
Some economists describe the problem as uneconomic growth or a false economy. At the political right, Fred Ikle has warned about "conservatives addicted to the Utopia of Perpetual Growth".[19] Brief oil interruptions in 1973 and 1979 markedly slowed—but did not stop—the growth of world GDP.[20]
David Pimentel, professor of ecology and agriculture at Cornell University, and Mario Giampietro, senior researcher at the National Research Institute on Food and Nutrition (INRAN), in their 2003 study Food, Land, Population and the U.S. Economy, placed the maximum U.S. population for a sustainable economy at 200 million (actual population approx. 290m in 2003, 329m in 2019). To achieve a sustainable economy world population will have to be reduced by two-thirds, says the study.[22] Without population reduction, this study predicts an agricultural crisis beginning in 2020, becoming critical c. 2050. The peaking of global oil along with the decline in regional natural gas production may precipitate this agricultural crisis sooner than generally expected. Dale Allen Pfeiffer claims that coming decades could see spiraling food prices without relief and massive starvation on a global level such as never experienced before.[23][24]
Doug Reynolds predicted in 2005 that the North American peak would occur in 2007.[25] Bentley predicted a world "decline in conventional gas production from about 2020".[26]
Although observers believe that peak coal is significantly further out than peak oil, Hubbert studied the specific example of anthracite in the US, a high-grade coal, whose production peaked in the 1920s. Hubbert found that anthracite matches a curve closely.[27] Hubbert had recoverable coal reserves worldwide at 2.500 × 10¹² metric tons and peaking around 2150 (depending on usage).
More recent estimates suggest an earlier peak. Coal: Resources and Future Production (PDF 630KB[28]), published on April 5, 2007 by the Energy Watch Group (EWG), which reports to the German Parliament, found that global coal production could peak in as few as 15 years.[29] Reporting on this, Richard Heinberg also notes that the date of peak annual energetic extraction from coal is likely to come earlier than the date of peak in quantity of coal (tons per year) extracted as the most energy-dense types of coal have been mined most extensively.[30] A second study, The Future of Coal by B. Kavalov and S. D. Peteves of the Institute for Energy (IFE), prepared for the European Commission Joint Research Centre, reaches similar conclusions and states that "coal might not be so abundant, widely available and reliable as an energy source in the future".[29]
Work by David Rutledge of Caltech predicts that the total world coal production will amount to only about 450 gigatonnes.[31] This implies that coal is running out faster than usually assumed.
In a paper in 1956,[32] after a review of US fissionable reserves, Hubbert notes of nuclear power:
There is promise, however, provided mankind can solve its international problems and not destroy itself with nuclear weapons, and provided world population (which is now expanding at such a rate as to double in less than a century) can somehow be brought under control, that we may, at last, have found an energy supply adequate for our needs for at least the next few centuries of the "foreseeable future."
As of 2015, the identified resources of uranium are sufficient to provide more than 135 years of supply at the present rate of consumption.[33] Technologies such as the thorium fuel cycle, reprocessing and fast breeders can, in theory, extend the life of uranium reserves from hundreds to thousands of years.[33]
...you would have to build 10,000 of the largest power plants that are feasible by engineering standards in order to replace the 10 terawatts of fossil fuel we're burning today ... that's a staggering amount and if you did that, the known reserves of uranium would last for 10 to 20 years at that burn rate. So, it's at best a bridging technology ... You can use the rest of the uranium to breed plutonium 239 then we'd have at least 100 times as much fuel to use. But that means you're making plutonium, which is an extremely dangerous thing to do in the dangerous world that we live in.
Helium
Helium production and storage in the United States, 1940–2014 (data from USGS)
Almost all helium on Earth is a result of radioactive decay of uranium and thorium. Helium is extracted by fractional distillation from natural gas, which contains up to 7% helium. The world's largest helium-rich natural gas fields are found in the United States, especially in the Hugoton and nearby gas fields in Kansas, Oklahoma, and Texas. The extracted helium is stored underground in the National Helium Reserve near Amarillo, Texas, the self-proclaimed "Helium Capital of the World". Helium production is expected to decline along with natural gas production in these areas.
Helium, which is the second-lightest chemical element, will rise to the upper layers of Earth's atmosphere, where it can forever break free from Earth's gravitational attraction.[35] Approximately 1,600 tons of helium are lost per year as a result of atmospheric escape mechanisms.[36]
Hubbert applied his theory to "rock containing an abnormally high concentration of a given metal"[37] and reasoned that the peak production for metals such as copper, tin, lead, zinc and others would occur in the time frame of decades and iron in the time frame of two centuries like coal. The price of copper rose 500% between 2003 and 2007[38] and was attributed by some[who?] to peak copper.[39][40] Copper prices later fell, along with many other commodities and stock prices, as demand shrank from fear of a global recession.[41]Lithium availability is a concern for a fleet of Li-ion battery using cars but a paper published in 1996 estimated that world reserves are adequate for at least 50 years.[42] A similar prediction[43] for platinum use in fuel cells notes that the metal could be easily recycled.
In 2009, Aaron Regent president of the Canadian gold giant Barrick Gold said that global output has been falling by roughly one million ounces a year since the start of the decade. The total global mine supply has dropped by 10 percent as ore quality erodes, implying that the roaring bull market of the last eight years may have further to run. "There is a strong case to be made that we are already at 'peak gold'," he told The Daily Telegraph at the RBC's annual gold conference in London. "Production peaked around 2000 and it has been in decline ever since, and we forecast that decline to continue. It is increasingly difficult to find ore," he said.[44]
Ore grades have fallen from around 12grams per tonne in 1950 to nearer 3grams in the US, Canada, and Australia. South Africa's output has halved since peaking in 1970. Output fell a further 14 percent in South Africa in 2008 as companies were forced to dig ever deeper – at greater cost – to replace depleted reserves.
World mined gold production has peaked four times since 1900: in 1912, 1940, 1971, and 2001, each peak being higher than previous peaks. The latest peak was in 2001 when production reached 2,600 metric tons, then declined for several years.[45] Production started to increase again in 2009, spurred by high gold prices, and achieved record new highs each year in 2012, 2013, and 2014, when production reached 2,990 tonnes.[46]
Phosphorus supplies are essential to farming and depletion of reserves is estimated at somewhere from 60 to 130 years.[47] According to a 2008 study, the total reserves of phosphorus are estimated to be approximately 3,200 MT, with peak production at 28 MT/year in 2034.[48] Individual countries' supplies vary widely; without a recycling initiative America's supply[49] is estimated around 30 years.[50] Phosphorus supplies affect agricultural output which in turn limits alternative fuels such as biodiesel and ethanol. Its increasing price and scarcity (the global price of rock phosphate rose 8-fold in the 2 years to mid-2008) could change global agricultural patterns. Lands, perceived as marginal because of remoteness, but with very high phosphorus content, such as the Gran Chaco[51] may get more agricultural development, while other farming areas, where nutrients are a constraint, may drop below the line of profitability.
Renewable resources
Wood
Unlike fossil resources, forests keep growing, thus the Hubbert peak theory does not apply. There had been wood shortages in the past, called Holznot in German-speaking regions, but no global peak wood yet, despite the early 2021 "Lumber Crisis". Besides, deforestation may cause other problems, like erosion and drought by ending forests' Biotic pump effect.
Hubbert's original analysis did not apply to renewable resources. However, over-exploitation often results in a Hubbert peak nonetheless. A modified Hubbert curve applies to any resource that can be harvested faster than it can be replaced.[52]
For example, a reserve such as the Ogallala Aquifer can be mined at a rate that far exceeds replenishment. This turns much of the world's underground water[53] and lakes[54] into finite resources with peak usage debates similar to oil. These debates usually center around agriculture and suburban water usage but generation of electricity[55] from nuclear energy or coal and tar sands mining mentioned above is also water resource intensive. The term fossil water is sometimes used to describe aquifers whose water is not being recharged.
At least one researcher has attempted to perform Hubbert linearization (Hubbert curve) on the whaling industry, as well as charting the transparently dependent price of caviar on sturgeon depletion.[56] The Atlantic northwest cod fishery was a renewable resource, but the numbers of fish taken exceeded the fish's rate of recovery. The end of the cod fishery does match the exponential drop of the Hubbert bell curve. Another example is the cod of the North Sea.[57]
Air/oxygen
Half the world's oxygen is produced by phytoplankton. The plankton was once thought to have dropped by 40% since the 1950s.[58] However, the authors reanalyzed their data with better calibrations and found plankton abundance dropped globally by only a few percent over this time interval (Boyce et al. 2014)
Criticisms of peak oil
Economist Michael Lynch[59] argues that the theory behind the Hubbert curve is simplistic and relies on an overly Malthusian point of view.[60] Lynch claims that Campbell's predictions for world oil production are strongly biased towards underestimates, and that Campbell has repeatedly pushed back the date.[61][62]
Leonardo Maugeri, vice president of the Italian energy company Eni, argues that nearly all of peak estimates do not take into account unconventional oil even though the availability of these resources is significant and the costs of extraction and processing, while still very high, are falling because of improved technology. He also notes that the recovery rate from existing world oil fields has increased from about 22% in 1980 to 35% today because of new technology and predicts this trend will continue. The ratio between proven oil reserves and current production has constantly improved, passing from 20 years in 1948 to 35 years in 1972 and reaching about 40 years in 2003.[63] These improvements occurred even with low investment in new exploration and upgrading technology because of the low oil prices during the last 20 years. However, Maugeri feels that encouraging more exploration will require relatively high oil prices.[64]
Edward Luttwak, an economist and historian, claims that unrest in countries such as Russia, Iran and Iraq has led to a massive underestimate of oil reserves.[65] The Association for the Study of Peak Oil and Gas (ASPO) responds by claiming neither Russia nor Iran are troubled by unrest currently, but Iraq is.[66]
Despite his valuable contribution, M. King Hubbert's methodology falls down because it does not consider likely resource growth, application of new technology, basic commercial factors, or the impact of geopolitics on production. His approach does not work in all cases-including on the United States itself-and cannot reliably model a global production outlook. Put more simply, the case for the imminent peak is flawed. As it is, production in 2005 in the Lower 48 in the United States was 66 percent higher than Hubbert projected.
CERA does not believe there will be an endless abundance of oil, but instead believes that global production will eventually follow an "undulating plateau" for one or more decades before declining slowly,[68] and that production will reach 40 Mb/d by 2015.[69]
Alfred J. Cavallo, while predicting a conventional oil supply shortage by no later than 2015, does not think Hubbert's peak is the correct theory to apply to world production.[70]
Criticisms of peak element scenarios
Although M. King Hubbert himself made major distinctions between decline in petroleum production versus depletion (or relative lack of it) for elements such as fissionable uranium and thorium,[71] some others have predicted peaks like peak uranium and peak phosphorus soon on the basis of published reserve figures compared to present and future production. According to some economists, though, the amount of proved reserves inventoried at a time may be considered "a poor indicator of the total future supply of a mineral resource."[72]
As some illustrations, tin, copper, iron, lead, and zinc all had both production from 1950 to 2000 and reserves in 2000 much exceed world reserves in 1950, which would be impossible except for how "proved reserves are like an inventory of cars to an auto dealer" at a time, having little relationship to the actual total affordable to extract in the future.[72] In the example of peak phosphorus, additional concentrations exist intermediate between 71,000Mt of identified reserves (USGS)[73] and the approximately 30,000,000,000Mt of other phosphorus in Earth's crust, with the average rock being 0.1% phosphorus, so showing decline in human phosphorus production will occur soon would require far more than comparing the former figure to the 190Mt/year of phosphorus extracted in mines (2011 figure).[72][73][74][75]
12Nuclear Energy and the Fossil Fuels, M.K. Hubbert, Presented before the Spring Meeting of the Southern District, American Petroleum Institute, Plaza Hotel, San Antonio, Texas, March 7–8–9, 1956 "Archived copy"(PDF). Archived from the original(PDF) on 2008-05-27. Retrieved 2014-11-10.{{cite web}}: CS1 maint: archived copy as title (link)
123James D. Gwartney, Richard L. Stroup, Russell S. Sobel, David MacPherson. Economics: Private and Public Choice, 12th Edition. South-Western Cengage Learning, p. 730. extract, accessed 5-20-2012
Hubbert, M.K. (1982). Techniques of Prediction as Applied to Production of Oil and Gas, US Department of Commerce, NBS Special Publication 631, May 1982
This page is based on this Wikipedia article Text is available under the CC BY-SA 4.0 license; additional terms may apply. Images, videos and audio are available under their respective licenses.