Landsat program

Last updated

Landsat 7, launched in 1999, is the 7th of 9 satellites in the Landsat program. Landsat7photo.jpg
Landsat 7, launched in 1999, is the 7th of 9 satellites in the Landsat program.
Large Kolkata Landsat.jpg
A false-color satellite image of Kolkata, India, from Landsat 7 in 2004, showing rivers, vegetated areas, and developed areas
Island of Hawai'i - Landsat mosaic.jpg
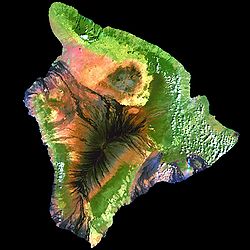
A land cover map of the big island of Hawaii using 1999–2001 data from Landsat 7, showing black lava flows from Mauna Loa, grayish dormant Mauna Kea, a plume of smoke from active Kilauea, dark green tropical forests, and light green agricultural areas.

The Landsat program is the longest-running enterprise for acquisition of satellite imagery of Earth. It is a joint NASA / USGS program. On 23 July 1972, the Earth Resources Technology Satellite was launched. This was eventually renamed to Landsat 1 in 1975. [1] The most recent, Landsat 9, was launched on 27 September 2021.

Contents

The instruments on the Landsat satellites have acquired millions of images. The images, archived in the United States and at Landsat receiving stations around the world, are a unique resource for global change research and applications in agriculture, cartography, geology, forestry, regional planning, surveillance and education, and can be viewed through the U.S. Geological Survey (USGS) "EarthExplorer" website. Landsat 7 data has eight spectral bands with spatial resolutions ranging from 15 to 60 m (49 to 197 ft); the temporal resolution is 16 days. [2] Landsat images are usually divided into scenes for easy downloading. Each Landsat scene is about 115 miles long and 115 miles wide (or 100 nautical miles long and 100 nautical miles wide, or 185 kilometers long and 185 kilometers wide).

History

Virginia Norwood, "The Mother of Landsat", designed the multispectral scanner. Virginia Norwood VT-Storm-Radar-web.png
Virginia Norwood, "The Mother of Landsat", designed the multispectral scanner.
Interview with Jim Irons – Landsat 8 Project Scientist – NASA Goddard Space Flight Center

In 1965, William T. Pecora, the then director of the United States Geological Survey, proposed the idea of a remote sensing satellite program to gather facts about the natural resources of our planet. Pecora stated that the program was "conceived in 1966 largely as a direct result of the demonstrated utility of the Mercury and Gemini orbital photography to Earth resource studies." While weather satellites had been monitoring Earth's atmosphere since 1960 and were largely considered useful, there was no appreciation of terrain data from space until the mid-1960s. So, when Landsat 1 was proposed, it met with intense opposition from the Bureau of Budget and those who argued high-altitude aircraft would be the fiscally responsible choice for Earth remote sensing. Concurrently, the Department of Defense feared that a civilian program such as Landsat would compromise the secrecy of their reconnaissance missions. Additionally, there were geopolitical concerns about photographing foreign countries without permission. In 1965, NASA began methodical investigations of Earth remote sensing using instruments mounted on planes. In 1966, the USGS convinced the Secretary of the Interior, Stewart Udall, to announce that the Department of the Interior (DOI) was going to proceed with its own Earth-observing satellite program. This savvy political stunt coerced NASA to expedite the building of Landsat. But budgetary constraints and sensor disagreements between application agencies (notably the Department of Agriculture and DOI) again stymied the satellite construction process. Finally, by 1970 NASA had a green light to build a satellite. Remarkably, within only two years, Landsat 1 was launched, heralding a new age of remote sensing of land from space. [3]

The Hughes Aircraft Company from Santa Barbara Research Center initiated, designed, and fabricated the first three Multispectral Scanners (MSS) in 1969. The first MSS prototype, designed by Virginia Norwood, was completed within nine months, in the fall of 1970. It was tested by scanning Half Dome at Yosemite National Park. For this design work Norwood was called "The Mother of Landsat". [4]

Working at NASA's Goddard Space Flight Center, Valerie L. Thomas managed the development of early Landsat image processing software systems and became the resident expert on the Computer Compatible Tapes, or CCTs, that were used to store early Landsat imagery. Thomas was one of the image processing specialists who facilitated the ambitious Large Area Crop Inventory Experiment, known as LACIE — a project that showed for the first time that global crop monitoring could be done with Landsat satellite imagery. [5]

The program was initially called the Earth Resources Technology Satellites Program, which was used from 1966 to 1975. In 1975, the name was changed to Landsat. In 1979, President of the United States Jimmy Carter's Presidential Directive 54 [6] [7] transferred Landsat operations from NASA to National Oceanic and Atmospheric Administration (NOAA), recommended development of a long term operational system with four additional satellites beyond Landsat 3, and recommended transition to private sector operation of Landsat. This occurred in 1985 when the Earth Observation Satellite Company (EOSAT), a partnership of Hughes Aircraft Company and RCA, was selected by NOAA to operate the Landsat system with a ten-year contract. EOSAT operated Landsat 4 and Landsat 5, had exclusive rights to market Landsat data, and was to build Landsats 6 and 7.

In 1989, this transition had not been fully completed when NOAA's funding for the Landsat program was due to run out (NOAA had not requested any funding, and U.S. Congress had appropriated only six months of funding for the fiscal year) [8] and NOAA directed that Landsat 4 and Landsat 5 be shut down. [9]

The head of the newly formed National Space Council, Vice President Dan Quayle, noted the situation and arranged emergency funding that allowed the program to continue with the data archives intact. [8] [9] [10] [11]

Again in 1990 and 1991, Congress provided only half of the year's funding to NOAA, requesting that agencies that used Landsat data provide the funding for the other six months of the upcoming year. [8]

In 1992, various efforts were made to procure funding for follow on Landsats and continued operations, but by the end of the year EOSAT ceased processing Landsat data. Landsat 6 was finally launched on 5 October 1993, but was lost in a launch failure. Processing of Landsat 4 and 5 data was resumed by EOSAT in 1994. NASA finally launched Landsat 7 on 15 April 1999.

The value of the Landsat program was recognized by Congress in October 1992 when it passed the Land Remote Sensing Policy Act (Public Law 102-555) authorizing the procurement of Landsat 7 and assuring the continued availability of Landsat digital data and images, at the lowest possible cost, to traditional and new users of the data.

Satellite chronology

InstrumentPictureLaunchedTerminatedDurationNotes
Landsat 1 Sketch of ERTS-1 renamed Landsat1.jpg 23 July 19726 January 19785 years, 6 months and 14 daysOriginally named Earth Resources Technology Satellite 1. Landsat 1 carried two vital instruments: a camera built by the Radio Corporation of America (RCA) known as the Return Beam Vidicon (RBV); and the Multi spectral Scanner (MSS) built by the Hughes Aircraft Company.
Landsat 2 Landsat-1.jpg 22 January 197525 February 19827 years, 1 month and 3 daysNearly identical copy of Landsat 1. Payload consisting of a Return Beam Vidicon (RBV) and a Multi spectral Scanner (MSS). The specifications of these instruments were identical to Landsat 1.
Landsat 3 Landsat3.jpg 5 March 197831 March 19835 years and 26 daysNearly identical copy of Landsat 1 and Landsat 2. Payload consisting of a Return Beam Vidicon (RBV) as well as a Multi spectral Scanner (MSS). Included with the MSS was a short-lived thermal band. MSS data was considered more scientifically applicable than the RBV which was rarely used for engineering evaluation purposes.
Landsat 4 Landsat5.jpg 16 July 198214 December 199311 years, 4 months and 28 daysLandsat 4 carried an updated Multi Spectral Scanner (MSS) used on previous Landsat missions, as well as a Thematic Mapper.
Landsat 5 Landsat5.jpg 1 March 19845 June 2013 [12] 29 years, 3 months and 4 daysNearly identical copy of Landsat 4. Longest Earth-observing satellite mission in history. Designed and built at the same time as Landsat 4, this satellite carried the same payload consisting of a Multi Spectral Scanner (MSS) as well as a Thematic Mapper.
Landsat 6 Landsat-6.jpg 5 October 19935 October 19930 daysFailed to reach orbit. Landsat 6 was an upgraded version of its predecessors. Carrying the same Multi spectral Scanner (MSS) but also carrying an Enhanced Thematic Mapper, which added a 15m resolution panchromatic band.
Landsat 7 Landsat7photo.jpg 15 April 19996 April 202224 years, 8 months and 21 daysOperating with scan line corrector disabled since May 2003. [13] The main component on Landsat 7 was the Enhanced Thematic Mapper Plus (ETM+). Still consisting of the 15m-resolution panchromatic band, but also includes a full aperture calibration. This allows for 5% absolute radiometric calibration. [14]
Landsat 8 Landsat Data Continuity Mission Observatory testing.jpg 11 February 2013active10 years, 10 months and 25 daysOriginally named Landsat Data Continuity Mission from launch until 30 May 2013, when NASA operations were turned over to United States Geological Survey (USGS). [15] Landsat 8 has two sensors with its payload, the Operational Land Imager (OLI) and the Thermal InfraRed Sensor (TIRS). [16]
Landsat 9 Landsat 9 processing.jpg 27 September 2021active2 years, 3 months and 9 daysLandsat 9 is a rebuild of its predecessor Landsat 8. [17] [18]
Timeline
Landsat program

Spatial and spectral resolution

Landsat 1 through 5 carried the Landsat Multispectral Scanner (MSS). Landsat 4 and 5 carried both the MSS and Thematic Mapper (TM) instruments. Landsat 7 uses the Enhanced Thematic Mapper Plus (ETM+) scanner. Landsat 8 uses two instruments, the Operational Land Imager (OLI) for optical bands and the Thermal Infrared Sensor (TIRS) for thermal bands. The band designations, bandpasses, and pixel sizes for the Landsat instruments are: [19]

Landsat 1–5 Multispectral Scanner (MSS)
Landsat 1–3 MSSLandsat 4–5 MSSWavelength (micrometers)Resolution (meters)
Band 4 – GreenBand 1 – Green0.5 – 0.660*
Band 5 – RedBand 2 – Red0.6 – 0.760*
Band 6 – Near Infrared (NIR)Band 3 – NIR0.7 – 0.860*
Band 7 – NIRBand 4 – NIR0.8 – 1.160*

* Original MSS pixel size was 79 x 57 meters; production systems now resample the data to 60 meters.

Landsat 4–5 Thematic Mapper (TM)
BandsWavelength (micrometers)Resolution (meters)
Band 1 – Blue0.45 – 0.5230
Band 2 – Green0.52 – 0.6030
Band 3 – Red0.63 – 0.6930
Band 4 – NIR0.76 – 0.9030
Band 5 – Shortwave Infrared (SWIR) 11.55 – 1.7530
Band 6 – Thermal10.40 – 12.50120* (30)
Band 7 – SWIR 22.08 – 2.3530

* TM Band 6 was acquired at 120-meter resolution, but products are resampled to 30-meter pixels.

Landsat 7 Enhanced Thematic Mapper Plus (ETM+)
BandsWavelength (micrometers)Resolution (meters)
Band 1 – Blue0.45 – 0.5230
Band 2 – Green0.52 – 0.6030
Band 3 – Red0.63 – 0.6930
Band 4 – NIR0.77 – 0.9030
Band 5 – SWIR 11.55 – 1.7530
Band 6 – Thermal10.40 – 12.5060* (30)
Band 7 – SWIR 22.09 – 2.3530
Band 8 – Panchromatic0.52 – 0.9015

* ETM+ Band 6 is acquired at 60-meter resolution, but products are resampled to 30-meter pixels.

The spectral band placement for each sensor of Landsat The spectral band placement for each sensor of Landsat.jpg
The spectral band placement for each sensor of Landsat
Landsat 8 Operational Land Imager (OLI) and Thermal Infrared Sensor (TIRS) [20]
BandsWavelength (micrometers)Resolution (meters)
Band 1 - Ultra Blue (coastal/aerosol)0.435 – 0.45130
Band 2 - Blue0.452 – 0.51230
Band 3 - Green0.533 – 0.59030
Band 4 – Red0.636 – 0.67330
Band 5 – NIR0.851 – 0.87930
Band 6 – SWIR 11.566 – 1.65130
Band 7 – SWIR 22.107 – 2.29430
Band 8 – Panchromatic0.503 – 0.67615
Band 9 – Cirrus1.363 – 1.38430
Band 10 – Thermal 110.60 – 11.19100* (30)
Band 11 – Thermal 211.50 – 12.51100* (30)

* TIRS bands are acquired at 100 meter resolution, but are resampled to 30 meter in delivered data product.

An advantage of Landsat imagery, and remote sensing in general, is that it provides data at a synoptic global level that is impossible to replicate with in situ measurements. However, there are tradeoffs between the local detail of the measurements (radiometric resolution, number of spectral bands) and the spatial scale of the area being measured. Landsat imagery is coarse in spatial resolution compared to using other remote sensing methods, such as imagery from airplanes. Compared to other satellites, Landsat's spatial resolution is relatively high, yet revisit time is relatively less frequent.

MultiSpectral Scanner (MSS)

The Landsat program incorporated the Multispectral Scanner (MSS) from its first mission up to its fifth. The MSS, gave the United States an advantage in satellite imaging, facilitating the launch of Landsat ahead of the French SPOT satellite.

The MSS was unique in its design. Rather than a static camera, it employed a moving mirror, capturing Earth's images in four distinct spectral bands. This capability allowed the MSS to record variations in sunlight reflected from the Earth. Notably, Landsat 3's MSS was further advanced, with an added capability to detect heat radiation. [21]

One of the prominent features of the MSS was its consistent imaging. Each captured frame represented an area on the Earth's surface approximately 83 meters in length and 68 meters in width. Additionally, the system was designed to ensure a continuous image sweep across a swath equivalent to 185 km on the Earth's surface. The MSS's design also emphasized precision; by precisely timing the mirror's movements, it ensured that consecutive images did not overlap. [21]

However, by the 1980s, the cost dynamics shifted. Accessing Landsat's imagery became substantially more expensive, making the French SPOT satellite's images a more cost-effective alternative for many users. The rise in Landsat's prices can be attributed to U.S. policy shifts, initiated under President Carter's leadership and finalized during President Reagan's administration. [7] [22]

Uses of Landsat imagery

One year after launch, Landsat 8 imagery had over one million file downloads by data users. Happy Launch Anniversary, Landsat 8 (12463694884).jpg
One year after launch, Landsat 8 imagery had over one million file downloads by data users.

Landsat data provides information that allows scientists to predict the distribution of species, as well as detecting both naturally occurring and human-generated changes over a greater scale than traditional data from field work. The different spectral bands used on satellites in the Landsat program provide many applications, ranging from ecology to geopolitical matters. Land cover determination is a common use of Landsat imagery around the world. [23]

Landsat imagery provides one of the longest uninterrupted time series available from any single remote sensing program, spanning from 1972 to present. [24] Looking to the future, the successful launch of Landsat-9 in 2021 shows that this time series will be continued forward. [25]

A false-color image of irrigated fields near Garden City, Kansas, taken by the Landsat 7 satellite. Garden City Kansas irrigation-Landsat7-segment2.jpg
A false-color image of irrigated fields near Garden City, Kansas, taken by the Landsat 7 satellite.

In 2015, the Landsat Advisory Group of the National Geospatial Advisory Committee reported that the top 16 applications of Landsat imagery produced savings of approximately 350 million to over 436 million dollars each year for federal and state governments, NGO's, and the private sector. That estimate did not include further savings from other uses beyond the top sixteen categories. [26] The top 16 categories for Landsat imagery use, listed in order of estimated annual savings for users, are:

  1. U.S. Department of Agriculture risk management
  2. U.S. Government mapping
  3. Agricultural water use monitoring
  4. Global security monitoring
  5. Support for fire management
  6. Detection of forest fragmentation
  7. Detection of forest change
  8. World agriculture supply and demand estimates
  9. Vineyard management and water conservation
  10. Flood mitigation mapping
  11. Agricultural commodities mapping
  12. Waterfowl habitat mapping and monitoring
  13. Coastal change analysis
  14. Forest health monitoring
  15. National Geospatial-Intelligence Agency global shoreline mapping
  16. Wildfire risk assessment [26]

Further uses of Landsat imagery include, but are not limited to: fisheries, forestry, shrinking inland water bodies, fire damage, glacier retreat, urban development, and discovery of new species. A few specific examples are explained below.

Natural resources management

Landsat image of the Aral Sea in 2013. NASA's Landsat Satellite Looks for a Cloud-Free View (8778994889).jpg
Landsat image of the Aral Sea in 2013.
Landsat images of burned land in Yellowstone National Park in 1989 and 2011. Fire and the Future of Yellowstone - NASA Earth Observatory.jpg
Landsat images of burned land in Yellowstone National Park in 1989 and 2011.
Landsat-5 false color images of the Columbia Glacier, Alaska in 1986 and 2011. World of Change Columbia Glacier, Alaska (7215814492).png
Landsat-5 false color images of the Columbia Glacier, Alaska in 1986 and 2011.
Landsat false color image highlighting developed areas in pink in Vancouver, British Columbia, Canada. Vancouver Landsat.jpg
Landsat false color image highlighting developed areas in pink in Vancouver, British Columbia, Canada.

Fisheries

In 1975, one potential application for the new satellite-generated imagery was to find high yield fishery areas. Through the Landsat Menhaden and Thread Investigation, some satellite data of the eastern portion of the Mississippi sound and another area off the coast of the Louisiana coast data was run through classification algorithms to rate the areas as high and low probability fishing zones, these algorithms yielded a classification that was proven with in situ measurements – to be over 80% accurate and found that water color, as seen from space, and turbidity significantly correlate with the distribution of menhaden – while surface temperature and salinity do not appear to be significant factors. Water color – measured with the multispectral scanners four spectral bands, was used to infer Chlorophyll, turbidity, and possibly fish distribution. [27]

Forestry

An ecological study used 16 ortho-rectified Landsat images to generate a land cover map of Mozambique's mangrove forest. The main objective was to measure the mangrove cover and above ground biomass on this zone that until now could only be estimated, the cover was found with 93% accuracy to be 2909 square kilometers (27% lower than previous estimates). Additionally, the study helped confirm that geological setting has a greater influence on biomass distribution than latitude alone - the mangrove area is spread across 16° of latitude but it the biomass volume of it was affected more strongly by geographic conditions. [28]

Climate change and environmental disasters

Shrinking of the Aral Sea

The shrinking of the Aral Sea has been described as "One of the planet's worst environmental disasters". Landsat imagery has been used as a record to quantify the amount of water loss and the changes to the shoreline. Satellite visual images have a greater impact on people than just words, and this shows the importance of Landsat imagery and satellite images in general. [29]

Fires in Yellowstone National Park

The Yellowstone fires of 1988 were the worst in the recorded history of the national park. They lasted from 14 June to 11 September 1988, when rain and snow helped halt the spread of the fires. The area affected by the fire was estimated to be 3,213 square kilometers – 36% of the park. Landsat imagery was used for the area estimation, and it also helped determine the reasons why the fire spread so quickly. Historic drought and a significant number of lightning strikes were some of the factors that created conditions for the massive fire, but anthropogenic actions amplified the disaster. On images generated previous to the fire, there is an evident difference between lands that display preservation practices and the lands that display clear cut activities for timber production. These two type of lands reacted differently to the stress of fires, and it is believed that that was an important factor on the behavior of the wildfire. Landsat imagery, and satellite imagery in general, have contributed to understanding fire science; fire danger, wildfire behavior and the effects of wildfire on certain areas. It has helped understanding of how different features and vegetation fuel fires, change temperature, and affect the spreading speed. [30] [31]

Glacier retreat

The serial nature of Landsat missions and the fact that is the longest-running satellite program gives it a unique perspective to generate information of Earth. Glacier retreat in a big scale can be traced back to previous Landsat missions, and this information can be used to generate climate change knowledge. The Columbia glacier retreat for example, can be observed in false-composite images since Landsat 4 in 1986. [32]

Urban development

Landsat imagery gives a time-lapse like series of images of development. Human development specifically, can be measured by the size a city grows over time. Further than just population estimates and energy consumption, Landsat imagery gives an insight of the type of urban development, and study aspects of social and political change through visible change. In Beijing for example, a series of ring roads started to develop in 1980s following the economic reform of 1970, and the change in development rate and construction rate was accelerated in these time periods. [32]

Ecology

Discovery of new species

In 2005, Landsat imagery assisted in the discovery of new species. Conservation scientist Julian Bayliss wanted to find areas that could potentially become conservation forests using Landsat generated satellite images. Bayliss saw a patch in Mozambique that until then had no detailed information. On a reconnaissance trip, he found great diversity of wildlife as well as three new species of butterflies and a new snake species. Following his discovery, he continued to study this forest and was able to map and determine the forest extent. [33]

Recent and future Landsat satellites

Landsat 8/9 and Landsat Next spectral band comparison L8and9-to-LandsatNext-BandComparison.png
Landsat 8/9 and Landsat Next spectral band comparison

Landsat 8 launched on 11 February 2013. It was launched on an Atlas V 401 from Vandenberg Air Force Base by the Launch Services Program. It will continue to obtain valuable data and imagery to be used in agriculture, education, business, science, and government. The new satellite was assembled in Arizona by Orbital Sciences Corporation.

Landsat 9 launched on September 27, 2021. During FY2014 financial planning "appropriators chided NASA for unrealistic expectations that a Landsat 9 would cost US$1 billion, and capped spending at US$650 million" according to a report by the Congressional Research Service. United States Senate appropriators advised NASA to plan for a launch no later than 2020. [7] In April 2015, NASA and the USGS announced that work on Landsat 9 had commenced, with funding allocated for the satellite in the president's FY2016 budget, for a planned launch in 2023. [34] Funding for the development of a low-cost thermal infrared (TIR) free-flying satellite for launch in 2019 was also proposed, to ensure data continuity by flying in formation with Landsat 8. [34]

In the future, there may also be more collaboration between Landsat satellites and other satellites with similar spatial and spectral resolution, such as the ESA's Sentinel-2 constellation. [35]

Landsat NeXt is planned to be launched in 2029. NeXt will measure 25 spectral bands; current Landsat's 8 and 9 can measure only 11. [36]

See also

Related Research Articles

<span class="mw-page-title-main">Remote sensing</span> Acquisition of information at a significant distance from the subject

Remote sensing is the acquisition of information about an object or phenomenon without making physical contact with the object, in contrast to in situ or on-site observation. The term is applied especially to acquiring information about Earth and other planets. Remote sensing is used in numerous fields, including geophysics, geography, land surveying and most Earth science disciplines ; it also has military, intelligence, commercial, economic, planning, and humanitarian applications, among others.

<span class="mw-page-title-main">Landsat 1</span> First satellite of the United States Landsat program, active 1972–78

Landsat 1 (LS-1), formerly named ERTS-A and ERTS-1, was the first satellite of the United States' Landsat program. It was a modified version of the Nimbus 4 meteorological satellite and was launched on July 23, 1972, by a Delta 900 rocket from Vandenberg Air Force Base in California.

<span class="mw-page-title-main">Landsat 7</span> American Earth-observing satellite launched in 1999 as part of the Landsat program

Landsat 7 is the seventh satellite of the Landsat program. Launched on 15 April 1999, Landsat 7's primary goal is to refresh the global archive of satellite photos, providing up-to-date and cloud-free images. The Landsat program is managed and operated by the United States Geological Survey, and data from Landsat 7 is collected and distributed by the USGS. The NASA WorldWind project allows 3D images from Landsat 7 and other sources to be freely navigated and viewed from any angle. The satellite's companion, Earth Observing-1, trailed by one minute and followed the same orbital characteristics, but in 2011 its fuel was depleted and EO-1's orbit began to degrade. Landsat 7 was built by Lockheed Martin Space Systems.

<span class="mw-page-title-main">Satellite imagery</span> Images taken from an artificial satellite

Satellite images are images of Earth collected by imaging satellites operated by governments and businesses around the world. Satellite imaging companies sell images by licensing them to governments and businesses such as Apple Maps and Google Maps.

<span class="mw-page-title-main">Landsat 4</span> American Earth-observing satellite launched in 1982 as part of the Landsat program

Landsat 4 is the fourth satellite of the Landsat program. It was launched on July 16, 1982, with the primary goal of providing a global archive of satellite imagery. Although the Landsat Program is managed by NASA, data from Landsat 4 was collected and distributed by the U.S. Geological Survey. Landsat 4 science operations ended on December 14, 1993, when the satellite lost its ability to transmit science data, far beyond its designed life expectancy of five years. The satellite housekeeping telemetry and tracking continued to be maintained by NASA until it was decommissioned on June 15, 2001.

<span class="mw-page-title-main">Landsat 3</span> American Earth-observing satellite launched in 1978 as part of the Landsat program

Landsat 3 is the third satellite of the Landsat program. It was launched on March 5, 1978, with the primary goal of providing a global archive of satellite imagery. Unlike later Landsat satellites, Landsat 3 was managed solely by NASA. Landsat 3 decommissioned on September 7, 1983, beyond its design life of one year. The data collected during Landsat 3's lifetime was used by 31 countries. Countries that cannot afford their own satellite are able to use the data for ecological preservation efforts and to determine the location of natural resources.

<span class="mw-page-title-main">Multispectral imaging</span> Capturing image data across multiple electromagnetic spectrum ranges

Multispectral imaging captures image data within specific wavelength ranges across the electromagnetic spectrum. The wavelengths may be separated by filters or detected with the use of instruments that are sensitive to particular wavelengths, including light from frequencies beyond the visible light range, i.e. infrared and ultra-violet. It can allow extraction of additional information the human eye fails to capture with its visible receptors for red, green and blue. It was originally developed for military target identification and reconnaissance. Early space-based imaging platforms incorporated multispectral imaging technology to map details of the Earth related to coastal boundaries, vegetation, and landforms. Multispectral imaging has also found use in document and painting analysis.

Colvocoresses Reef is a wholly submerged atoll in the Indian Ocean. It is located in the northeastern part of the Chagos Archipelago, near Speakers Bank and Blenheim Reef. The reef is 8 km long, and measures 1 to 2 km across. Breakers are visible only during heavy seas.

<span class="mw-page-title-main">Normalized difference vegetation index</span> Graphical indicator of remotely sensed live green vegetation

The normalized difference vegetation index (NDVI) is a widely-used metric for quantifying the health and density of vegetation using sensor data. It is calculated from spectrometric data at two specific bands: red and near-infrared. The spectrometric data is usually sourced from remote sensors, such as satellites.

<span class="mw-page-title-main">Landsat 2</span> American Earth-observing satellite launched in 1975 as part of the Landsat program

Landsat 2 is the second satellite of the Landsat program. The spacecraft originally carried a designation of ERTS-B but was renamed "Landsat 2" prior to its launch on January 22, 1975. The objective of the satellite was to acquire global, seasonal data in medium resolution from a near-polar, Sun-synchronous orbit. The satellite, built by General Electric, acquired data with the Return Beam Vidicon (RBV) and the Multispectral Scanner (MSS). Despite having a design life of one year, Landsat 2 operated for over seven years, finally ceasing operations on February 25, 1982.

The Multispectral Scanner (MSS) is one of the Earth's observing sensors introduced in the Landsat program. A Multispectral Scanner was placed aboard each of the first five Landsat satellites.

<span class="mw-page-title-main">Landsat 8</span> American Earth-observing satellite launched in 2013 as part of the Landsat program

Landsat 8 is an American Earth observation satellite launched on 11 February 2013. It is the eighth satellite in the Landsat program; the seventh to reach orbit successfully. Originally called the Landsat Data Continuity Mission (LDCM), it is a collaboration between NASA and the United States Geological Survey (USGS). NASA Goddard Space Flight Center in Greenbelt, Maryland, provided development, mission systems engineering, and acquisition of the launch vehicle while the USGS provided for development of the ground systems and will conduct on-going mission operations. It comprises the camera of the Operational Land Imager (OLI) and the Thermal Infrared Sensor (TIRS), which can be used to study Earth surface temperature and is used to study global warming.

<span class="mw-page-title-main">Operational Land Imager</span> Sensing instrument aboard the Landsat 8 satellite orbiting Earth

The Operational Land Imager (OLI) is a remote sensing instrument aboard Landsat 8, built by Ball Aerospace & Technologies. Landsat 8 is the successor to Landsat 7 and was launched on February 11, 2013.

Multispectral remote sensing is the collection and analysis of reflected, emitted, or back-scattered energy from an object or an area of interest in multiple bands of regions of the electromagnetic spectrum. Subcategories of multispectral remote sensing include hyperspectral, in which hundreds of bands are collected and analyzed, and ultraspectral remote sensing where many hundreds of bands are used. The main purpose of multispectral imaging is the potential to classify the image using multispectral classification. This is a much faster method of image analysis than is possible by human interpretation.

IRS-P2 was an Earth observation satellite launched under the National Natural Resources Management System (NNRMS) programme undertaken by Indian Space Research Organisation (ISRO). The objectives of the mission were to provide spaceborne capability to India in observing and managing natural resources and utilizing them in a productive manner. The satellite carried imaging multi-spectral radiometers on board for radio sensing of the resources.

IRS-1C was the fifth remote sensing Indian satellite built, and designed by Indian Space Research Organization (ISRO). IRS-1C is first second-generation operational Remote Sensing Satellite. The satellite carries payloads with enhanced capabilities like better spatial resolution additional spectral bands, improved repeatability and augment the remote sensing capability of the existing IRS-1A and IRS-1B.

IRS-1A, Indian Remote Sensing satellite-1A, the first of the series of indigenous state-of-art remote sensing satellites, was successfully launched into a polar Sun-synchronous orbit on 17 March 1988 from the Soviet Cosmodrome at Baikonur. IRS-1A carries two sensors, LISS-1 and LISS-2, with resolutions of 72 m (236 ft) and 36 m (118 ft) respectively with a swath width of about 140 km (87 mi) during each pass over the country. Undertaken by the Indian Space Research Organisation (ISRO). It was a part-operational, part-experimental mission to develop Indian expertise in satellite imagery.

IRS-1B, Indian Remote Sensing satellite-1B, the second of the series of indigenous state-of-art remote sensing satellites, was successfully launched into a polar Sun-synchronous orbit on 29 August 1991 from the Soviet Cosmodrome at Baikonur. IRS-1B carries two sensors, LISS-1 and LISS-2, with resolutions of 72 m (236 ft) and 36 m (118 ft) respectively with a swath width of about 140 km (87 mi) during each pass over the country. It was a part-operational, part-experimental mission to develop Indian expertise in satellite imagery. It was a successor to the remote sensing mission IRS-1A, both undertaken by the Indian Space Research Organisation (ISRO).

<span class="mw-page-title-main">Landsat 9</span> American Earth-observing satellite launched in 2021 as part of the Landsat program

Landsat 9 is an Earth observation satellite launched on 27 September 2021 from Space Launch Complex-3E at Vandenberg Space Force Base on an Atlas V 401 launch vehicle. NASA is in charge of building, launching, and testing the satellite, while the United States Geological Survey (USGS) operates the satellite, and manages and distributes the data archive. It is the ninth satellite in the Landsat program, but Landsat 6 failed to reach orbit. The Critical Design Review (CDR) was completed by NASA in April 2018, and Northrop Grumman Innovation Systems (NGIS) was given the go-ahead to manufacture the satellite.

<span class="mw-page-title-main">Virginia Norwood</span> American physicist (1927–2023)

Virginia Tower Norwood was an American aerospace engineer, inventor, and physicist. She was best known for her contribution to the Landsat program, having designed the Multispectral Scanner which was first used on Landsat 1. She has been called "The Mother of Landsat" for this work.

References

  1. Short, N.M. (1982). The LANDSAT Tutorial Workbook: Basics of Satellite Remote Sensing. Washington DC: NASA. hdl:2060/19830002188. 1078.PD-icon.svg This article incorporates text from this source, which is in the public domain .
  2. The Landsat Program – Technical Details Archived 2010-05-01 at the Wayback Machine PD-icon.svg This article incorporates text from this source, which is in the public domain .
  3. "Landsat History". NASA. Retrieved 5 July 2021.
  4. Pennisi, Elizabeth (10 September 2021). "Meet the Landsat pioneer who fought to revolutionize Earth observation". Science. 373 (6561): 1292. doi:10.1126/science.acx9080. S2CID   239215521.
  5. NASA Landsat Science, A Face Behind Landsat Images: Meet Dr. Valerie L. Thomas PD-icon.svg This article incorporates text from this source, which is in the public domain .
  6. "Presidential Directive 54" (PDF). jimmycarterlibrary.gov. Jimmy Carter Library. 16 November 1979. Archived from the original (PDF) on 30 January 2017. Retrieved 18 April 2017.PD-icon.svg This article incorporates text from this source, which is in the public domain .
  7. 1 2 3 Folger, Peter (27 October 2014). "Landsat: Overview and Issues for Congress" (PDF). fas.org. Congressional Research Service. Retrieved 18 April 2017.PD-icon.svg This article incorporates text from this source, which is in the public domain .
  8. 1 2 3 Greenberg, Joel S.; Hertzfeld, Henry (1992). Space Economics. AIAA (American Institute of Aeronautics & Astronautics). p. 372. ISBN   978-1-56347-042-4.
  9. 1 2 Vincent del Giudice (2 March 1989). "The government, saying it ran out of money, pulled the plug on two environmental satellites". United Press International (UPI). Retrieved 13 March 2023.
  10. "Quayle backs satellite program". Sun Journal (Lewiston). Associated Press. 7 March 1989. Retrieved 19 May 2010.
  11. Wilford, John Noble (17 March 1989). "U.S. Halts Plan to Turn Off the Landsat Satellites". The New York Times. Retrieved 19 May 2010.
  12. "Historic Landsat 5 Mission Ends - Landsat Science". 26 June 2013.
  13. "Landsat Science".PD-icon.svg This article incorporates text from this source, which is in the public domain .
  14. "Landsat 7 - Landsat Science". landsat.gsfc.nasa.gov. Archived from the original on 8 November 2016. Retrieved 19 March 2017.PD-icon.svg This article incorporates text from this source, which is in the public domain .
  15. "Landsat 8 Data Now Available!". USGS. Archived from the original on 5 June 2013. Retrieved 30 May 2013.PD-icon.svg This article incorporates text from this source, which is in the public domain .
  16. "Landsat 8 - Landsat Science". landsat.gsfc.nasa.gov. NASA. Archived from the original on 6 November 2016. Retrieved 19 March 2017.PD-icon.svg This article incorporates text from this source, which is in the public domain .
  17. "Virtual Briefing on Launch of NASA, USGS Landsat 9". NASA.gov. 27 August 2021. Retrieved 27 September 2021.
  18. "Landsat 9". NASA Landsat Science. Archived from the original on 9 November 2016. Retrieved 21 December 2016.PD-icon.svg This article incorporates text from this source, which is in the public domain .
  19. "What are the band designations for the Landsat satellites? | Landsat Missions". landsat.usgs.gov. Archived from the original on 22 January 2017. Retrieved 29 January 2019.PD-icon.svg This article incorporates text from this source, which is in the public domain .
  20. Barsi, Julia A.; Lee, Kenton; Kvaran, Geir; Markham, Brian L.; Pedelty, Jeffrey A. (October 2014). "The Spectral Response of the Landsat-8 Operational Land Imager". Remote Sensing. 6 (10): 10232–10251. Bibcode:2014RemS....610232B. doi: 10.3390/rs61010232 .
  21. 1 2 "The Multispectral Scanner". NASA. Archived from the original on 26 January 2007.
  22. "Failure Of Landsat 6 Leaves Many Researchers In Limbo". The Scientist (magazine).
  23. Cohen, Warren B.; Goward, Samuel N. (2004). "Landsat's Role in Ecological Applications of Remote Sensing" (PDF). BioScience. 54 (6): 535–545. doi:10.1641/0006-3568(2004)054[0535:LRIEAO]2.0.CO;2. S2CID   86219373.
  24. Hemati, MohammadAli; Hasanlou, Mahdi; Mahdianpari, Masoud; Mohammadimanesh, Fariba (22 July 2021). "A Systematic Review of Landsat Data for Change Detection Applications: 50 Years of Monitoring the Earth". Remote Sensing. MDPI AG. 13 (15): 2869. Bibcode:2021RemS...13.2869H. doi: 10.3390/rs13152869 . ISSN   2072-4292.
  25. "Landsat 9 Reaches Orbit, Makes Ground Contact to Continue Legacy". USGS.gov. Retrieved 14 October 2021.
  26. 1 2 "Landsat Seen as Stunning Return on Public Investment". USGS.gov. Retrieved 14 October 2021.
  27. Kemmerer, Andrew (March 2017). "Finding Fish With Satellites" (PDF). NOAA.PD-icon.svg This article incorporates text from this source, which is in the public domain .
  28. Fatoyinbo, Temilola (March 2017). "Landscape-scale extent, height, biomass, and carbon estimation of Mozambique's mangrove forest with Landsat ETM+ and Shuttle Radar Topography Mission elevation data". Journal of Geophysical Research: Biogeosciences. 113: n/a. doi: 10.1029/2007JG000551 .
  29. Mason, Betsy (March 2017). "Landsat's Most Historically Significant Images of Earth From Space". Wired.
  30. Zhao, Feng; Meng, Ran; Huang, Chengquan; Zhao, Maosheng; Zhao, Feng; Gong, Peng; Yu, Le; Zhu, Zhiliang (29 October 2016). "Long-Term Post-Disturbance Forest Recovery in the Greater Yellowstone Ecosystem Analyzed Using Landsat Time Series Stack". Remote Sensing. MDPI AG. 8 (11): 898. Bibcode:2016RemS....8..898Z. doi: 10.3390/rs8110898 . hdl: 1903/31531 . ISSN   2072-4292.
  31. "EarthView–Fire and Rebirth: Landsat Tells Yellowstone's Story". USGS.gov. Retrieved 15 October 2021.
  32. 1 2 Ray, Ram, ed. (19 November 2020), Landslides - Investigation and Monitoring, IntechOpen, ISBN   978-1-78985-824-2
  33. "Landsat Imagery Leads to Discovery of New Species - Landsat Science". NASA. Archived from the original on 30 April 2017.PD-icon.svg This article incorporates text from this source, which is in the public domain .
  34. 1 2 Northon, Karen (16 April 2015). "NASA, USGS Begin Work on Landsat 9".
  35. Wulder, Michael A.; Loveland, Thomas R.; Roy, David P.; Crawford, Christopher J.; Masek, Jeffrey G.; Woodcock, Curtis E.; Allen, Richard G.; Anderson, Martha C.; Belward, Alan S.; Cohen, Warren B.; Dwyer, John; Erb, Angela; Gao, Feng; Griffiths, Patrick; Helder, Dennis; Hermosilla, Txomin; Hipple, James D.; Hostert, Patrick; Hughes, M. Joseph; Huntington, Justin; Johnson, David M.; Kennedy, Robert; Kilic, Ayse; Li, Zhan; Lymburner, Leo; McCorkel, Joel; Pahlevan, Nima; Scambos, Theodore A.; Schaaf, Crystal; Schott, John R.; Sheng, Yongwei; Storey, James; Vermote, Eric; Vogelmann, James; White, Joanne C.; Wynne, Randolph H.; Zhu, Zhe (2019). "Current status of Landsat program, science, and applications". Remote Sensing of Environment. Elsevier BV. 225: 127–147. Bibcode:2019RSEnv.225..127W. doi:10.1016/j.rse.2019.02.015. hdl: 10919/88790 . ISSN   0034-4257. S2CID   134722096.
  36. "Landsat NeXt | Landsat Science". NASA. 30 November 2021. Retrieved 11 March 2022.