The United States had an official estimated resident population of 334,914,895 on July 1, 2023, according to the U.S. Census Bureau. This figure includes the 50 states and the District of Columbia but excludes the population of five unincorporated U.S. territories as well as several minor island possessions. The United States is the third most populous country in the world, and the most populous in the Americas and the Western Hemisphere. The Census Bureau showed a population increase of 0.4% for the twelve-month period ending in July 2022, below the world average annual rate of 0.9%. The total fertility rate in the United States estimated for 2022 is 1.665 children per woman, which is below the replacement fertility rate of approximately 2.1.

Madera County, officially the County of Madera, is located at the geographic center of the U.S. state of California. It features a varied landscape, encompassing the eastern San Joaquin Valley and the central Sierra Nevada, with Madera serving as the county seat. Established in 1893 from part of Fresno County, Madera County reported a population of 156,255 in the 2020 census.

Ochiltree County is a county located in the panhandle of the U.S. state of Texas. As of the 2020 census, its population was 10,015. The county seat is Perryton. The county was created in 1876 and organized in 1889. and is named for William Beck Ochiltree, who was an attorney general of the Republic of Texas. It was previously one of 30 prohibition or entirely dry counties in the state of Texas.

Seminole County is a county located in the U.S. state of Oklahoma. As of the 2020 census, the population was 23,556. Its county seat is Wewoka. Most of the county was a reservation for the Seminole Nation of Oklahoma which still retains jurisdiction over some land in the county. A small portion of land at the eastern end of the county belonged to the Muscogee (Creek) Nation.

Okfuskee County is a county located in the U.S. state of Oklahoma. As of the 2020 census, its population was 11,310. Its county seat is Okemah. The county is named for a former Muscogee town in present Cleburne County, Alabama, that in turn was named for the Okfuskee, a Muscogee tribe.

Kay County is a county located in the U.S. state of Oklahoma. As of the 2020 census, its population was 43,700. Its county seat is Newkirk, and the largest city is Ponca City.

Choctaw County is a county located in the U.S. state of Oklahoma. As of the 2020 census, the population was 14,204. Its county seat is Hugo.

Carroll County is a county located in the U.S. state of Illinois. As of the 2020 census, the population was 15,702. Its county seat is Mount Carroll.

Summit County is a county located in the U.S. state of Colorado. As of the 2020 census, the population was 31,055. The county seat and largest town is Breckenridge.

Stilwell / ᏍᏗᎳᏪᎵ is a city located in the sovereign territory of the Cherokee Nation. It is also the county seat of Adair County, Oklahoma. The population was 3,700 as of the 2020 U.S. census, a decline of 6.7 percent from the 3,949 population recorded in 2010. The Oklahoma governor and legislature proclaimed Stilwell as the "Strawberry Capital of the World” in 1949, but the role of strawberries in the local economy has diminished significantly since then. Today, residents of Stilwell are among the poorest and most impoverished in the United States. Stilwell also serves as a gateway to Lake Tenkiller and Adair Park, formerly called Adair State Park before it was defunded.

Ninnekah is a town in Grady County, Oklahoma, United States. The population was 775 at the 2020 census, a 22.7% decrease from 2010.

The Hispanic paradox is an epidemiological finding that Hispanic Americans tend to have health outcomes that "paradoxically" are comparable to, or in some cases better than, those of their U.S. non-Hispanic White counterparts, even though Hispanics have lower average income and education, higher rates of disability, as well as a higher incidence of various cardiovascular risk factors and metabolic diseases.

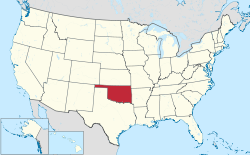
According to the U.S. Census Bureau, as of 2020, the state of Oklahoma had a population of 3,959,353, which is an increase of 208,002 or 5.54% since the year 2010. Oklahoma is the 28th most populous state in the United States.
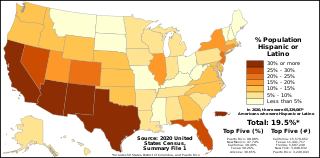
The demographics of Hispanic and Latino Americans depict a population that is the second-largest ethnic group in the United States, 62 million people or 18.7% of the national population.

In the United States, poverty has both social and political implications. In 2020, there were 37.2 million people in poverty. Some of the many causes include income inequality, inflation, unemployment, debt traps and poor education. The majority of adults living in poverty are employed and have at least a high school education. Although the US is a relatively wealthy country by international standards, it has a persistently high poverty rate compared to other developed countries due in part to a less generous welfare system.
Research shows many health disparities among different racial and ethnic groups in the United States. Different outcomes in mental and physical health exist between all U.S. Census-recognized racial groups, but these differences stem from different historical and current factors, including genetics, socioeconomic factors, and racism. Research has demonstrated that numerous health care professionals show implicit bias in the way that they treat patients. Certain diseases have a higher prevalence among specific racial groups, and life expectancy also varies across groups.