Related Research Articles

The United States had an official estimated resident population of 334,914,895 on July 1, 2023, according to the U.S. Census Bureau. This figure includes the 50 states and the District of Columbia but excludes the population of five unincorporated U.S. territories as well as several minor island possessions. The United States is the third most populous country in the world, and the most populous in the Americas and the Western Hemisphere. The Census Bureau showed a population increase of 0.4% for the twelve-month period ending in July 2022, below the world average annual rate of 0.9%. The total fertility rate in the United States estimated for 2022 is 1.665 children per woman, which is below the replacement fertility rate of approximately 2.1.

Duval County is in the northeastern part of the U.S. state of Florida. As of July 2022, the population was 1,016,536, up from 864,263 in 2010. It is Florida's sixth-most populous county. Its county seat is Jacksonville, with which the Duval County government has been consolidated since 1968. Duval County was established in 1822, and is named for William Pope Duval, Governor of Florida Territory from 1822 to 1834. Duval County is the central county of the Jacksonville Metropolitan Statistical Area.

Yolo County, officially the County of Yolo, is a county located in the northern portion of the U.S. state of California. Yolo County was one of the original counties of California, created in 1850 at the time of statehood. As of the 2020 census, the population was 216,403. Its county seat is Woodland.

Dukes County is a county located in the U.S. state of Massachusetts. As of the 2020 census, the population was 20,600, making it the second-least populous county in Massachusetts. Its county seat is Edgartown.

Placer County, officially the County of Placer, is a county located in the U.S. state of California. As of the 2020 census, the population was 404,739. The county seat is Auburn.

Tehama County is a county located in the northern part of the U.S. state of California. As of the 2020 census, the population was 65,829. The county seat and largest city is Red Bluff.

Tolland County is a county in the northeastern part of the U.S. state of Connecticut. As of the 2020 census, its population was 149,788. It is incorporated into 13 towns and was originally formed on October 13, 1785, from portions of eastern Hartford County and western Windham County.

St. James Parish is a parish located in the U.S. state of Louisiana. The parish seat is Convent. The parish was created in 1807. St. James Parish is a part of the New Orleans–Metairie, Louisiana metropolitan statistical area, sitting between New Orleans and Baton Rouge on the Mississippi River. According to the 2020 United States census, the population was 20,192.

Combee Settlement is a census-designated place and unincorporated area in Polk County, Florida, United States. The population was 5,436 at the 2000 census. It is part of the Lakeland–Winter Haven Metropolitan Statistical Area. The area includes the separate unincorporated community of Country Club Estates.
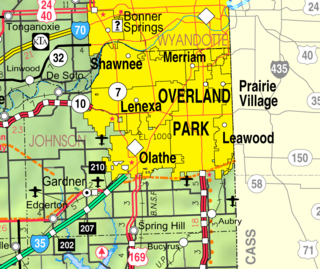
Prairie Village is a city in Johnson County, Kansas, United States, and located within the Kansas City Metropolitan Area. As of the 2020 census, the population of the city was 22,957.

Greenwood is a suburban town in southern Caddo Parish, which is located in the northwest corner of the U.S. state of Louisiana. With a population of 3,166 at the 2020 United States census, it is the third most populous incorporated municipality in Caddo Parish after Shreveport and Blanchard. Part of the Shreveport-Bossier City metropolitan statistical area, it is located 15 miles west of downtown Shreveport.

Castle Point is an unincorporated community and census-designated place (CDP) in St. Louis County, Missouri, United States. The population was 3,962 at the 2010 census.
In the United States census, the U.S. Census Bureau and the Office of Management and Budget define a set of self-identified categories of race and ethnicity chosen by residents, with which they most closely identify. Residents can indicate their origins alongside their race, and are asked specifically whether they are of Hispanic or Latino origin in a separate question.

The demographics of Chicago show that it is a large, and ethnically and culturally diverse metropolis. It is the third largest city and metropolitan area in the United States by population. Chicago was home to over 2.7 million people in 2020, accounting for over 25% of the population in the Chicago metropolitan area, home to approximately 9.6 million.

White Americans are Americans who identify as white people. This group constitutes the majority of the people in the United States. According to the 2020 census, 71%, or 235,411,507 people, were White alone or in combination, and 61.6%, or 204,277,273 people, were White alone. This represented a national white demographic decline from a 72.4% white alone share of the U.S. population in 2010.

Household income is an economic standard that can be applied to one household, or aggregated across a large group such as a county, city, or the whole country. It is commonly used by the United States government and private institutions to describe a household's economic status or to track economic trends in the US.

Personal income is an individual's total earnings from wages, investment interest, and other sources. The Bureau of Labor Statistics reported a median weekly personal income of $1,037 for full-time workers in the United States in Q1 2022. For the year 2020, the U.S. Census Bureau estimates that the median annual earnings for all workers was $41,535; and more specifically estimates that median annual earnings for those who worked full-time, year round, was $56,287.
Dallas is the ninth-most populous city in the U.S. and third in Texas after Houston and San Antonio. At the 2010 U.S. census, Dallas had a population of 1,197,816. In July 2018, the population estimate of the city of Dallas was 1,345,076, an increase of 147,260 since the 2010 United States Census.

According to the U.S. Census Bureau, as of 2020, the state of Oklahoma had a population of 3,959,353, which is an increase of 208,002 or 5.54% since the year 2010. Oklahoma is the 28th most populous state in the United States.
References
- ↑ Office of Management and Budget (1997). "About Race and Ethnicity". United States Census. United States Census Bureau. Retrieved July 26, 2020.
- 1 2 3 American Community Survey (2021). "S0201: Selected Population Profile in the United States". American Community Survey 2021. United States Census Bureau. Retrieved February 8, 2023.
- 1 2 American Community Survey (2021). "S0201: Selected Population Profile in the United States". American Community Survey 2021. United States Census Bureau. Retrieved October 27, 2023.
- ↑ American Community Survey (2019). "S0201: Selected Population Profile in the United States". American Community Survey 2019. United States Census Bureau. Retrieved December 11, 2021.
- ↑ "Median household income in 2014 (dollars) [1]". American Community Survey. United States Census Bureau. 2014. Retrieved 28 December 2015.
- ↑ "Explore Census Data". data.census.gov. Retrieved 2023-02-08.