List of ethnic groups in the United States by per capita income

Last updated

This is a list of per capita income for U.S. residents, organized by race and ethnicity and ancestry (as of 2015).

Contents

By race and ethnicity

The United States Census has race and ethnicity as defined by the Office of Management and Budget in 1997. [1] The following median per capita income data are retrieved from American Community Survey 2018 1-year estimates. In this survey, the nationwide population is 327,167,439 and the per capita income was US$33,831 in 2018. [2]

S0201: ACS 1-Year Estimates Selected Population Profiles (2018)
Race and EthnicityAloneAlone or in Combination with Other RacesRef
CodePopulationPer capita income (US$)CodePopulationPer capita income (US$)
White 002236,173,02036,962003245,860,22836,292 [3]
Black or African American 00441,617,76423,30300546,261,48522,502 [4]
Asian 01218,415,19840,87803122,137,26938,130 [5]
Some other race07016,253,78519,16207118,146,77619,298 [6]
Hispanic or Latino (of any race)40059,763,63120,590 [7]
Not Hispanic or Latino450267,403,80836,790 [7]

By detailed races

Asian

In the 2018 American Community Survey, the following figures regarding detailed Asian races are reported. [8] Other Asian races with code but not reported include: Malaysian (025, 044), Sri Lankan (027, 046), Bhutanese (072, 080), Maldivian (074, 082), Mongolian (075, 083), Okinawan (077, 085), Singaporean (078, 086).

S0201: ACS 1-Year Estimates Selected Population Profiles (2018)
Detailed RaceAloneAlone or in Combination with Other Races
CodePopulationPer capita income (US$)CodePopulationPer capita income (US$)
Indian 0134,161,08855,2980324,506,30854,981
Bangladeshi 014203,84524,054033213,37224,134
Cambodian 015240,37924,921034300,36022,257
Chinese (including Taiwanese)0164,395,91243,5830355,357,75640,744
Chinese (excluding Taiwanese)0174,217,89243,1040365,156,83340,409
Taiwanese 018178,02054,928037213,77449,124
Filipino 0192,920,16036,1830384,089,57032,124
Hmong 020305,32319,155039320,16418,600
Indonesian 02170,85132,256040116,86930,858
Japanese 022782,77650,6170411,542,19539,940
Korean 0231,468,27941,3850421,894,13137,126
Laotian 024203,49425,939043262,22922,512
Pakistani 026487,93733,322045526,95632,608
Thai 028218,51431,077047329,34327,660
Vietnamese 0291,862,39529,4130482,162,61028,076
Burmese 073178,49016,603081189,25017,181
Nepalese 076167,46823,419084175,00522,925

Native Hawaiian and Other Pacific Islander

In the 2018 American Community Survey, the following figures regarding detailed Native Hawaiian and Other Pacific Islander races are reported. [9]

S0201: ACS 1-Year Estimates Selected Population Profiles (2018)
Detailed RaceAloneAlone or in Combination with Other Races
CodePopulationPer capita income (US$)CodePopulationPer capita income (US$)
Polynesian 051357,53225,715061887,46725,206
Native Hawaiian 052186,99629,771062626,45727,078
Samoan 053110,60621,630063213,43920,090
Micronesian 055188,14224,116065284,45222,925
Guamanian or Chamorro 056104,21931,279066182,58427,312

By ancestry

NB: The list of ethnic groups (by ancestry) seems to have been arbitrarily curated, since it excludes many Asian-American ethnic groups whose per capita incomes are significantly higher than those listed below. [8] In addition, the table omits Americans of Native American ancestry as well as Americans of Hispanic or Latino ethnicity.

RankAncestryPopulation (2014)Per capita income (2014 US$) Aguga
1 Macedonian 57,22150,818 [10]
2 Russian 2,762,83050,684 [10]
3 Latvian 87,81750,137 [10]
4 British
(not otherwise specified)
1,326,96049,202 [10]
5 Lithuanian 652,79046,532 [10]
6 Slovene 178,27345,317 [10]
7 Australian 98,39744,681 [10]
8 Austrian 702,77244,098
9 Iranian 452,81543,173 [10]
10 Scottish 5,365,15442,194 [10]
11 Croatian 419,64741,425 [10]
12 Romanian 459,81041,411 [10]
13 Hungarian 1,406,35041,055 [10]
14 Slovak 706,66241,036 [10]
15 Belgian 350,05941,021 [10]
16 Swiss 939,26841,000 [10]
17 Welsh 1,757,65740,704 [10]
18 Danish 1,275,22239,883 [10]
19 Israeli 148,51439,864 [10]
20 Ukrainian 984,15739,785 [10]
21 Syrian 170,06639,713 [10]
22 Canadian 678,11339,651 [10]
23 Serbian 181,17138,981 [10]
24 Lebanese 506,47038,971 [10]
25 Scotch-Irish 2,978,82738,748 [10]
26 English 24,382,18238,525 [10]
27 Bulgarian 90,98137,560 [10]
28 Polish 9,249,39237,413 [10]
29 Norwegian 4,444,56636,866 [10]
30 Turkish 206,91136,483 [10]
31 Italian 17,063,64635,235 [10]
32 German 46,047,11334,943 [10]
33 Armenian 461,07634,402 [10]
34 Finnish 635,56634,343 [10]
35 Irish 33,147,63934,196 [10]
36 Dutch 4,243,06734,160 [10]
37 French
(excluding Basques)
8,153,51533,818 [10]
38 Egyptian 239,10832,466 [10]
39 Portuguese 1,340,02632,194 [10]
40 Barbadian 63,45530,797 [10]
41 Cajun 112,58829,778 [10]
42 Palestinian 122,53327,059 [10]
43 Nigerian 322,23126,881 [10]
44 Ghanaian 117,24725,871 [10]
45 American
(not otherwise specified)
22,097,01225,825
46 Guyanese 234,59125,513 [10]
47 Brazilian 368,78225,142 [10]
48 Jamaican 1,087,18524,604 [10]
49 Pennsylvania German 299,81724,369 [10]
50 Albanian 186,03024,276 [10]
51 Assyrian/Chaldean/Syriac 107,05622,255 [10]
52 Moroccan 101,21121,253 [10]
53 Jordanian 80,12021,222 [10]
54 Cape Verdean 106,31620,314 [10]
55 Black
(not otherwise specified)
1,825,07720,226 [10]
56 Iraqi 143,39718,668 [10]
57 Afghan 97,86518,516 [10]
58 Haitian 984,51417,592 [10]

See also

Related Research Articles

<span class="mw-page-title-main">Dukes County, Massachusetts</span> County in Massachusetts, United States

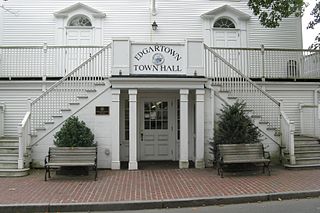
Dukes County is a county located in the U.S. state of Massachusetts. As of the 2020 census, the population was 20,600, making it the second-least populous county in Massachusetts. Its county seat is Edgartown.

<span class="mw-page-title-main">Franklin County, Massachusetts</span> County in Massachusetts, United States

Franklin County is a nongovernmental county located in the northwestern part of the U.S. state of Massachusetts. As of the 2020 census, the population was 71,029, which makes it the least-populous county on the Massachusetts mainland, and the third-least populous county in the state. Its traditional county seat and most populous city is Greenfield. Its largest town by area is New Salem. Franklin County comprises the Greenfield Town, MA Micropolitan Statistical Area, which is included in the Springfield-Greenfield Town, MA Combined Statistical Area.

<span class="mw-page-title-main">Hampshire County, Massachusetts</span> County in Massachusetts, United States

Hampshire County is a historical and judicial county located in the U.S. state of Massachusetts. As of the 2020 census, the population was 162,308. Its most populous municipality is Amherst, its largest town in terms of landmass is Belchertown, and its traditional county seat is Northampton. The county is named after the county Hampshire, in England. Hampshire County is part of the Springfield, MA Metropolitan Statistical Area. Together with Hampden County, Hampshire County municipalities belong to the Pioneer Valley Planning Commission.

<span class="mw-page-title-main">Middlesex County, Connecticut</span> County in Connecticut, United States

Middlesex County is a county in the south central part of the U.S. state of Connecticut. As of the 2020 census, the population was 164,245. The county was created in May 1785 from portions of Hartford County and New London County.

<span class="mw-page-title-main">Tolland County, Connecticut</span> County in Connecticut, United States

Tolland County is a county in the northeastern part of the U.S. state of Connecticut. As of the 2020 census, its population was 149,788. It is incorporated into 13 towns and was originally formed on 13 October 1785 from portions of eastern Hartford County and western Windham County.

<span class="mw-page-title-main">Lincoln County, Wyoming</span> County in Wyoming, United States

Lincoln County is a county in the U.S. state of Wyoming. As of the 2020 United States Census, the population was 19,581. Its county seat is Kemmerer. Its western border abuts the eastern borders of the states of Idaho and Utah.

<span class="mw-page-title-main">Franklin County, Washington</span> County in Washington, United States

Franklin County is a county located in the U.S. state of Washington. As of the 2020 census, its population was 96,749. The county seat and largest city is Pasco. The county was formed out of Whitman County on November 28, 1883, and is named for Benjamin Franklin.

<span class="mw-page-title-main">Lincoln County, Maine</span> County in Maine, United States

Lincoln County is a county located in the U.S. state of Maine. As of the 2020 census, the population was 35,237. Its seat is Wiscasset. The county was founded in 1760 by the Massachusetts General Court from a portion of York County, Massachusetts and named after the English city Lincoln, the birthplace of Massachusetts Bay Provincial Governor Thomas Pownall.

<span class="mw-page-title-main">Washington County, Idaho</span> County in Idaho, United States

Washington County is a county in the U.S. state of Idaho. As of the 2020 census, the population was 10,500. The county seat and largest city is Weiser, with over half of the county's population. The county was established in 1879 when Idaho was a territory and named after U.S. President George Washington.

<span class="mw-page-title-main">Power County, Idaho</span> County in Idaho, United States

Power County is a county located in the U.S. state of Idaho. As of the 2020 Census, the county had a population of 7,878. The county seat and largest city is American Falls. The county was created by the Idaho Legislature on January 30, 1913, by a partition of Cassia County. It is named for an early hydroelectric power plant (1902) at the American Falls.

<span class="mw-page-title-main">Payette County, Idaho</span> County in Idaho, United States

Payette County is a county located in Idaho in the United States of America. As of the 2020 census, the population was 25,386. The county seat and largest city is Payette.

<span class="mw-page-title-main">Greenwood, Louisiana</span> Suburban town in Caddo, Louisiana, United States

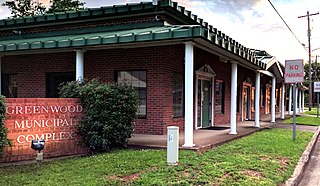
Greenwood is a suburban town in southern Caddo Parish, which is located in the northwest corner of the U.S. state of Louisiana. With a population of 3,166 at the 2020 United States census, it is the third most populous incorporated municipality in Caddo Parish after Shreveport and Blanchard. Part of the Shreveport-Bossier City metropolitan statistical area, it is located 15 miles west of downtown Shreveport.

<span class="mw-page-title-main">De Kalb, Texas</span> City in Texas, United States

De Kalb is a city in Bowie County, Texas, United States; it is part of the Texarkana metropolitan statistical area. Its two area codes are 430 and 903. Its ZIP code is 75559. It is in the Central Time Zone, and its population was 1,527 at the 2020 United States census.

<span class="mw-page-title-main">Race and ethnicity in the United States</span>

The United States has a racially and ethnically diverse population. At the federal level, race and ethnicity have been categorized separately. The most recent United States census officially recognized seven racial categories, as well as people of two or more races. The Census Bureau also classified respondents as "Hispanic or Latino" or "Not Hispanic or Latino", identifying as an ethnicity, which comprises the largest minority group in the nation. The census also asked an "Ancestry Question," which covers the broader notion of ethnicity in the 2000 census long form and the 2010 American Community Survey; the question worded differently on "origins" will return in the 2020 census.

<span class="mw-page-title-main">Monroe, Louisiana metropolitan area</span> Metropolitan area in Louisiana, United States

The Monroe metropolitan satatistical area is a metropolitan area in northern Louisiana that covers three parishes—Ouachita, Union, and Morehouse. According to the 2010 United States census, the MSA had a population of 180,782, which increased to 207,104 at the 2020 census.

<span class="mw-page-title-main">Personal income in the United States</span>

Personal income is an individual's total earnings from wages, investment interest, and other sources. The Bureau of Labor Statistics reported a median weekly personal income of $1,037 for full-time workers in the United States in Q1 2022. For the year 2020, the U.S. Census Bureau estimates that the median annual earnings for all workers was $41,535; and more specifically estimates that median annual earnings for those who worked full-time, year round, was $56,287.

Dallas is the ninth-most populous city in the U.S. and third in Texas after Houston and San Antonio. At the 2010 U.S. census, Dallas had a population of 1,197,816. In July 2018, the population estimate of the city of Dallas was 1,345,076, an increase of 147,260 since the 2010 United States Census.

<span class="mw-page-title-main">Demographics of Hispanic and Latino Americans</span>

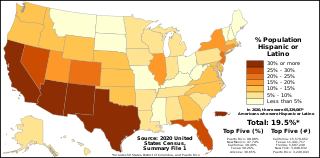
The demographics of Hispanic and Latino Americans depict a population that is the second-largest ethnic group in the United States, 62 million people or 18.7% of the national population.

References

  1. Office of Management and Budget (1997). "About Race and Ethnicity". United States Census. United States Census Bureau. Retrieved July 26, 2020.
  2. American Community Survey (2018). "S0201: Selected Population Profile in the United States". American Community Survey 2018. United States Census Bureau. Retrieved July 26, 2020.
  3. "ACS 2018 1-Year S0201: White (002, 003)".
  4. "ACS 2018 1-Year S0201: Black or African American (004, 005)".
  5. "ACS 2018 1-Year S0201: Asian (012, 031)".
  6. "ACS 2018 1-Year S0201: Some other race (070, 071)".
  7. 1 2 "ACS 2018 1-Year S0201: Hispanic or Latino (400, 450)".
  8. 1 2 American Community Survey (2018). "S0201: Selected Population Profile in the United States". American Community Survey 2018. United States Census Bureau. Retrieved July 26, 2020. Note: All available detailed Asian races alone selected (17)
  9. American Community Survey (2018). "S0201: Selected Population Profile in the United States". American Community Survey 2018. United States Census Bureau. Retrieved July 26, 2020. Note: All available detailed Asian races alone selected (17)
  10. 1 2 3 4 5 6 7 8 9 10 11 12 13 14 15 16 17 18 19 20 21 22 23 24 25 26 27 28 29 30 31 32 33 34 35 36 37 38 39 40 41 42 43 44 45 46 47 48 49 50 51 52 53 54 55 56 "Median household income in the past 12 Months (in 2014 inflation-adjusted dollars)". American Community Survey. United States Census Bureau. 2014. Archived from the original on 13 February 2020. Retrieved 28 December 2015.