
Brownian motion, or pedesis, is the random motion of particles suspended in a medium.

In economics, the Gini coefficient, also known as the Gini index or Gini ratio, is a measure of statistical dispersion intended to represent the income inequality or the wealth inequality within a nation or a social group. The Gini coefficient was developed by the statistician and sociologist Corrado Gini.
In probability theory and statistics, kurtosis is a measure of the "tailedness" of the probability distribution of a real-valued random variable. Like skewness, kurtosis describes the shape of a probability distribution and there are different ways of quantifying it for a theoretical distribution and corresponding ways of estimating it from a sample from a population. Different measures of kurtosis may have different interpretations.
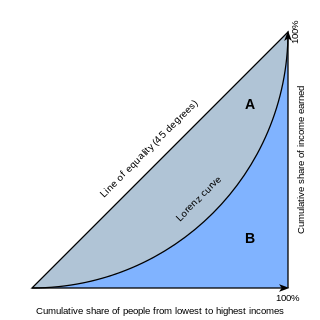
In economics, the Lorenz curve is a graphical representation of the distribution of income or of wealth. It was developed by Max O. Lorenz in 1905 for representing inequality of the wealth distribution.

In probability theory and statistics, skewness is a measure of the asymmetry of the probability distribution of a real-valued random variable about its mean. The skewness value can be positive, zero, negative, or undefined.

The Pareto distribution, named after the Italian civil engineer, economist, and sociologist Vilfredo Pareto, is a power-law probability distribution that is used in description of social, quality control, scientific, geophysical, actuarial, and many other types of observable phenomena. Originally applied to describing the distribution of wealth in a society, fitting the trend that a large portion of wealth is held by a small fraction of the population. The Pareto principle or "80-20 rule" stating that 80% of outcomes are due to 20% of causes was named in honour of Pareto, but the concepts are distinct, and only Pareto distributions with shape value of log45 ≈ 1.16 precisely reflect it. Empirical observation has shown that this 80-20 distribution fits a wide range of cases, including natural phenomena and human activities.

In probability theory, a log-normaldistribution is a continuous probability distribution of a random variable whose logarithm is normally distributed. Thus, if the random variable X is log-normally distributed, then Y = ln(X) has a normal distribution. Equivalently, if Y has a normal distribution, then the exponential function of Y, X = exp(Y), has a log-normal distribution. A random variable which is log-normally distributed takes only positive real values. It is a convenient and useful model for measurements in exact and engineering sciences, as well as medicine, economics and other topics.

Noether's theorem or Noether's first theorem states that every differentiable symmetry of the action of a physical system with conservative forces has a corresponding conservation law. The theorem was proven by mathematician Emmy Noether in 1915 and published in 1918. The action of a physical system is the integral over time of a Lagrangian function, from which the system's behavior can be determined by the principle of least action. This theorem only applies to continuous and smooth symmetries over physical space.
In order theory, a field of mathematics, an incidence algebra is an associative algebra, defined for every locally finite partially ordered set and commutative ring with unity. Subalgebras called reduced incidence algebras give a natural construction of various types of generating functions used in combinatorics and number theory.
In the calculus of variations and classical mechanics, the Euler–Lagrange equations is a system of second-order ordinary differential equations whose solutions are stationary points of the given action functional. The equations were discovered in the 1750s by Swiss mathematician Leonhard Euler and Italian mathematician Joseph-Louis Lagrange.

In mathematics, Jensen's inequality, named after the Danish mathematician Johan Jensen, relates the value of a convex function of an integral to the integral of the convex function. It was proved by Jensen in 1906, building on an earlier proof of the same inequality for doubly-differentiable functions by Otto Hölder in 1889. Given its generality, the inequality appears in many forms depending on the context, some of which are presented below. In its simplest form the inequality states that the convex transformation of a mean is less than or equal to the mean applied after convex transformation; it is a simple corollary that the opposite is true of concave transformations.
A conformal field theory (CFT) is a quantum field theory that is invariant under conformal transformations. In two dimensions, there is an infinite-dimensional algebra of local conformal transformations, and conformal field theories can sometimes be exactly solved or classified.
In probability theory, the Chernoff bound gives exponentially decreasing bounds on tail distributions of sums of independent random variables. Despite being named after Herman Chernoff, the author of the paper it first appeared in, the result is due to Herman Rubin. It is a sharper bound than the known first- or second-moment-based tail bounds such as Markov's inequality or Chebyshev's inequality, which only yield power-law bounds on tail decay. However, the Chernoff bound requires that the variates be independent – a condition that neither Markov's inequality nor Chebyshev's inequality require, although Chebyshev's inequality does require the variates to be pairwise independent.
In probability theory and statistics, the coefficient of variation (CV), also known as relative standard deviation (RSD), is a standardized measure of dispersion of a probability distribution or frequency distribution. It is often expressed as a percentage, and is defined as the ratio of the standard deviation to the mean . The CV or RSD is widely used in analytical chemistry to express the precision and repeatability of an assay. It is also commonly used in fields such as engineering or physics when doing quality assurance studies and ANOVA gauge R&R. In addition, CV is utilized by economists and investors in economic models.
The Theil index is a statistic primarily used to measure economic inequality and other economic phenomena, though it has also been used to measure racial segregation.
The Atkinson index is a measure of income inequality developed by British economist Anthony Barnes Atkinson. The measure is useful in determining which end of the distribution contributed most to the observed inequality.
The mean absolute difference (univariate) is a measure of statistical dispersion equal to the average absolute difference of two independent values drawn from a probability distribution. A related statistic is the relative mean absolute difference, which is the mean absolute difference divided by the arithmetic mean, and equal to twice the Gini coefficient. The mean absolute difference is also known as the absolute mean difference and the Gini mean difference (GMD). The mean absolute difference is sometimes denoted by Δ or as MD.

The Newman–Penrose (NP) formalism is a set of notation developed by Ezra T. Newman and Roger Penrose for general relativity (GR). Their notation is an effort to treat general relativity in terms of spinor notation, which introduces complex forms of the usual variables used in GR. The NP formalism is itself a special case of the tetrad formalism, where the tensors of the theory are projected onto a complete vector basis at each point in spacetime. Usually this vector basis is chosen to reflect some symmetry of the spacetime, leading to simplified expressions for physical observables. In the case of the NP formalism, the vector basis chosen is a null tetrad: a set of four null vectors—two real, and a complex-conjugate pair. The two real members asymptotically point radially inward and radially outward, and the formalism is well adapted to treatment of the propagation of radiation in curved spacetime. The Weyl scalars, derived from the Weyl tensor, are often used. In particular, it can be shown that one of these scalars— in the appropriate frame—encodes the outgoing gravitational radiation of an asymptotically flat system.

Diffusion is the net movement of anything generally from a region of higher concentration to a region of lower concentration. Diffusion is driven by a gradient in Gibbs free energy or chemical potential. It is possible to diffuse "uphill" from a region of lower concentration to a region of higher concentration, like in spinodal decomposition.
Experimental uncertainty analysis is a technique that analyses a derived quantity, based on the uncertainties in the experimentally measured quantities that are used in some form of mathematical relationship ("model") to calculate that derived quantity. The model used to convert the measurements into the derived quantity is usually based on fundamental principles of a science or engineering discipline.


