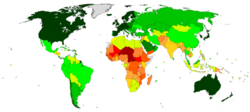
Map of world poverty by country, showing percentage of population living on less than $1.25 per day. Information is based on different years (2000-2006) for different countries. Data is missing for countries colored grey.World map showing life expectancy.World map showing the HDI (Human Development Index)World map of income inequality Gini coefficients by country (as%). Based on World Bank data ranging from 1992 to 2020.
Above 50
Between 45 and 50
Between 40 and 45
Between 35 and 40
Between 30 and 35
Below 30
No data
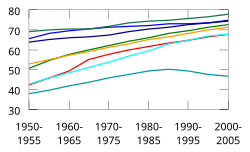
The percentage of the world's population living on less than $1 per day has halved in 20 years. Most of this improvement has occurred in East and South Asia. The graph shows the 1981–2001 period.Life expectancy has been increasing and converging for most of the world. Sub-Saharan Africa has recently seen a decline, partly related to the AIDS epidemic. The graph shows the 1950–2005 period.
Poverty is measured in different ways by different bodies, both governmental and nongovernmental. Measurements can be absolute, which references a single standard, or relative, which is dependent on context. Poverty is widely understood to be multidimensional, comprising social, natural and economic factors situated within wider socio-political processes.
The main poverty line used in the OECD and the European Union is a relative poverty measure based on 60% of the median household income. The United States uses a poverty measure based on pre-tax income and the U.S. Department of Agriculture's "economy food plan" by which 11% of Americans are living in poverty, but this is disputed.
The World Bank defines poverty in absolute terms. It defines extreme poverty as living on less than US$1.90 per day.[2] (PPP), and moderate poverty as less than $3.10 a day.
In 2008, 1.4 billion people had consumption levels below US$1.25 a day and 2.7 billion lived on less than $2 a day. And in 2025, an estimate around 831 million people lived in extreme poverty that lived less on 3.00$.
Absolute vs relative poverty
When measured, poverty may be absolute or relative. Absolute poverty refers to a set standard which is consistent over time and between countries. An example of an absolute measurement would be the percentage of the population eating less food than is required to sustain the human body (approximately 2000–2500 calories per day).
Another interpretation by the European Anti-Poverty Network reads:
[Absolute poverty] is when people lack the basic necessities for survival. For instance they may be starving, lack clean water, proper housing, sufficient clothing or medicines and be struggling to stay alive. This is most common in developing countries but some people in the European Union (EU), for instance homeless people or the Roma in some settlements, still experience this type of extreme poverty. [3]
Relative poverty, in contrast, views poverty as socially defined and dependent on social context. One relative measurement would be to compare the total wealth of the poorest one-third of the population with the total wealth of the richest 1% of the population. In this case, the number of people counted as poor could increase while their income rises. There are several different income inequality metrics; one example is the Gini coefficient.
Although absolute poverty is more common in developing countries, poverty and inequality exist across the world.
Measurements
Both absolute and relative poverty measures are usually based on a person's yearly income and frequently take no account of total wealth. Some people argue that this ignores a key component of economic well-being. Major developments and research in this area suggest that standard one dimensional measures of poverty, based mainly on wealth or calorie consumption, are seriously deficient. This is because poverty often involves being deprived on several fronts, which do not necessarily correlate well with wealth. Access to basic needs is an example of a measurement that does not include wealth. Access to basic needs that may be used in the measurement of poverty are clean water, food, shelter, and clothing.[4][5] It has been established that people may have enough income to satisfy basic needs, but not use it wisely. Similarly, extremely poor people may not be deprived if sufficiently strong social networks, or social service systems exist.[6]
The main poverty line used in the OECD and the European Union is a relative poverty measure based on "economic distance", a level of income usually set at 60% of the median household income.[3]
The United States, in contrast, uses an absolute poverty measure. The US poverty line was created in 1963–64 and was based on the dollar costs of the U.S. Department of Agriculture's "economy food plan" multiplied by a factor of three. The multiplier was based on research showing that food costs then accounted for about one-third of money income. This one-time calculation has since been annually updated for inflation.[7]
The U.S. line has been critiqued as being either too high or too low. For instance, The Heritage Foundation, a conservative U.S. think tank, objects to the fact that, according to the U.S. Census Bureau, 46% of those defined as being in poverty in the U.S. own their own home (with the average poor person's home having three bedrooms, with one and a half baths, and a garage).[8] Others, such as economist Ellen Frank, argue that the poverty measure is too low as families spend much less of their total budget on food than they did when the measure was established in the 1950s. Further, federal poverty statistics do not account for the widely varying regional differences in non-food costs such as housing, transport, and utilities.[9]
Definitions
The World Bank defines poverty in absolute terms. The bank defines extreme poverty as living on less than US$1.90 per day.[2] (PPP), and moderate poverty as less than $3.10 a day. It has been estimated that in 2008, 1.4 billion people had consumption levels below US$1.25 a day and 2.7 billion lived on less than $2 a day. The proportion of the developing world's population living in extreme economic poverty has fallen from 28 percent in 1990 to 21 percent in 2001. Much of the improvement has occurred in East and South Asia. In Sub-Saharan Africa GDP/capita shrank with 14 percent, and extreme poverty increased from 41 percent in 1981 to 46 percent in 2001. Other regions have seen little or no change. In the early 1990s the transition economies of Europe and Central Asia experienced a sharp drop in income. Poverty rates rose to 6 percent at the end of the decade before beginning to recede.[10] There are criticisms of these measurements.[11]
Indicators
Non-monetary indicators
Some economists, such as Guy Pfeffermann, say that other non-monetary indicators of "absolute poverty" are also improving. Life expectancy has greatly increased in the developing world since World War II and is starting to close the gap to the developed world where the improvement has been smaller. Even in Sub-Saharan Africa, the least developed region, life expectancy increased from 30 years before World War II to a peak of about 50 years — before the HIV pandemic and other diseases started to force it down to the current level of 47 years. Child mortality has decreased in every developing region of the world.[12] The proportion of the world's population living in countries where per-capita food supplies are less than 2,200 calories (9,200 kilojoules) per day decreased from 56% in the mid-1960s to below 10% by the 1990s. Between 1950 and 1999, global literacy increased from 52% to 81% of the world. Women made up much of the gap: Female literacy as a percentage of male literacy has increased from 59% in 1970 to 80% in 2000. The percentage of children not in the labor force has also risen to over 90% in 2000 from 76% in 1960. There are similar trends for electric power, cars, radios, and telephones per capita, as well as the proportion of the population with access to clean water.[citation needed]
Common Poverty metrics
Headcount index
Headcount index (Po) is a widely used measure, which simply indicates the proportion of the poor population. Although it does not indicate how poor the poor are.
Formula: , where Np is the number of poor and N is the total population.
Example: If 10 people are poor in a survey that samples 1000 people, then Po = 10/1000 = 0.01 = 1%
Its often helpful to rewrite:
, Here, I(·) is an indicator function that takes on a value of 1 if the bracketed expression is true, and 0 otherwise. So if expenditure (yi) is less than the poverty line (z), then I(·) equals 1 and the household would be counted as poor.
This index is easy to understand, but has few disadvantages. It does not show the poverty rate. In addition, the headcount index does not show how poor the poor are. Moreover, this estimate is made on households and not on individuals.[13]
Poverty gap index (P1)
The Poverty gap index is the mean distance below the poverty line as a proportion of the poverty line where the mean is taken over the whole population, counting the non-poor as having zero poverty gap.
Using the index function, we have: , where define the poverty gap (Gi) as the poverty line (z) less actual income (yi) for poor individuals; the gap is considered to be zero for everyone else.
Could be rewrite:
The poverty gap index denotes the extent to which individuals fall below the poverty line (poverty gap) as a proportion of the poverty line. By summing these poverty gaps we derive the minimum cost of eliminating poverty.[14]
This method is only reasonable if the transfers could be made perfectly efficiently, which is unlikely.[13]
Squared Poverty Gap Index (Poverty severity index, P2)
The squared poverty gap index is conducted by averaging the squares of the poverty gaps relative to the poverty line. This measure emphasizes extreme poverty and gives it a greater weight than less poverty. One of its benefits is the possibility of variation in the weight of income level of the poorest part of society. The Poverty severity index can also be disaggregated for population subgroups.[14]
Sen index
The Sen index connects the number of poor with the size of their poverty and the distribution of poverty in the sample.[13]
Sen-Shorrocks-Thon Index
The Sen-Shorrocks-Thon index (sometimes referred to as SST index) is an improved version of the Sen index.[13]
The Sen-Shorrocks-Thon index takes into perspective measures of the proportion of poor people, the extent of their poverty and the distribution of welfare among the poor. This index enables us to decompose poverty into three components and answer these questions: Are there more poor? Is their depth of poverty worsening? Is there higher inequality among the poor?[14]
Asset-based measures
Other point of view defines poverty and in terms of assets. These asset-based measures may consider the real financial asset holdings, access to the credit market and poverty related to a household’s wealth. An example of those may be income net worth measures, asset-poverty and financial vulnerability.
Being asset poor does not imply being income poor and vice versa. For example, the importance of being asset wealthy is lower in countries with secure employment as it ensures stable living standards, while in other countries it may be needed as a cushion against uncertainties and shocks.[15]
High-frequency poverty measures
Real-time information on poverty and people’s well-being has yet to be developed. There is already incentive to conduct a few pilot projects with the help of mobile phones by the World Bank in South Sudan,[16] Peru, and Tanzania.[17]
Supplemental and Official Measures in the USA
The Official Poverty Measure takes into account the individual’s of family’s pretax cash income and a size and age varied set of thresholds but is not effected by in-kind programs (e.g. housing and energy programs, nutrition assistance), tax credits or the regional differences in living costs.[18]
In order of better understanding of the economic well-being of American families and easier interpretation of effectiveness of federal policies, the Supplemental Poverty Measure (SPM) was developed by the Census Bureau and the U.S. Bureau of Labor Statistics in 2010. In the next few years several new methodological improvements were made to SPM. The SPM does take into consideration family resources and expenses not included in the OPM and the geographical conditions.[18]
The demographic profile of the poverty population differs under the SPM and OPM measures. Comparatively, the poverty rate of children is lower in terms of SPM and a higher poverty rate is conducted among the elderly (older than 65). The poverty rate of the working-age population fluctuates from year to year between the two poverty measures. The Supplemental Poverty Measure highlights medical and work-related expenses compared to the Official Poverty Measure and gives policymakers clearer picture of the outcome of government programs.[19]
Examples of country-specific initiatives
Multidimensional Poverty Index (Mexico)
Mexico was the first country to introduce an official multidimensional poverty measure, an index which, in addition to considering the lack of economic resources, includes other dimensions that social policy must address. The National Council developed the Multidimensional Poverty Index (MPI) for the Evaluation of Social Development Policy (CONEVAL), which is the agency responsible for evaluating poverty and social policy in Mexico.[20]
The MPI measures poverty according to seven indicators: income; education lag; access to healthcare services; access to social security; access to food, housing quality, and space; access to basic housing requirements; and degree of social cohesion.[20] The Mexican government uses the MPI to track progress in eradicating poverty over time and target social services and policies to those most in need, based on reports issued every two years.
Community-Based Drinking Water Supply and Sanitation Program
The Community-based Drinking Water Supply and Sanitation Program or Penyediaan Air Minum dan Sanitasi Berbasis Masyarakat (PAMSIMAS) approach in Indonesia acknowledges how poor sanitation impacts general health conditions and their social and economic aspects.[21] The PAMSIMAS approach motivates individuals to participate in community development by integrating themselves into identifying and fixing their sanitation problems. The approach is founded on the idea that local communities are more suited to identify and handle their sanitation requirements than federal or international authorities. The project offers grants directly to communities for local water and sanitation infrastructure. Facilitators and districts are also given access to training and consulting services to help them develop better sanitation and hygiene habits. Then, the facilitators assist communities in creating options for further development.[22] PAMSIMAS has successfully reduced open defecation and improved access to sanitation facilities in rural areas. According to the World Bank,[21] the percentage of communities targeted for available defecation-free status increased significantly from 0% to 58%, and roughly 81% of those schools improved their sanitation and hygiene initiatives.
National Rural Employment Guarantee Act (NREGA)
In 2005, India launched a national anti-poverty program, Mahatma Gandhi National Rural Employment Guarantee Act (NREGA). It guarantees 100 days of wage employment to every rural household that demands work.[23] The NREGA is a demand-driven program, meaning that households must apply for work under the scheme. The government is then obligated to employ within 15 days of the application. NREGA has been widely recognised as an effective tool for poverty reduction and rural development in India. In 2020, the scheme was extended to cover 116 districts affected by the COVID-19 pandemic, providing much-needed employment opportunities to vulnerable households in rural areas.[24]
Common survey problems
These surveys interpret data that has some common problems:
Random sample: All research is based on randomly selecting people into a sample, and each should have the same chance of being selected. Unfortunately, it is not easy for the sample not to be biased, because some groups of people are simply difficult to trace.
Sampling: We can see inequalities from experience and from surveys themselves. Surveys show us only an estimated formula. Another thing we should be interested in is how the sampling was performed. In areas with dense population, there is usually under-sampling.
Goods Coverage and Valuation: To cover and refine the information, we should ask the sample more generally. Not only the issues of income and expenditure are enough, but also own consumption from the family farm. It is necessary to gather information on housing and components of durable consumption.
Variability and the Time Period of Measurement: Income, consumption and other factors change over time. In less developed countries, therefore, the focus is only on consumption, which is more stable from income.
Comparisons across Households at Similar Consumption Levels: Comparisons between households are difficult because households differ not only in the size of income and expenditure, but also in the environment, leisure, quality of the environment, etc.[14]
Stats
Even if poverty may be lessening for the world as a whole, it continues to be an enormous problem:
One third of deaths — some 18 million people a year or 50,000 per day — are due to poverty-related causes. That's 270 million people since 1990, the majority women and children, roughly equal to the population of the US.
Every year nearly 11 million children die before their fifth birthday.
In 2001, 1.1 billion people had consumption levels below $1 a day and 2.7 billion lived on less than $2 a day.
800 million people go to bed hungry every day.[25]
Other factors
The World Bank's Voices of the Poor initiative,[26] based on research with over 20,000 poor people in 23 countries, identifies a range of factors that poor people consider elements of poverty. Most important are those necessary for material well-being, especially food. Many others relate to social rather than material issues.
↑Johnson, Kirk; Rector, Robert (5 January 2004). "Understanding Poverty in America". The Heritage Foundation. Archived from the original on March 3, 2017.
It is an area where not only is there little or no consensus among disciplines, but where economists themselves have widely differing views. So, what can one say with a fair degree of certainty about growth and inequality in developing countries? Life expectancy at birth — the most basic and robust of all social indicators — has increased very considerably around the world.
This page is based on this Wikipedia article Text is available under the CC BY-SA 4.0 license; additional terms may apply. Images, videos and audio are available under their respective licenses.

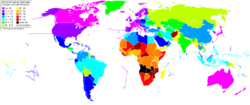
![World map of income inequality Gini coefficients by country (as %). Based on World Bank data ranging from 1992 to 2020.
.mw-parser-output figure[typeof="mw:File/Thumb"] .image-key>ol{margin-left:1.3em;margin-top:0}.mw-parser-output figure[typeof="mw:File/Thumb"] .image-key>ul{margin-top:0}.mw-parser-output figure[typeof="mw:File/Thumb"] .image-key li{page-break-inside:avoid;break-inside:avoid-column}@media(min-width:300px){.mw-parser-output figure[typeof="mw:File/Thumb"] .image-key,.mw-parser-output figure[typeof="mw:File/Thumb"] .image-key-wide{column-count:2}.mw-parser-output figure[typeof="mw:File/Thumb"] .image-key-narrow{column-count:1}}@media(min-width:450px){.mw-parser-output figure[typeof="mw:File/Thumb"] .image-key-wide{column-count:3}}
.mw-parser-output .plainlist ol,.mw-parser-output .plainlist ul{line-height:inherit;list-style:none;margin:0;padding:0}.mw-parser-output .plainlist ol li,.mw-parser-output .plainlist ul li{margin-bottom:0}
.mw-parser-output .legend{page-break-inside:avoid;break-inside:avoid-column}.mw-parser-output .legend-color{display:inline-block;min-width:1.25em;height:1.25em;line-height:1.25;margin:1px 0;text-align:center;border:1px solid black;background-color:transparent;color:black}.mw-parser-output .legend-text{}
Above 50
Between 45 and 50
Between 40 and 45
Between 35 and 40
Between 30 and 35
Below 30
No data Map of countries by GINI coefficient (1990 to 2020).svg](http://upload.wikimedia.org/wikipedia/commons/thumb/c/cc/Map_of_countries_by_GINI_coefficient_%281990_to_2020%29.svg/250px-Map_of_countries_by_GINI_coefficient_%281990_to_2020%29.svg.png)