Taguchi methods are statistical methods, or sometimes called robust design methods, developed by Genichi Taguchi to improve the quality of manufactured goods, and more recently also applied to engineering,biotechnology, marketing and advertising. Professional statisticians have welcomed the goals and improvements brought about by Taguchi methods, particularly by Taguchi's development of designs for studying variation, but have criticized the inefficiency of some of Taguchi's proposals.
In the statistical theory of the design of experiments, blocking is the arranging of experimental units in groups (blocks) that are similar to one another.

In statistical quality control, the and R chart is a type of control chart used to monitor variables data when samples are collected at regular intervals from a business or industrial process.

A Shock Response Spectrum (SRS) is a graphical representation of a shock, or any other transient acceleration input, in terms of how a Single Degree Of Freedom (SDOF) system would respond to that input. The horizontal axis shows the natural frequency of a hypothetical SDOF, and the vertical axis shows the peak acceleration which this SDOF would undergo as a consequence of the shock input.
In process improvement efforts, the process capability index or process capability ratio is a statistical measure of process capability: the ability of a process to produce output within specification limits. The concept of process capability only holds meaning for processes that are in a state of statistical control. Process capability indices measure how much "natural variation" a process experiences relative to its specification limits and allows different processes to be compared with respect to how well an organization controls them.

A Pareto chart, named after Vilfredo Pareto, is a type of chart that contains both bars and a line graph, where individual values are represented in descending order by bars, and the cumulative total is represented by the line.
Business process mapping refers to activities involved in defining what a business entity does, who is responsible, to what standard a business process should be completed, and how the success of a business process can be determined.

A run chart, also known as a run-sequence plot is a graph that displays observed data in a time sequence. Often, the data displayed represent some aspect of the output or performance of a manufacturing or other business process. It is therefore a form of line chart.
River regime can describe one of two characteristics of a reach of an alluvial river:

Joseph Moses Juran was a Romanian-born American engineer and management consultant. He was an evangelist for quality and quality management, having written several books on those subjects. He was the brother of Academy Award winner Nathan H. Juran.

An oscilloscope, previously called an oscillograph, and informally known as a scope or o-scope, CRO, or DSO, is a type of electronic test instrument that graphically displays varying signal voltages, usually as a two-dimensional plot of one or more signals as a function of time. Other signals can be converted to voltages and displayed.
Repeated measures design is a research design that involves multiple measures of the same variable taken on the same or matched subjects either under different conditions or over two or more time periods. For instance, repeated measurements are collected in a longitudinal study in which change over time is assessed.
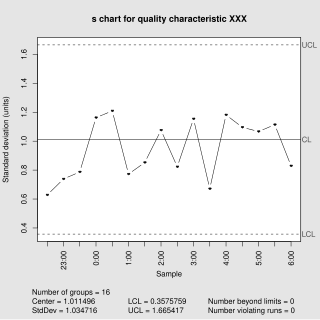
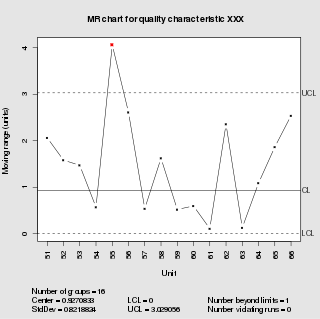
In statistical quality control, the and s chart is a type of control chart used to monitor variables data when samples are collected at regular intervals from a business or industrial process.
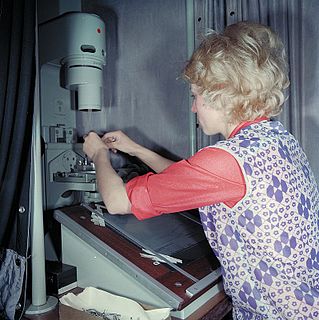
Laboratory quality control is designed to detect, reduce, and correct deficiencies in a laboratory's internal analytical process prior to the release of patient results, in order to improve the quality of the results reported by the laboratory. Quality control is a measure of precision, or how well the measurement system reproduces the same result over time and under varying operating conditions. Laboratory quality control material is usually run at the beginning of each shift, after an instrument is serviced, when reagent lots are changed, after calibration, and whenever patient results seem inappropriate. Quality control material should approximate the same matrix as patient specimens, taking into account properties such as viscosity, turbidity, composition, and color. It should be simple to use, with minimal vial to vial variability, because variability could be misinterpreted as systematic error in the method or instrument. It should be stable for long periods of time, and available in large enough quantities for a single batch to last at least one year. Liquid controls are more convenient than lyophilized controls because they do not have to be reconstituted minimizing pipetting error.
Dorian Shainin was an American quality consultant, aeronautics engineer, author, and college professor most notable for his contributions in the fields of industrial problem solving, product reliability, and quality engineering, particularly the creation and development of the "Red X" concept.

Maximum elevation figure or MEF is a type of VFR altitude which indicates the height of the highest feature within a quadrangle area. It is of interest to pilots, who want to be aware of the highest mountain peaks and tall towers nearby, so that they can fly above them to avoid controlled flight into terrain. In a VFR context, this altitude is commonly referred to as a "quadrantal altitude"
Quality by Design (QbD) is a concept first outlined by quality expert Joseph M. Juran in publications, most notably Juran on Quality by Design. Designing for quality and innovation is one of the three universal processes of the Juran Trilogy, in which Juran describes what is required to achieve breakthroughs in new products, services, and processes. Juran believed that quality could be planned, and that most quality crises and problems relate to the way in which quality was planned.
The minimum control speed (VMC) of an aircraft is a V-speed that specifies the calibrated airspeed below which directional or lateral control of the aircraft can no longer be maintained, after the failure of one or more engines. The VMC only applies if at least one engine is still operative, and will depend on the stage of flight. Indeed, multiple VMCs have to be calculated for landing, air travel, and ground travel, and there are more still for aircraft with four or more engines. These are all included in the aircraft flight manual of all multi-engine aircraft. When design engineers are sizing an airplane's vertical tail and flight control surfaces, they have to take into account the effect this will have on the airplane's minimum control speeds.