Related Research Articles
Engineering statistics combines engineering and statistics using scientific methods for analyzing data. Engineering statistics involves data concerning manufacturing processes such as: component dimensions, tolerances, type of material, and fabrication process control. There are many methods used in engineering analysis and they are often displayed as histograms to give a visual of the data as opposed to being just numerical. Examples of methods are:
- Design of Experiments (DOE) is a methodology for formulating scientific and engineering problems using statistical models. The protocol specifies a randomization procedure for the experiment and specifies the primary data-analysis, particularly in hypothesis testing. In a secondary analysis, the statistical analyst further examines the data to suggest other questions and to help plan future experiments. In engineering applications, the goal is often to optimize a process or product, rather than to subject a scientific hypothesis to test of its predictive adequacy. The use of optimal designs reduces the cost of experimentation.
- Quality control and process control use statistics as a tool to manage conformance to specifications of manufacturing processes and their products.
- Time and methods engineering use statistics to study repetitive operations in manufacturing in order to set standards and find optimum manufacturing procedures.
- Reliability engineering which measures the ability of a system to perform for its intended function and has tools for improving performance.
- Probabilistic design involving the use of probability in product and system design
- System identification uses statistical methods to build mathematical models of dynamical systems from measured data. System identification also includes the optimal design of experiments for efficiently generating informative data for fitting such models.

In statistics, the standard deviation is a measure of the amount of variation of a random variable expected about its mean. A low standard deviation indicates that the values tend to be close to the mean of the set, while a high standard deviation indicates that the values are spread out over a wider range. The standard deviation is commonly used in the determination of what constitutes an outlier and what does not.
Accuracy and precision are two measures of observational error.
Six Sigma (6σ) is a set of techniques and tools for process improvement. It was introduced by American engineer Bill Smith while working at Motorola in 1986.

Control charts are graphical plots used in production control to determine whether quality and manufacturing processes are being controlled under stable conditions. The hourly status is arranged on the graph, and the occurrence of abnormalities is judged based on the presence of data that differs from the conventional trend or deviates from the control limit line. Control charts are classified into Shewhart individuals control chart and CUSUM(CUsUM)(or cumulative sum control chart)(ISO 7870-4).

Engineering tolerance is the permissible limit or limits of variation in:
- a physical dimension;
- a measured value or physical property of a material, manufactured object, system, or service;
- other measured values ;
- in engineering and safety, a physical distance or space (tolerance), as in a truck (lorry), train or boat under a bridge as well as a train in a tunnel ;
- in mechanical engineering, the space between a bolt and a nut or a hole, etc.
The standard error (SE) of a statistic is the standard deviation of its sampling distribution or an estimate of that standard deviation. If the statistic is the sample mean, it is called the standard error of the mean (SEM). The standard error is a key ingredient in producing confidence intervals.
Statistical process control (SPC) or statistical quality control (SQC) is the application of statistical methods to monitor and control the quality of a production process. This helps to ensure that the process operates efficiently, producing more specification-conforming products with less waste scrap. SPC can be applied to any process where the "conforming product" output can be measured. Key tools used in SPC include run charts, control charts, a focus on continuous improvement, and the design of experiments. An example of a process where SPC is applied is manufacturing lines.
In probability theory and statistics, the coefficient of variation (CV), also known as normalized root-mean-square deviation (NRMSD), percent RMS, and relative standard deviation (RSD), is a standardized measure of dispersion of a probability distribution or frequency distribution. It is defined as the ratio of the standard deviation to the mean , and often expressed as a percentage ("%RSD"). The CV or RSD is widely used in analytical chemistry to express the precision and repeatability of an assay. It is also commonly used in fields such as engineering or physics when doing quality assurance studies and ANOVA gauge R&R, by economists and investors in economic models, and in psychology/neuroscience.
The process capability index, or process capability ratio, is a statistical measure of process capability: the ability of an engineering process to produce an output within specification limits. The concept of process capability only holds meaning for processes that are in a state of statistical control. This means it cannot account for deviations which are not expected, such as misaligned, damaged, or worn equipment. Process capability indices measure how much "natural variation" a process experiences relative to its specification limits, and allows different processes to be compared to how well an organization controls them. Somewhat counterintuitively, higher index values indicate better performance, with zero indicating high deviation.
ANOVA gage repeatability and reproducibility is a measurement systems analysis technique that uses an analysis of variance (ANOVA) random effects model to assess a measurement system.
Production Part Approval Process (PPAP) is used in the Aerospace or automotive supply chain for establishing confidence in suppliers and their production processes. Actual measurements are taken from the parts produced and are used to complete the various test sheets of PPAP.
"All customer engineering design record and specification requirements are properly understood by the supplier and that the process has the potential to produce product consistently meeting these requirements during an actual production run at the quoted production rate." Version 4, 1 March 2006

A run chart, also known as a run-sequence plot is a graph that displays observed data in a time sequence. Often, the data displayed represent some aspect of the output or performance of a manufacturing or other business process. It is therefore a form of line chart.
In process improvement efforts, the process performance index is an estimate of the process capability of a process during its initial set-up, before it has been brought into a state of statistical control.
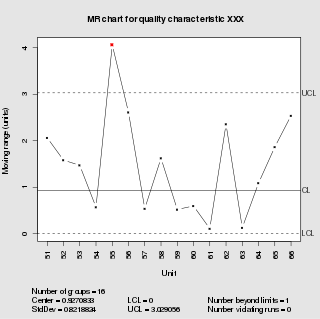
In statistical quality control, the individual/moving-range chart is a type of control chart used to monitor variables data from a business or industrial process for which it is impractical to use rational subgroups.
Process window index (PWI) is a statistical measure that quantifies the robustness of a manufacturing process, e.g. one which involves heating and cooling, known as a thermal process. In manufacturing industry, PWI values are used to calibrate the heating and cooling of soldering jobs while baked in a reflow oven.
Tolerance analysis is the general term for activities related to the study of accumulated variation in mechanical parts and assemblies. Its methods may be used on other types of systems subject to accumulated variation, such as mechanical and electrical systems. Engineers analyze tolerances for the purpose of evaluating geometric dimensioning and tolerancing (GD&T). Methods include 2D tolerance stacks, 3D Monte Carlo simulations, and datum conversions.

In statistics, dispersion is the extent to which a distribution is stretched or squeezed. Common examples of measures of statistical dispersion are the variance, standard deviation, and interquartile range. For instance, when the variance of data in a set is large, the data is widely scattered. On the other hand, when the variance is small, the data in the set is clustered.

In statistical quality control, the EWMA chart is a type of control chart used to monitor either variables or attributes-type data using the monitored business or industrial process's entire history of output. While other control charts treat rational subgroups of samples individually, the EWMA chart tracks the exponentially-weighted moving average of all prior sample means. EWMA weights samples in geometrically decreasing order so that the most recent samples are weighted most highly while the most distant samples contribute very little.
References
- Pyzdek, T, "Quality Engineering Handbook", 2003, ISBN 0-8247-4614-7
- Bothe, D. R., "Measuring Process Capability", 2001, ISBN 0-07-006652-3
- Godfrey, A. B., "Juran's Quality Handbook", 1999, ISBN 007034003X
- ASTM E2281 Standard Practice for Process and Measurement Capability Indices