Related Research Articles
A quality management system (QMS) is a collection of business processes focused on consistently meeting customer requirements and enhancing their satisfaction. It is aligned with an organization's purpose and strategic direction. It is expressed as the organizational goals and aspirations, policies, processes, documented information, and resources needed to implement and maintain it. Early quality management systems emphasized predictable outcomes of an industrial product production line, using simple statistics and random sampling. By the 20th century, labor inputs were typically the most costly inputs in most industrialized societies, so focus shifted to team cooperation and dynamics, especially the early signaling of problems via a continual improvement cycle. In the 21st century, QMS has tended to converge with sustainability and transparency initiatives, as both investor and customer satisfaction and perceived quality are increasingly tied to these factors. Of QMS regimes, the ISO 9000 family of standards is probably the most widely implemented worldwide – the ISO 19011 audit regime applies to both and deals with quality and sustainability and their integration.
Productivity is the efficiency of production of goods or services expressed by some measure. Measurements of productivity are often expressed as a ratio of an aggregate output to a single input or an aggregate input used in a production process, i.e. output per unit of input, typically over a specific period of time. The most common example is the (aggregate) labour productivity measure, e.g., such as GDP per worker. There are many different definitions of productivity and the choice among them depends on the purpose of the productivity measurement and/or data availability. The key source of difference between various productivity measures is also usually related to how the outputs and the inputs are aggregated into scalars to obtain such a ratio-type measure of productivity. Types of production are mass production and batch production.

Diminishing returns is an economic principle stating that decreasing in marginal (incremental) output of a production process as the amount of a single factor of production is incrementally increased, holding all other factors of production equal. The law of diminishing returns states that in productive processes, increasing a factor of production by one unit, while holding all other production factors constant, will at some point return a lower unit of output per incremental unit of input. After the point of optimum production, excessively adding to the input variable will not only lead to a decrease in efficiency, but also to a negative return of production. A negative return might hurt the whole production process.

A performance indicator or key performance indicator (KPI) is a type of performance measurement. KPIs evaluate the success of an organization or of a particular activity in which it engages.
The productivity paradox, also referred to as the Solow paradox, could refer either to the slowdown in productivity growth in the United States in the 1970s and 1980s despite rapid development in the field of information technology (IT) over the same period, or to the slowdown in productivity growth in the United States and developed countries from the 2000s to 2020s; sometimes the newer slowdown is referred to as the productivity slowdown, the productivity puzzle, or the productivity paradox 2.0. The 1970s to 1980s productivity paradox inspired many research efforts at explaining the slowdown, only for the paradox to disappear with renewed productivity growth in the developed countries in the 1990s. However, issues raised by those research efforts remain important in the study of productivity growth in general, and became important again when productivity growth slowed around the world again from the 2000s to the present day.
Quality, cost, delivery (QCD), sometimes expanded to quality, cost, delivery, morale, safety (QCDMS), is a management approach originally developed by the British automotive industry. QCD assess different components of the production process and provides feedback in the form of facts and figures that help managers make logical decisions. By using the gathered data, it is easier for organizations to prioritize their future goals. QCD helps break down processes to organize and prioritize efforts before they grow overwhelming.
Workforce management (WFM) is an institutional process that maximizes performance levels and competency for an organization. The process includes all the activities needed to maintain a productive workforce, such as field service management, human resource management, performance and training management, data collection, recruiting, budgeting, forecasting, scheduling and analytics.
Capacity planning is the process of determining the production capacity needed by an organization to meet changing demands for its products. In the context of capacity planning, design capacity is the maximum amount of work that an organization is capable of completing in a given period. Effective capacity is the maximum amount of work that an organization is capable of completing in a given period due to constraints such as quality problems, delays, material handling, etc.
High availability (HA) is a characteristic of a system which aims to ensure an agreed level of operational performance, usually uptime, for a higher than normal period.
Takt time, or simply Takt, is a manufacturing term to describe the required product assembly duration that is needed to match the demand. Often confused with cycle time, takt time is a tool used to design work and it measures the average time interval between the start of production of one unit and the start of production of the next unit when items are produced sequentially. For calculations, it is the time to produce parts divided by the number of parts demanded in that time interval. The takt time is based on customer demand; if a process or a production line are unable to produce at takt time, either demand leveling, additional resources, or process re-engineering is needed to ensure on-time delivery.

Workforce productivity is the amount of goods and services that a group of workers produce in a given amount of time. It is one of several types of productivity that economists measure. Workforce productivity, often referred to as labor productivity, is a measure for an organisation or company, a process, an industry, or a country.

Open-end spinning is a technology for creating yarn without using a spindle. It was invented and developed in Czechoslovakia in Výzkumný ústav bavlnářský / Cotton Research Institute in Ústí nad Orlicí in 1963.

Production is the process of combining various material inputs and immaterial inputs in order to make something for consumption (output). It is the act of creating an output, a good or service which has value and contributes to the utility of individuals. The area of economics that focuses on production is referred to as production theory, which is intertwined with the consumption theory of economics.
Overall Equipment Effectiveness (OEE) is a measure of how well a manufacturing operation is utilized compared to its full potential, during the periods when it is scheduled to run. It identifies the percentage of manufacturing time that is truly productive. An OEE of 100% means that only good parts are produced, at the maximum speed, and without interruption.
Manufacturing execution systems (MES) are computerized systems used in manufacturing to track and document the transformation of raw materials to finished goods. MES provides information that helps manufacturing decision makers understand how current conditions on the plant floor can be optimized to improve production output. MES works as real time monitoring system to enable the control of multiple elements of the production process.
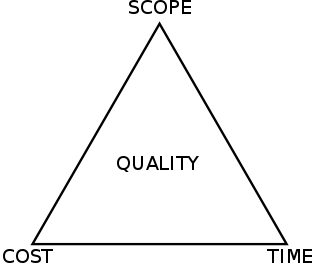
The project management triangle is a model of the constraints of project management. While its origins are unclear, it has been used since at least the 1950s. It contends that:
- The quality of work is constrained by the project's budget, deadlines and scope (features).
- The project manager can trade between constraints.
- Changes in one constraint necessitate changes in others to compensate or quality will suffer.

In economics, a factor market is a market where factors of production are bought and sold. Factor markets allocate factors of production, including land, labour and capital, and distribute income to the owners of productive resources, such as wages, rents, etc.
The following outline is provided as an overview of and topical guide to production:
Total Productive Maintenance (TPM) started as a method of physical asset management focused on maintaining and improving manufacturing machinery, in order to reduce the operating cost to an organization. After the PM award was created and awarded to Nippon Denso in 1971, the JIPM, expanded it to include 8 pillars of TPM that required involvement from all areas of manufacturing in the concepts of lean Manufacturing. TPM is designed to disseminate the responsibility for maintenance and machine performance, improving employee engagement and teamwork within management, engineering, maintenance, and operations.
There are eight types of pillars TPM.
In lean manufacturing, machine operator efficiency (MOE) is the performance of an employee who operates industrial machinery. The operator's efficiency is measured as the time spent producing product divided by the time the operator is on duty. For example: if an operator is assigned to run a CNC machine tool for seven hours, but they only have four hours' worth of continuous uninterrupted output of workpieces—their MOE rating is 57% for this seven-hour period of time.
References
- ↑ RP news wires, Noria Corporation. "New KPI measures plants' overall labor effectiveness" . Retrieved November 30, 2011.
- ↑ Gordon, Gregg (2011). Lean Labor Strategies. Kronos Publishing. p. 68.
- ↑ Nguyen, Mark. "How Ceradyne Increased Productivity through Effective Labor Management". IndustryWeek. Retrieved November 30, 2011.