Results of the 2007 Australian federal election in South Australia

Last updated

2007 Australian federal election
(South Australia)
Flag of South Australia.svg
  2004 24 November 2007 2010  

All 11 South Australian seats in the Australian House of Representatives
and 6 seats in the Australian Senate
 First partySecond party
  Kevin Rudd official portrait.jpg PMincoffs.jpg
Leader Kevin Rudd John Howard
Party Labor Liberal/National coalition
Last election3 seats8 seats
Seats won6 seats5 seats
Seat changeIncrease2.svg 3Decrease2.svg 3
Popular vote 426,639425,041
Percentage43.18%43.02%
SwingIncrease2.svg 6.43Decrease2.svg 5.40
TPP 52.40%47.60%
TPP swingIncrease2.svg 6.76Decrease2.svg 6.76

This is a list of electoral division results for the Australian 2007 federal election in the state of South Australia. [1] [2] [3]

Contents

Overall results

Electoral divisions: South Australia Map82007.gif
Electoral divisions: South Australia
Turnout 95.42% (CV) — Informal 3.78% [1]
PartyVotes%SwingSeatsChange
  Labor 426,63943.18+6.436Increase2.svg 3
  Liberal  412,62141.76–5.645Decrease2.svg 3
  National 12,4201.26+0.240Steady2.svg
Liberal–National coalition 425,04143.01−5.415Decrease2.svg 3
  Greens 68,6406.95+1.51
  Family First 40,0314.05–0.26
  Democrats 14,9571.51–0.37
  One Nation 1,6430.17–0.96
  Liberty and Democracy Party 1,6370.17+0.17
  What Women Want 1,4550.15+0.15
  Climate Conservatives 1,1650.12+0.12
  Independents 6,9440.70–1.34
Total988,152  11
Two-party-preferred vote
  Labor 517,81852.40+6.766Increase2.svg 3
  Liberal 470,33447.60–6.765Decrease2.svg 3
Invalid/blank votes38,8303.78−1.78
Registered voters/turnout1,076,22095.42
Source: Commonwealth Election 2007

Liberal to Labor: Kingston, Makin, Wakefield. [4]

Results by division

Adelaide

2007 Australian federal election: Adelaide [3]
PartyCandidateVotes%±%
Labor Kate Ellis 42,77448.26+6.34
Liberal Tracy Marsh34,05638.43−6.86
Greens Peter Solly8,6419.75+1.76
Family First Dennis Slape1,8012.03−0.03
Democrats Sandy Biar1,3531.53−0.06
Total formal votes88,62596.89+1.29
Informal votes2,8403.11−1.29
Turnout 91,46594.56+0.94
Two-party-preferred result
Labor Kate Ellis 51,86858.53+7.20
Liberal Tracy Marsh36,75741.47−7.20
Labor hold Swing +7.20

Barker

2007 Australian federal election: Barker
PartyCandidateVotes%±%
Liberal Patrick Secker 44,32946.81−6.36
Labor Karen Lock28,47530.07+8.60
National Deb Thiele9,69510.24−0.35
Family First Phil Cornish5,4185.72−0.10
Greens Andrew Jennings4,7965.06+0.98
Democrats Justin Sneath1,9842.10+0.62
Total formal votes94,69796.15+2.02
Informal votes3,7933.85−2.02
Turnout 98,49095.97+0.49
Two-party-preferred result
Liberal Patrick Secker 56,30159.45−10.43
Labor Karen Lock38,39640.55+10.43
Liberal hold Swing −10.43

Boothby

2007 Australian federal election: Boothby
PartyCandidateVotes%±%
Liberal Andrew Southcott 41,34346.25−4.37
Labor Nicole Cornes 30,50134.12−1.72
Greens Jodi Kirkby9,13710.22+3.11
Independent Ray McGhee4,3904.91+4.91
Family First Andrew Cole2,1832.44−0.54
Democrats Craig Bossie1,3801.54−0.49
One Nation Barbara Pannach3090.35−0.32
Liberty & Democracy David Humphreys1540.17+0.17
Total formal votes89,39797.13+1.54
Informal votes2,6392.87−1.54
Turnout 92,03695.64+1.05
Two-party-preferred result
Liberal Andrew Southcott 47,32252.93−2.44
Labor Nicole Cornes 42,07547.07+2.44
Liberal hold Swing −2.44

Grey

2007 Australian federal election: Grey
PartyCandidateVotes%±%
Liberal Rowan Ramsey 42,13247.26-9.24
Labor Karin Bolton34,46638.66+8.35
Family First Mal Holland4,0094.50-0.55
Greens Rosalie Garland3,6694.12+0.82
National Wilbur Klein2,7253.06+3.06
Democrats Gil Robertson1,0941.23-1.11
Independent David Wright1,0501.18+1.18
Total formal votes89,14595.75+0.80
Informal votes3,9614.25-0.80
Turnout 93,10694.93+0.74
Two-party-preferred result
Liberal Rowan Ramsey 48,52254.43-9.39
Labor Karin Bolton40,62345.57+9.39
Liberal hold Swing -9.39

Hindmarsh

2007 Australian federal election: Hindmarsh
PartyCandidateVotes%±%
Labor Steve Georganas 42,81847.21+4.88
Liberal Rita Bouras36,35640.08-5.80
Greens Tim White6,3356.98+1.87
Family First Richard Bunting1,9252.12-0.13
Democrats Jen Williams1,8182.00+0.43
What Women Want Heidi Robins6620.73+0.73
Independent Clinton Duncan6190.68+0.68
Liberty & Democracy James Warry1710.19+0.19
Total formal votes90,70496.16+3.09
Informal votes3,6183.84-3.09
Turnout 94,32295.33+0.62
Two-party-preferred result
Labor Steve Georganas 49,93755.05+4.99
Liberal Rita Bouras40,76744.95-4.99
Labor hold Swing +4.99

Kingston

2007 Australian federal election: Kingston
PartyCandidateVotes%±%
Labor Amanda Rishworth 42,21246.65+4.36
Liberal Kym Richardson 35,96139.74-3.85
Family First Robert Brokenshire 5,1695.71+0.07
Greens Bill Weller5,1325.67+0.37
Democrats Matthew Fowler8590.95-1.21
Independent Barry Becker5050.56+0.56
Independent Alex Kusznir3800.42+0.42
Liberty & Democracy Lachlan Smith2730.30+0.30
Total formal votes90,49196.27+2.04
Informal votes3,5053.73-2.04
Turnout 93,99696.00+0.69
Two-party-preferred result
Labor Amanda Rishworth 49,24754.42+4.49
Liberal Kym Richardson 41,24445.58-4.49
Labor gain from Liberal Swing +4.49

Makin

2007 Australian federal election: Makin
PartyCandidateVotes%±%
Labor Tony Zappia 44,89051.45+8.43
Liberal Bob Day 33,39038.27-6.44
Greens Graham Smith3,7514.30+0.51
Family First Andrew Graham3,0963.55-1.37
Democrats Aleisha Brown1,1981.37-0.38
One Nation Robert Fechner5020.58-0.26
Liberty & Democracy Garry Vandersluis4280.49+0.49
Total formal votes87,25595.93+1.34
Informal votes3,7054.07-1.34
Turnout 90,96095.81+0.34
Two-party-preferred result
Labor Tony Zappia 50,34657.70+8.63
Liberal Bob Day 36,90942.30-8.63
Labor gain from Liberal Swing +8.63

Mayo

2007 Australian federal election: Mayo
PartyCandidateVotes%±%
Liberal Alexander Downer 45,89351.08-2.56
Labor Mary Brewerton27,95731.12+14.63
Greens Lynton Vonow9,84910.96+3.36
Family First Trish Nolan3,6154.02+0.37
Democrats Andrew Castrique1,3691.52-0.29
Climate Conservatives Rachael Barons1,1651.30+1.30
Total formal votes89,84897.24+1.88
Informal votes2,5502.76-1.88
Turnout 92,39895.85+0.64
Two-party-preferred result
Liberal Alexander Downer 51,26457.06-6.53
Labor Mary Brewerton38,58442.94+6.53
Liberal hold Swing N/A

Port Adelaide

2007 Australian federal election: Port Adelaide
PartyCandidateVotes%±%
Labor Mark Butler 52,73258.24+3.73
Liberal Brenton Chomel22,83025.21-6.71
Greens Colin Thomas7,9358.76+3.34
Family First Bruce Hambour5,2305.78+1.01
Democrats Pam Moore1,8222.01+0.01
Total formal votes90,54995.04+2.12
Informal votes4,7244.96-2.12
Turnout 95,27395.04+0.70
Two-party-preferred result
Labor Mark Butler 63,15869.75+6.84
Liberal Brenton Chomel27,39130.25-6.84
Labor hold Swing +6.84

Sturt

2007 Australian federal election: Sturt
PartyCandidateVotes%±%
Liberal Christopher Pyne 42,73147.17-4.49
Labor Mia Handshin 37,56541.46+6.91
Greens Sally Reid5,8066.41+0.35
Family First Carol Jensen3,1023.42-1.36
Democrats Paul Rowse1,0541.17-1.09
Liberty & Democracy Felicity Tilbrook3270.36+0.36
Total formal votes90,59596.54+1.58
Informal votes3,2493.46-1.58
Turnout 93,84495.61+0.82
Two-party-preferred result
Liberal Christopher Pyne 46,15350.94-5.86
Labor Mia Handshin 44,44149.06+5.86
Liberal hold Swing -5.86

Wakefield

2007 Australian federal election: Wakefield
PartyCandidateVotes%±%
Labor Nick Champion 42,24948.65+6.28
Liberal David Fawcett 33,60038.69-5.12
Family First Bruce Nairn4,4835.16-0.27
Greens Terry Allen3,5894.13-0.02
Democrats Felicity Martin1,0161.17-0.50
One Nation Peter Fitzpatrick8320.96-1.60
What Women Want Pauline Edmunds7930.91+0.91
Liberty & Democracy Martin Walsh2840.33+0.33
Total formal votes86,84695.34+1.82
Informal votes4,2464.66-1.82
Turnout 91,09295.16+0.18
Two-party-preferred result
Labor Nick Champion 49,14256.59+7.26
Liberal David Fawcett 37,70443.41-7.26
Labor gain from Liberal Swing +7.26

See also

Related Research Articles

<span class="mw-page-title-main">Divisions of the Australian House of Representatives</span> Federal electorates in Australia

In Australia, electoral districts for the Australian House of Representatives are called divisions or more commonly referred to as electorates or seats. There are currently 151 single-member electorates for the Australian House of Representatives.

<span class="mw-page-title-main">Division of Indi</span> Australian federal electoral division

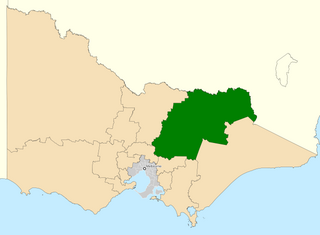
The Division of Indi is an Australian electoral division in the state of Victoria. The division is located in the north-east of the state, adjoining the border with New South Wales. The largest settlements in the division are the regional cities of Wodonga, Wangaratta, and Benalla. Other towns in the electorate include Rutherglen, Mansfield, Beechworth, Myrtleford, Bright, Alexandra, Tallangatta, Corryong and a number of other small villages. While Indi is one of the largest electorates in Victoria, much of it is located within the largely uninhabited Australian Alps. While Wodonga serves as a regional hub for much of the more heavily populated northern part of the electorate, the southern part is closer to Melbourne than Wodonga.

This is a list of electoral results for the Division of Banks in Australian federal elections from the division's creation in 1949 until the present.

This is a list of electoral results for the Division of Bennelong in Australian federal elections from the electorate's creation in 1949 until the present.

This is a list of electoral results for the Division of Macarthur in Australian federal elections from the division's creation in 1949 until the present.

This is a list of electoral results for the Division of Mackellar in Australian federal elections from the division's creation in 1949 until the present.

This is a list of electoral results for the Division of Mitchell in Australian federal elections from the division's creation in 1949 until the present.

This is a list of electoral results for the Division of Paterson in Australian federal elections from the division's creation in 1949 until its abolition in 1984, and then from its recreation in 1993 until the present.

This is a list of electoral results for the Division of Warringah in Australian federal elections from the division's creation in 1922 until the present.

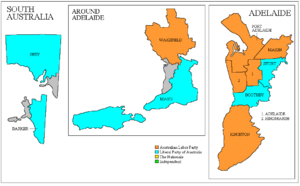
This is a list of electoral results for the Division of Adelaide in Australian federal elections from the division's creation in 1903 until the present.

This is a list of electoral results for the Division of Bass in Australian federal elections from the division's creation in 1903 until the present.

This is a list of electoral results for the Division of Braddon in Australian federal elections from the division's creation in 1955 until the present.

This is a list of electoral results for the Division of Denison in Australian federal elections from the division's creation in 1903 until it was abolished in 2019 and replaced with Clark.

This is a list of electoral results for the Division of Lyons in Australian federal elections from the division's creation in 1984 until the present.

This is a list of electoral results for the Division of Franklin in Australian federal elections from the division's creation in 1903 until the present.

<span class="mw-page-title-main">Results of the 2007 Australian federal election in Tasmania</span>

This is a list of electoral division results for the Australian 2007 federal election in the state of Tasmania.

<span class="mw-page-title-main">Results of the 2004 Australian federal election in Tasmania</span>

This is a list of electoral division results for the Australian 2004 federal election in the state of Tasmania.

<span class="mw-page-title-main">Results of the 2007 Australian federal election in New South Wales</span>

This is a list of electoral division results in the Australian 2007 federal election for the state of New South Wales.

<span class="mw-page-title-main">Results of the 2007 Australian federal election in Victoria</span>

This is a list of electoral division results for the Australian 2007 federal election in the state of Victoria.

<span class="mw-page-title-main">Results of the 2001 Australian federal election in Tasmania</span>

This is a list of electoral division results for the Australian 2001 federal election in the state of Tasmania.

References

  1. 1 2 "2007 First preference votes for South Australia". Australian Electoral Commission. Retrieved 24 May 2022.
  2. "2007 South Australia division results". Australian Electoral Commission. Retrieved 24 May 2022.
  3. 1 2 "2007 House of Representatives: South Australia". Psephos Adam Carr's Election Archive. Retrieved 4 June 2022.
  4. Bennett, Scott; Kopras, Andrew; Newman, Gerrard (2005). "Commonwealth Election 2007" (PDF). Research Paper 30 2007–08. Parliamentary Library. ISSN   1834-9854.