Results of the 2007 Australian federal election in Victoria

Last updated

2007 Australian federal election
(Victoria)
Flag of Victoria (Australia).svg
  2004 24 November 2007 2010  

All 37 Victorian seats in the Australian House of Representatives
and 6 seats in the Australian Senate
 First partySecond party
  Kevin Rudd official portrait.jpg PMincoffs.jpg
Leader Kevin Rudd John Howard
Party Labor Liberal/National coalition
Last election19 seats18 seats
Seats won21 seats16 seats
Seat changeIncrease2.svg 2Decrease2.svg 2
Popular vote1,416,2151,302,785
Percentage44.69%41.11%
SwingIncrease2.svg 4.24Decrease2.svg 5.64
TPP 54.27%45.73%
TPP swingIncrease2.svg 5.27Decrease2.svg 5.27

This is a list of electoral division results for the Australian 2007 federal election in the state of Victoria. [1] [2] [3]

Contents

Overall results

Electoral divisions: Victoria Map32007.gif
Electoral divisions: Victoria
Electoral divisions: Melbourne area Map42007.gif
Electoral divisions: Melbourne area
Turnout 95.17% (CV) — Informal 3.26% [1]
PartyVotes %SwingSeatsChange
  Australian Labor Party 1,416,21544.69+4.2421Increase2.svg 2
  Liberal Party of Australia 1,206,92638.09–5.1514Decrease2.svg 2
  Australian Greens 258,8468.17+0.720Steady2.svg
  National Party of Australia 95,8593.02–0.492Steady2.svg
  Family First Party 95,6633.02+0.640Steady2.svg
  Australian Democrats 38,8141.22+0.150Steady2.svg
  Citizens Electoral Council 8,6560.27–0.200Steady2.svg
  Democratic Labor Party 6,0180.19+0.140Steady2.svg
  Liberty and Democracy Party 3,2800.10+0.100Steady2.svg
  Socialist Alliance 2,2900.07–0.050Steady2.svg
  What Women Want 1,8250.06+0.060Steady2.svg
  Christian Democratic Party 1,2110.04+0.020Steady2.svg
  Socialist Equality Party 6910.02+0.020Steady2.svg
  One Nation 4330.01–0.130Steady2.svg
  Independents 31,6451.00+0.000Steady2.svg
 Not Affiliated5390.02–0.050Steady2.svg
 Total3,168,899  37
Two-party-preferred vote
  Australian Labor Party 54.27+5.2721Increase2.svg 2
  Liberal/National coalition  45.73–5.2716Decrease2.svg 2

Liberal to Labor: Corangamite, Deakin

Results by division

Aston

2007 Australian federal election: Aston
PartyCandidateVotes%±%
Liberal Chris Pearce 43,51950.71−7.84
Labor Gerry Raleigh33,33238.84+7.67
Greens Adam Pepper4,4925.23+0.37
Family First Peter Lake2,9783.47+0.66
Democrats Rachal Aza1,2461.45+0.22
CEC Doug Mitchell2450.29−0.39
Total formal votes85,81297.06+1.26
Informal votes2,6012.94−1.26
Turnout 88,41396.35+0.34
Two-party-preferred result
Liberal Chris Pearce 47,24355.05−8.10
Labor Gerry Raleigh38,56944.95+8.10
Liberal hold Swing −8.10

Ballarat

2007 Australian federal election: Ballarat
PartyCandidateVotes%±%
Labor Catherine King 44,19150.33+5.33
Liberal Samantha McIntosh33,40238.04−6.53
Greens Belinda Coates7,0087.98+1.25
Family First Dale Butterfield3,2073.65+1.50
Total formal votes87,80897.59+0.93
Informal votes2,1702.41−0.93
Turnout 89,97896.11+0.15
Two-party-preferred result
Labor Catherine King 51,05658.15+5.92
Liberal Samantha McIntosh36,75241.85−5.92
Labor hold Swing +5.92

Batman

2007 Australian federal election: Batman
PartyCandidateVotes%±%
Labor Martin Ferguson 45,55157.18+1.65
Liberal Jonathan Peart16,43920.64−5.31
Greens Patricia Carey13,67417.17+3.24
Family First Peter Kerin2,0902.62+1.49
Democrats Darren Hassan1,6192.03+0.57
CEC Robert Barwick2880.36+0.13
Total formal votes79,66196.18+2.02
Informal votes3,1673.82−2.02
Turnout 82,82894.07+0.50
Two-party-preferred result
Labor Martin Ferguson 60,50375.95+4.63
Liberal Jonathan Peart19,15824.05−4.63
Labor hold Swing −3.75

Bendigo

2007 Australian federal election: Bendigo
PartyCandidateVotes%±%
Labor Steve Gibbons 42,41047.14+3.61
Liberal Peter Kennedy34,56238.42−7.02
Greens Toby Byrne6,5217.25+0.32
Family First Terry Jarvis3,1903.55−0.12
Independent Eril Rathjen1,8652.07+2.07
Democrats Edward Guymer5770.64+0.64
Independent Adam Veitch3310.37+0.37
Independent Peter Consandine3040.34+0.34
Liberty & Democracy Clinton Gale2100.23+0.23
Total formal votes89,97096.46−0.67
Informal votes3,3053.54+0.67
Turnout 93,27595.96−0.24
Two-party-preferred result
Labor Steve Gibbons 50,50456.13+5.17
Liberal Peter Kennedy39,46643.87−5.17
Labor hold Swing +5.17

Bruce

2007 Australian federal election: Bruce
PartyCandidateVotes%±%
Labor Alan Griffin 41,75451.85+4.55
Liberal Angela Randall30,25737.57−5.52
Greens Rob Cassidy4,1025.09−0.15
Family First Bronwyn Rawlins2,2952.85+0.22
Democrats Richard Grossi1,0121.26−0.12
Christian Democrats Sandra Herrmann6780.84+0.84
One Nation Neil Smith4330.54+0.54
Total formal votes80,53196.29+0.72
Informal votes3,1063.71−0.72
Turnout 83,63794.62+0.27
Two-party-preferred result
Labor Alan Griffin 46,96658.32+4.84
Liberal Angela Randall33,56541.68−4.84
Labor hold Swing +4.84

Calwell

2007 Australian federal election: Calwell
PartyCandidateVotes%±%
Labor Maria Vamvakinou 51,95260.22+10.21
Liberal Dianne Livett22,90626.55−10.62
Greens Brook Shaune3,7614.36−0.90
Family First Arthur Buller3,7474.34+1.98
CEC Sleiman Yohanna1,8172.11−0.09
Democrats Vanessa Musolino7990.93−0.56
Independent Philip Cutler6240.72+0.72
Independent Don Hampshire3910.45+0.45
Socialist Equality Frank Gaglioti2730.32+0.32
Total formal votes86,27095.15+0.39
Informal votes4,3994.85−0.39
Turnout 90,66994.82−0.53
Two-party-preferred result
Labor Maria Vamvakinou 59,80769.33+11.14
Liberal Dianne Livett26,46330.67−11.14
Labor hold Swing +11.14

Casey

2007 Australian federal election: Casey
PartyCandidateVotes%±%
Liberal Tony Smith 41,89750.15−6.12
Labor Dympna Beard 29,94935.85+6.17
Greens Salore Craig6,1127.32−0.55
Family First Daniel Harrison3,5014.19+0.14
Democrats Tony Inglese1,5461.85+0.60
Christian Democrats George Moran5330.64+0.64
Total formal votes83,53897.22+1.07
Informal votes2,3892.78−1.07
Turnout 85,92796.21+0.44
Two-party-preferred result
Liberal Tony Smith 46,72655.93−5.42
Labor Dympna Beard 36,81244.07+5.42
Liberal hold Swing −5.42

Chisholm

2007 Australian federal election: Chisholm
PartyCandidateVotes%±%
Labor Anna Burke 38,43948.12+4.13
Liberal Myles King31,51439.45−4.16
Greens Alistair McCaskill6,7658.47+1.13
Family First Gary Ong1,9532.45+0.56
Democrats Daniel Berk1,0531.32−0.69
CEC Lars Thystrup1500.19+0.01
Total formal votes79,87497.39+0.74
Informal votes2,1392.61−0.74
Turnout 82,01395.22+0.38
Two-party-preferred result
Labor Anna Burke 45,83357.38+4.73
Liberal Myles King34,04142.62−4.73
Labor hold Swing +4.73

Corangamite

2007 Australian federal election: Corangamite
PartyCandidateVotes%±%
Liberal Stewart McArthur 40,40844.70−7.35
Labor Darren Cheeseman 37,88641.91+5.16
Greens Fiona Nelson7,2027.97+0.46
Family First Jan Edwards3,2173.56+0.82
Democrats Gabrielle Killeen1,5121.67+1.67
Liberty & Democracy Sukrit Sabhlok1690.19+0.19
Total formal votes90,39497.47+0.51
Informal votes2,3472.53−0.51
Turnout 92,74196.45+0.39
Two-party-preferred result
Labor Darren Cheeseman 45,96850.85+6.17
Liberal Stewart McArthur 44,42649.15−6.17
Labor gain from Liberal Swing +6.17

Corio

2007 Australian federal election: Corio [3]
PartyCandidateVotes%±%
Labor Richard Marles 37,77845.49−1.19
Liberal Angelo Kakouros24,59129.61−10.68
Independent Gavan O'Connor 10,53012.68+12.68
Greens Rob Leach4,9105.91+0.00
Family First Gordon Alderson3,2913.96+1.37
Liberty & Democracy Darrin Welden7910.95+0.95
Democrats Erica Menheere-Thompson6280.76+0.76
Socialist Alliance Chris Johnson3320.40−0.23
CEC Ross Russell1900.23−0.08
Total formal votes83,04196.27+0.65
Informal votes3,2133.73−0.65
Turnout 86,25495.36+0.33
Two-party-preferred result
Labor Richard Marles 48,93958.93+3.29
Liberal Angelo Kakouros34,10241.07−3.29
Labor hold Swing +3.29

Deakin

2007 Australian federal election: Deakin
PartyCandidateVotes%±%
Liberal Phil Barresi 36,50144.35-6.24
Labor Mike Symon 34,45141.86+5.71
Greens Bill Pemberton6,9788.48+0.62
Family First Fiona Bronte2,5893.15+0.81
Democrats Paul Nicholson1,2051.46-0.51
Liberty & Democracy Nick Stevenson5860.71+0.71
Total formal votes82,31097.91+0.97
Informal votes1,7562.09-0.97
Turnout 84,06695.84+0.41
Two-party-preferred result
Labor Mike Symon 42,31951.41+6.38
Liberal Phil Barresi 39,99148.59-6.38
Labor gain from Liberal Swing +6.38

Dunkley

2007 Australian federal election: Dunkley
PartyCandidateVotes%±%
Liberal Bruce Billson 43,02449.79−5.75
Labor Graham McBride33,05538.26+4.69
Greens Neale Adams6,6957.75+1.51
Family First Steven Ashdown2,2352.59+0.24
Democrats Karen Bailey1,3951.61+0.39
Total formal votes86,40497.38+1.29
Informal votes2,3282.62−1.29
Turnout 88,73295.24+0.16
Two-party-preferred result
Liberal Bruce Billson 46,69354.04−5.34
Labor Graham McBride39,71145.96+5.34
Liberal hold Swing −5.34

Flinders

2007 Australian federal election: Flinders
PartyCandidateVotes%±%
Liberal Greg Hunt 48,34354.47-3.70
Labor Gary March30,07333.88+2.99
Greens Bob Brown7,5298.48+2.21
Family First Cameron Eastman1,9882.24+0.51
Democrats David Batten8220.93+0.07
Total formal votes88,75597.22+1.56
Informal votes2,5382.78-1.56
Turnout 91,29395.49+0.19
Two-party-preferred result
Liberal Greg Hunt 51,69758.25-2.86
Labor Gary March37,05841.75+2.86
Liberal hold Swing -2.86

Gellibrand

2007 Australian federal election: Gellibrand
PartyCandidateVotes%±%
Labor Nicola Roxon 50,68160.22+5.60
Liberal Wayne Tseng19,22022.84−8.73
Greens Robert Gibson7,8989.38+0.30
Independent Dave O'Neil 1,9502.32+2.32
Family First Mukesh Garg1,7002.02+0.18
Socialist Alliance Ben Courtice1,3341.59+0.95
Democrats Rachel Richards1,0881.29−0.01
CEC Rodney Doel2850.34+0.15
Total formal votes84,15695.78+2.35
Informal votes3,7124.22−2.35
Turnout 87,86894.20+0.80
Two-party-preferred result
Labor Nicola Roxon 60,13471.46+6.51
Liberal Wayne Tseng24,02228.54−6.51
Labor hold Swing +6.51

Gippsland

2007 Australian federal election: Gippsland
PartyCandidateVotes%±%
National Peter McGauran 42,63248.37-0.36
Labor Jane Rowe32,21436.55+2.46
Greens Jeff Wrathall4,8815.54+1.16
Family First Michael Rowell3,8024.31+1.49
Independent Ben Buckley2,7873.16+3.16
What Women Want Helen McAdam1,8252.07+2.07
Total formal votes88,14197.02+1.25
Informal votes2,7102.98-1.25
Turnout 90,85195.75+0.12
Two-party-preferred result
National Peter McGauran 49,28055.91-1.79
Labor Jane Rowe38,86144.09+1.79
National hold Swing -1.79

Goldstein

2007 Australian federal election: Goldstein
PartyCandidateVotes%±%
Liberal Andrew Robb 45,14152.92−3.06
Labor Julia Mason28,73433.69+3.23
Greens Neil Pilling8,84610.37+1.51
Democrats Michael Bailey1,4221.67+0.44
Family First Joyce Khoo9701.14−0.19
CEC Colin Horne1860.22+0.01
Total formal votes85,29997.58+0.98
Informal votes2,1122.42−0.98
Turnout 87,41195.00+0.40
Two-party-preferred result
Liberal Andrew Robb 47,81156.05−3.98
Labor Julia Mason37,48843.95+3.98
Liberal hold Swing −3.98

Gorton

2007 Australian federal election: Gorton
PartyCandidateVotes%±%
Labor Brendan O'Connor 58,73261.93+2.56
Liberal Susan Jennison23,06324.32−8.10
Greens Huong Truong 5,7756.09+0.99
Family First Scott Amberley3,7463.95+1.46
Democratic Labor Vern Hughes 3,5163.71+3.71
Total formal votes94,83295.56+0.62
Informal votes4,4054.44−0.62
Turnout 99,23795.00+0.96
Two-party-preferred result
Labor Brendan O'Connor 67,53571.22+6.32
Liberal Susan Jennison27,29728.78−6.32
Labor hold Swing +6.32

Higgins

2007 Australian federal election: Higgins
PartyCandidateVotes%±%
Liberal Peter Costello 43,76153.61−1.69
Labor Barbara Norman25,36731.08+0.58
Greens Michael Wilbur-Ham8,77710.75−0.60
Independent Stephen Mayne 1,6151.98+1.98
Democrats Mary Dettman9901.21−0.61
Family First Penny Badwal6270.77−0.06
Independent Genevieve Maria Forde2650.32+0.32
Independent Graeme Meddings2270.28+0.28
Total formal votes81,62997.43+0.19
Informal votes2,1502.57−0.19
Turnout 83,77993.78+0.81
Two-party-preferred result
Liberal Peter Costello 46,55957.04−1.72
Labor Barbara Norman35,07042.96+1.72
Liberal hold Swing −1.72

Holt

2007 Australian federal election: Holt
PartyCandidateVotes%±%
Labor Anthony Byrne 51,68955.65+9.98
Liberal Emanuele Cicchiello31,78534.22-8.63
Family First Yasmin de Zilwa4,0764.39+0.22
Greens Lynette Keleher3,8234.12-0.34
Democrats Ken Seymour1,1551.24-0.18
CEC Chris Morgan3470.37-1.06
Total formal votes92,87596.44+0.79
Informal votes3,4303.56-0.79
Turnout 96,30595.46+0.41
Two-party-preferred result
Labor Anthony Byrne 57,23761.63+10.12
Liberal Emanuele Cicchiello35,63838.37-10.12
Labor hold Swing +10.12

Hotham

2007 Australian federal election: Hotham
PartyCandidateVotes%±%
Labor Simon Crean 44,85355.15+3.93
Liberal Vince Arborea27,45133.75−5.22
Greens Matthew Billman5,5726.85+1.46
Family First Peter Dorian1,6572.04−0.53
Democrats Craig Cadby8000.98−0.25
Democratic Labor Terry Farrell7580.93+0.93
CEC Mike Woodward2400.30+0.02
Total formal votes81,33196.70+0.94
Informal votes2,7723.30−0.94
Turnout 84,10394.85+0.30
Two-party-preferred result
Labor Simon Crean 51,24063.00+5.60
Liberal Vince Arborea30,09137.00−5.60
Labor hold Swing +5.60

Indi

2007 Australian federal election: Indi
PartyCandidateVotes%±%
Liberal Sophie Mirabella 46,05254.38−8.25
Labor Zuvele Leschen27,20332.12+5.89
Greens Helen Robinson6,4167.58+1.15
Family First Jim Rainey3,2323.82−0.22
Democrats Sarah Benson1,4341.69+1.69
CEC Jeremy Beck3540.42−0.25
Total formal votes84,69197.32+0.20
Informal votes2,3322.68−0.20
Turnout 87,02395.77+0.40
Two-party-preferred result
Liberal Sophie Mirabella 50,13259.19−7.10
Labor Zuvele Leschen34,55940.81+7.10
Liberal hold Swing −7.10

Isaacs

2007 Australian federal election: Isaacs
PartyCandidateVotes%±%
Labor Mark Dreyfus 44,05648.76+4.45
Liberal Ross Fox34,76238.47−4.82
Greens Colin Long5,6366.24−1.07
Family First Jadah Pleiter2,3082.55+0.15
Democrats Laura Chipp1,9702.18+1.15
Independent Gordon Ford1,1371.26+0.49
Liberty & Democracy Robert Norrie4920.54+0.54
Total formal votes90,36196.69+1.73
Informal votes3,0923.31−1.73
Turnout 93,45395.18−0.07
Two-party-preferred result
Labor Mark Dreyfus 52,13157.69+6.21
Liberal Ross Fox38,23042.31−6.21
Labor hold Swing +6.21

Jagajaga

2007 Australian federal election: Jagajaga
PartyCandidateVotes%±%
Labor Jenny Macklin 42,15448.16+3.38
Liberal Conrad D'Souza32,87037.55−4.78
Greens Lisa Hodgson8,97110.25+1.94
Family First Andrew Conlon2,0652.36+0.07
Democrats Jason Graham9791.12−0.03
CEC Stephen Lele4960.56+0.38
Total formal votes87,53597.55+1.53
Informal votes2,1962.45−1.53
Turnout 89,73195.70+0.21
Two-party-preferred result
Labor Jenny Macklin 51,63058.98+4.58
Liberal Conrad D'Souza35,90541.02−4.58
Labor hold Swing +4.58

Kooyong

2007 Australian federal election: Kooyong
PartyCandidateVotes%±%
Liberal Petro Georgiou 45,17255.14+0.48
Labor Ken Harvey24,59930.03+1.02
Greens Peter Campbell9,68611.82−0.72
Family First John Laidler1,2611.54+0.16
Democrats David Collyer1,0561.29−0.56
CEC Pierre Curtis1540.19−0.37
Total formal votes81,92897.90+0.80
Informal votes1,7562.10−0.80
Turnout 83,68494.75+0.49
Two-party-preferred result
Liberal Petro Georgiou 48,77559.53−0.05
Labor Ken Harvey33,15340.47+0.05
Liberal hold Swing −0.05

La Trobe

2007 Australian federal election: La Trobe
PartyCandidateVotes%±%
Liberal Jason Wood 39,63646.48−4.74
Labor Rodney Cocks34,44840.39+6.62
Greens Bree Taylor7,5398.84−0.57
Family First Jim Zubic2,4232.84+0.49
Democrats Craig Beale1,0121.19−0.30
CEC Kurt Beilharz1400.16−0.01
Liberty & Democracy Surome Singh850.10+0.10
Total formal votes85,28396.72+0.74
Informal votes2,8963.28−0.74
Turnout 88,17995.82+0.36
Two-party-preferred result
Liberal Jason Wood 43,07750.51−5.32
Labor Rodney Cocks42,20649.49+5.32
Liberal hold Swing −5.32

Lalor

2007 Australian federal election: Lalor
PartyCandidateVotes%±%
Labor Julia Gillard 57,20859.89+6.64
Liberal Peter Curtis28,43529.77−7.68
Family First Steve Gleeson4,1994.40+1.22
Greens Jay Tilley3,8364.02−0.10
Democratic Labor Libby Krepp9691.01+1.01
Democrats Roger Howe8790.92−0.52
Total formal votes95,52696.51+1.36
Informal votes3,4573.49−1.36
Turnout 98,98395.40−0.04
Two-party-preferred result
Labor Julia Gillard 62,60065.53+6.74
Liberal Peter Curtis32,93634.47−6.74
Labor hold Swing +6.74

Mallee

2007 Australian federal election: Mallee
PartyCandidateVotes%±%
National John Forrest 53,22763.94−4.48
Labor John Zigouras18,18721.85+1.54
Family First Glenn Coulthard5,4356.53+2.01
Greens Liam Farrelly3,4684.17+0.39
Democrats Vikki McLeod2,3232.79+1.24
CEC Chris Lahy6000.72−0.71
Total formal votes83,24096.41−0.10
Informal votes3,1013.59+0.10
Turnout 86,34195.82+0.00
Two-party-preferred result
National John Forrest 59,32871.27−3.48
Labor John Zigouras23,91228.73+3.48
National hold Swing −3.48

Maribyrnong

2007 Australian federal election: Maribyrnong
PartyCandidateVotes%±%
Labor Bill Shorten 45,52857.57+6.24
Liberal Ian Soylemez23,74130.02-7.48
Greens Bob Muntz5,3966.82-0.04
Family First Ian Keeling2,0392.58+0.73
Democrats Robert Livesay1,2421.57-0.05
CEC Andre Kozlowski1,1411.44+0.60
Total formal votes79,08796.02+0.88
Informal votes3,2773.98-0.88
Turnout 82,36494.15+0.11
Two-party-preferred result
Labor Bill Shorten 51,65765.32+5.85
Liberal Ian Soylemez27,43034.68-5.85
Labor hold Swing +5.85

McEwen

2007 Australian federal election: McEwen [4] [lower-alpha 1]
PartyCandidateVotes%±%
Liberal Fran Bailey 44,16545.76-5.98
Labor Rob Mitchell 38,81940.22+5.67
Greens Steve Meacher8,3798.68+1.03
Family First Ian Cranson2,3982.48+0.76
Democrats David Kane9480.98+0.16
Independent Darren Trueman8490.88+0.88
Liberty & Democracy Robert Newnham7990.83+0.83
CEC Rod McLennan1610.17-0.05
Total formal votes96,51895.91+0.57
Informal votes3,9824.09-0.57
Turnout 100,63496.29+0.18
Two-party-preferred result
Liberal Fran Bailey 48,33950.01-6.41
Labor Rob Mitchell 48,30849.99+6.41
Liberal hold Swing -6.41
Rob Mitchell (Labor) was initially been announced as the winning candidate, by a mere seven votes. The first recount reduced this margin to five. The second re-count overturned the result with Fran Bailey (Liberal) instead winning by 12 votes. [6] The Court of Disputed Returns later increased this margin to 27 votes. [5] [7] [8]

McMillan

2007 Australian federal election: McMillan [3]
PartyCandidateVotes%±%
Liberal Russell Broadbent 40,25449.93+7.00
Labor Christine Maxfield30,74338.14+0.28
Greens Sandra Betts4,8396.00+1.52
Family First Terry Aeschlimann2,3702.94+1.23
Democrats Don Walters1,2061.50+0.65
Democratic Labor Suryan Chandrasegaran7750.96+0.61
CEC Theo Alblas2870.36+0.19
Liberty & Democracy Ben Fiechtner1410.17+0.17
Total formal votes80,61596.57+1.06
Informal votes2,8593.43-1.06
Turnout 83,47495.85-0.04
Two-party-preferred result
Liberal Russell Broadbent 44,17254.79-0.20
Labor Christine Maxfield36,44345.21+0.20
Liberal hold Swing -0.20

Melbourne

2007 Australian federal election: Melbourne
PartyCandidateVotes%±%
Labor Lindsay Tanner 43,36349.51-2.27
Liberal Andrea Del Ciotto20,57723.49-1.60
Greens Adam Bandt 19,96722.80+3.82
Democrats Tim Wright1,2551.43-0.20
Family First Georgia Pearson8781.00+0.12
CEC Andrew Reed5860.67+0.49
Kylie McGregor5390.62+0.62
Socialist Equality Will Marshall4180.48+0.48
Total formal votes87,58397.20+0.47
Informal votes2,5212.80-0.47
Turnout 90,10491.52+0.45
Two-party-preferred result
Labor Lindsay Tanner 63,29972.27+1.13
Liberal Andrea Del Ciotto24,28427.73−1.13
Two-candidate-preferred result
Labor Lindsay Tanner 47,91654.71−16.43
Greens Adam Bandt 39,66745.29+45.29
Labor hold Swing -16.43

Melbourne Ports

2007 Australian federal election: Melbourne Ports
PartyCandidateVotes%±%
Labor Michael Danby 36,55642.47+3.22
Liberal Adam Held34,15439.68-3.26
Greens Phillip Walker12,94115.03+0.93
Democrats John Mathieson1,5271.77+0.42
Family First Rebecca Gebbing7310.85+0.31
CEC Aaron Isherwood1720.20+0.02
Total formal votes86,08197.84+1.24
Informal votes1,9032.16-1.24
Turnout 87,98491.71+0.58
Two-party-preferred result
Labor Michael Danby 49,19157.15+3.41
Liberal Adam Held36,89042.85-3.41
Labor hold Swing +3.41

Menzies

2007 Australian federal election: Menzies
PartyCandidateVotes%±%
Liberal Kevin Andrews 43,39351.60-5.19
Labor Andrew Campbell29,24934.78+1.99
Greens David Ellis5,2916.29-0.17
Independent Philip Nitschke 3,2973.92+3.92
Family First Ken Smithies2,0362.42+0.28
Democrats Damian Wise8220.98-0.53
Total formal votes84,08897.24+0.85
Informal votes2,3852.76-0.85
Turnout 86,47396.12+0.68
Two-party-preferred result
Liberal Kevin Andrews 47,10456.02-4.65
Labor Andrew Campbell36,98443.98+4.65
Liberal hold Swing -4.65

Murray

2007 Australian federal election: Murray
PartyCandidateVotes%±%
Liberal Sharman Stone 50,02162.07-3.46
Labor Bob Scates19,42924.11+4.34
Independent Rob Bryant4,3735.43-2.32
Family First Serena Moore2,6743.32+0.94
Greens Ian Christoe2,3772.95-0.10
Independent Diane Teasdale6150.76-0.59
Independent Paul Merrigan4840.60+0.60
Democrats Sarina Isgro4160.52+0.52
CEC Jeff Davy2030.25+0.08
Total formal votes80,59294.76-1.06
Informal votes4,4615.24+1.06
Turnout 85,05395.68-0.09
Two-party-preferred result
Liberal Sharman Stone 55,01568.26-5.82
Labor Bob Scates25,57731.74+5.82
Liberal hold Swing -5.82

Scullin

2007 Australian federal election: Scullin
PartyCandidateVotes%±%
Labor Harry Jenkins 51,68063.32+4.30
Liberal Charles Williams19,91024.39-6.52
Greens Linda Laos4,9186.03+1.00
Family First Tania Byers3,8594.73+1.34
Democrats Peter Hude8681.06+1.06
CEC Simon Steer3860.47-1.17
Total formal votes81,62195.94+0.69
Informal votes3,4524.06-0.69
Turnout 85,07395.67+0.10
Two-party-preferred result
Labor Harry Jenkins 57,83070.85+6.06
Liberal Charles Williams23,79129.15-6.06
Labor hold Swing +6.06

Wannon

2007 Australian federal election: Wannon
PartyCandidateVotes%±%
Liberal David Hawker 44,83452.56-5.27
Labor Antony Moore30,85236.17+4.32
Greens Lisa Owen5,9536.98+2.63
Family First Daniel Pech3,6634.29+1.31
Total formal votes85,30297.41+0.79
Informal votes2,2662.59-0.79
Turnout 87,56896.33+0.38
Two-party-preferred result
Liberal David Hawker 49,02057.47-4.90
Labor Antony Moore36,28242.53+4.90
Liberal hold Swing -4.90

Wills

2007 Australian federal election: Wills
PartyCandidateVotes%±%
Labor Kelvin Thomson 49,05056.89+3.07
Liberal Claude Tomisich21,16624.55-4.15
Greens David Collis11,91213.82+0.82
Democrats Edward Clarke2,0052.33+0.91
Family First Ihab Kelada1,2331.43-0.12
Socialist Alliance Zane Alcorn6240.72-0.34
CEC Craig Isherwood2270.26-0.19
Total formal votes86,21795.67+1.17
Informal votes3,9024.33-1.17
Turnout 90,11993.69+0.70
Two-party-preferred result
Labor Kelvin Thomson 62,43272.41+5.51
Liberal Claude Tomisich23,78527.59-5.51
Labor hold Swing -3.67

See also

Notes

  1. The AEC results have been used, however they do not correspond with the tally set out in paragraph 84 of the reasons for judgment of the Court of Disputed Returns in Mitchell v Bailey (No.2) [2008] FCA 692. [4] [5]

Related Research Articles

Fran Bailey Australian politician

Frances Esther Bailey is a former Australian politician. She is a member of the Liberal Party and served in the House of Representatives from 1990 to 1993 and 1996 to 2010, representing the Division of McEwen in Victoria. She held ministerial office in the Howard Government as Minister for Employment Services (2004) and Small Business and Tourism (2004–2007).

Division of Higgins Australian federal electoral division

The Division of Higgins is an Australian Electoral Division in Victoria for the Australian House of Representatives. The division covers 41 km2 (16 sq mi) in Melbourne's south-eastern suburbs. The main suburbs include Armadale, Ashburton, Carnegie, Glen Iris, Kooyong, Malvern, Malvern East, Murrumbeena, Prahran and Toorak; along with parts of Camberwell, Ormond and South Yarra. Though historically a safe conservative seat, Higgins was won by the Liberal Party by a margin of just 3.9 percent over the Labor Party at the 2019 election, the closest result in the seat’s history. It then flipped to Labor in the 2022 election.

Division of Bennelong Australian federal electoral division

The Division of Bennelong is an Australian electoral division in the state of New South Wales. The division was created in 1949 and is named after Woollarawarre Bennelong, an Aboriginal man befriended by the first Governor of New South Wales, Arthur Phillip. The seat is represented by Jerome Laxale since the 2022 Australian federal election

Division of Bowman Australian federal electoral division

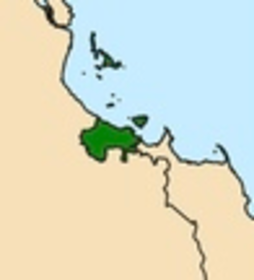
The Division of Bowman is an Australian Electoral Division in Queensland.

Division of Herbert Australian federal electoral division

The Division of Herbert is an Australian electoral division in the state of Queensland. Eligible voters within the Division elect a single representative, known as the member for Herbert, to the Australian House of Representatives.

Division of Greenway Australian federal electoral division

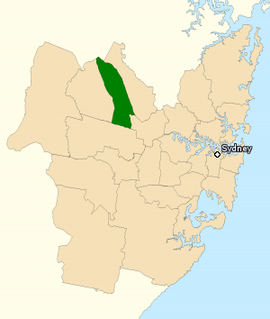
The Division of Greenway is an Australian electoral division in the state of New South Wales.

Division of Wills Australian federal electoral division

The Division of Wills is an Australian electoral division of Victoria. It is currently represented by Peter Khalil of the Australian Labor Party.

Division of Indi Australian federal electoral division

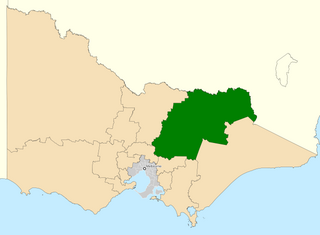
The Division of Indi is an Australian electoral division in the state of Victoria. The division is located in the north-east of the state, adjoining the border with New South Wales. The largest settlements in the division are the regional cities of Wodonga, Wangaratta, and Benalla. Other towns in the electorate include Rutherglen, Mansfield, Beechworth, Myrtleford, Bright, Alexandra, Tallangatta, Corryong and a number of other small villages. While Indi is one of the largest electorates in Victoria, much of it is located within the largely uninhabited Australian Alps. While Wodonga serves as a regional hub for much of the more heavily populated northern part of the electorate, the southern part is closer to Melbourne than Wodonga.

Division of Kooyong Australian federal electoral division

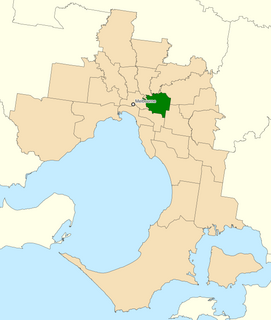
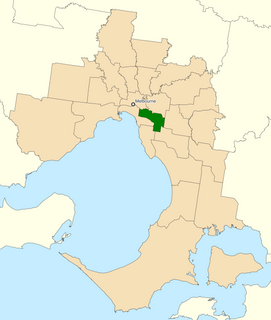
The Division of Kooyong is an Australian Electoral Division for the Australian House of Representatives in the state of Victoria, which covers an area of approximately 59 km2 (23 sq mi) in the inner-east suburbs of Melbourne. It is currently based on Kew, and also includes Balwyn, Canterbury, Deepdene, Hawthorn, Mont Albert and Mont Albert North; and parts of Camberwell, Glen Iris, Hawthorn East and Surrey Hills.

Division of McEwen Australian federal electoral division

The Division of McEwen is an Australian Electoral Division in the state of Victoria. Classed as a rural seat, the electorate is located in the centre of the state, north of its capital city Melbourne. It includes the outer northern suburbs of Doreen, Mernda, and Wollert, and extends along the Hume Freeway north of the metropolitan area to include the towns of Gisborne as well as Wallan as well as many other small towns.

Division of Mitchell Australian federal electoral division

The Division of Mitchell is an Australian electoral division in the state of New South Wales.

Court of Disputed Returns (Australia) Special electoral jurisdiction of the High Court of Australia

The Court of Disputed Returns in Australia is a special jurisdiction of the High Court of Australia. The High Court, sitting as the Court of Disputed Returns, hears challenges regarding the validity of federal elections. The jurisdiction is twofold: (1) on a petition to the Court by an individual with a relevant interest or by the Australian Electoral Commission, or (2) on a reference by either house of the Commonwealth Parliament. This jurisdiction was initially established by Part XVI of the Commonwealth Electoral Act 1902 and is now contained in Part XXII of the Commonwealth Electoral Act 1918. Challenges regarding the validity of State elections are heard by the Supreme Court of that State as the State's Court of Disputed Returns.

Court of Disputed Returns (Queensland)

The Queensland Court of Disputed Returns is a court that adjudicates disputes concerning Queensland Government and local government elections and state referendums in Queensland, Australia. The Court is a division of the Supreme Court of Queensland.

Rob Mitchell (Victorian politician) Australian politician

Robert George Mitchell is an Australian politician. He has been an Australian Labor Party member of the Australian House of Representatives since August 2010, representing the electorate of McEwen. Previously a member of the Victorian Legislative Council from 2002 to 2006, he currently serves in the position of second deputy speaker.

McEwan, an Australian Electoral Division in the Australian state of Victoria, has existed since 1984.

2013 Australian federal election Election for the 44th Parliament of Australia

The 2013 Australian federal election to elect the members of the 44th Parliament of Australia took place on 7 September 2013. The centre-right Liberal/National Coalition opposition led by Opposition leader Tony Abbott of the Liberal Party of Australia and Coalition partner the National Party of Australia, led by Warren Truss, defeated the incumbent centre-left Labor Party government of Prime Minister Kevin Rudd by an 18-seat 3.6 percentage point two-party swing resulting in a landslide win for the Coalition. Labor had been in government for six years since first being elected in the 2007 election. This election marked the end of the Rudd-Gillard-Rudd Labor government and the start of the 9 year long Abbott-Turnbull-Morrison Liberal-National Coalition government. Abbott was sworn in by the Governor-General, Quentin Bryce, as Australia's new Prime Minister on 18 September 2013, along with the Abbott Ministry. The 44th Parliament of Australia opened on 12 November 2013, with the members of the House of Representatives and territory senators sworn in. The state senators were sworn in by the next Governor-General Peter Cosgrove on 7 July 2014, with their six-year terms commencing on 1 July.

Results of the 2013 Australian federal election (Senate) Australian federal election results

The following tables show state-by-state results in the Australian Senate at the 2013 Australian federal election.

On 5 April 2014, an Australian Senate special election in Western Australia was held. The special election was held six months after the 2013 Australian federal election. The result of that 2013 election for the Australian Senate in Western Australia was voided on 20 February 2014 by the High Court of Australia, sitting as the Court of Disputed Returns, because 1,375 ballot papers were lost during an official recount in November 2013. The High Court ruled that because the number of lost ballots exceeded the margin for the two remaining Senate seats, the only acceptable remedy was to void the results and hold a special election.

Results of the 2016 Australian federal election (Senate) Australian federal election results

The 2016 Australian federal election in the Senate was part of a double dissolution election held on Saturday 2 July to elect all 226 members of the 45th Parliament of Australia, after an extended eight-week official campaign period. It was the first double dissolution election since the 1987 election and the first under a new voting system for the Senate that replaced group voting tickets with optional preferential voting.

Results of the 2004 Australian federal election in Victoria

This is a list of electoral division results for the Australian 2004 federal election in the state of Victoria.

References

  1. 1 2 "2007 First preference votes for Victoria". Australian Electoral Commission. Retrieved 24 May 2022.
  2. "2007 Victorian division results". Australian Electoral Commission. Retrieved 24 May 2022.
  3. 1 2 3 "2007 House of Representatives: Victoria". Psephos Adam Carr's Election Archive. Retrieved 4 June 2022.
  4. 1 2 "McEwen, VIC". Virtual Tally Room 2007. Australian Electoral Commission . Retrieved 11 November 2021.
  5. 1 2 Mitchell v Bailey [2008] FCA 692, (2008) 169 FCR 529, Federal Court (sitting as the Court of Disputed Returns).
  6. "Recount of 643 disputed votes in McEwen completed". Media Release. Australian Electoral Commission. Archived from the original on 21 December 2007.
  7. Pirani, Paul, Elections and Administrative Law (2012) 68 Australian Institute of Administrative Law Forum 19.
  8. Joint Standing Committee on Electoral Matters (23 June 2009). "8 Informality issues including 'saving' informal votes and the McEwen petition" (PDF). Report on the 2007 election. Parliament of Australia . Retrieved 11 November 2021.