Results of the 2010 Australian federal election in Victoria

Last updated

2010 Australian federal election
(Victoria)
Flag of Victoria (Australia).svg
  2007 21 August 2010 2013  

All 37 Victorian seats in the Australian House of Representatives
and 6 (of the 12) seats in the Australian Senate
 First partySecond partyThird party
  Julia Gillard 2010.jpg Tony Abbott - 2010.jpg Bob Brown profile.png
Leader Julia Gillard Tony Abbott Bob Brown
Party Labor Liberal/National coalition Greens
Last election21 seats16 seats1 seat
Seats won22 seats14 seats1 seat
Seat changeIncrease2.svg1Decrease2.svg2
Popular vote1,361,4161,260,729402,482
Percentage42.81%39.64%12.66%
SwingDecrease2.svg1.88%Decrease2.svg1.47%Increase2.svg 4.99%
TPP 55.31%44.69%
TPP swingIncrease2.svg 1.04Decrease2.svg 1.04

2010 federal election party vote victoria.png
2010 Federal Election Results - Victoria (Primary).png
2010 Federal Election - Victoria (TCP).png

This is a list of electoral division results for the Australian 2010 federal election in the state of Victoria. [1] [2]

Contents

Overall

Electoral divisions: Victoria Vicstate2010.gif
Electoral divisions: Victoria
Electoral divisions: Melbourne area Vicmetro2010.gif
Electoral divisions: Melbourne area
Turnout 93.46% (CV) — Informal 4.50%
PartyVotes%SwingSeatsChange
  Australian Labor Party 1,361,41642.81–1.8822Increase2.svg 1
   Liberal 1,159,30136.45–1.6412Decrease2.svg 2
  National 101,4193.19+0.172Steady2.svg
Coalition 1.159.30136.45–1.4714Decrease2.svg 2
  Australian Greens 402,48212.66+4.491Increase2.svg 1
  Family First Party 99,7473.14+0.12
  Independents 26,5250.83−0.17
  Liberal Democratic Party 7,8390.25+0.15
  Australian Sex Party 6,0230.19+0.19
  Secular Party of Australia 5,2390.16+0.16
  Australian Democrats 3,9470.12−1.10
  Socialist Alliance 2,2250.07+0.00
  Socialist Equality Party 1,6560.05+0.03
  Citizens Electoral Council 9220.03−0.24
  Christian Democratic Party 6320.02−0.02
  Australia First Party 2950.01+0.01
 Others5160.02+0.00
Total3,180,184  37
Two-party-preferred vote
  Australian Labor Party 1,758,98255.31+1.0422Increase2.svg 1
  Liberal/National Coalition 1,421,20244.69–1.0414Decrease2.svg 2
Invalid/blank votes149,6994.50+1.25
Registered voters/turnout3,561,87393.49
Source: Commonwealth Election 2010

Results by division

Aston

2010 Australian federal election: Aston [3]
PartyCandidateVotes%±%
Liberal Alan Tudge 39,73346.85−3.86
Labor Rupert Evans32,72538.58−0.26
Greens Salore Craig8,2069.67+4.44
Family First Rachel Hanna4,1534.90+1.43
Total formal votes84,81795.65−1.41
Informal votes3,8544.35+1.41
Turnout 88,67194.89−1.50
Two-party-preferred result
Liberal Alan Tudge 43,90151.76−3.29
Labor Rupert Evans40,91648.24+3.29
Liberal hold Swing −3.29

Ballarat

2010 Australian federal election: Ballarat [4]
PartyCandidateVotes%±%
Labor Catherine King 46,28951.75+1.42
Liberal Mark Banwell30,36433.95−4.09
Greens Belinda Coates10,14011.34+3.36
Family First Jim Rainey2,6462.96−0.69
Total formal votes89,43996.28−1.31
Informal votes3,4563.72+1.31
Turnout 92,89594.98−1.11
Two-party-preferred result
Labor Catherine King 55,18861.70+3.55
Liberal Mark Banwell34,25138.30−3.55
Labor hold Swing +3.55

Batman

2010 Australian federal election: Batman [5]
PartyCandidateVotes%±%
Labor Martin Ferguson 40,57452.38−4.80
Greens Alexandra Bhathal18,18923.48+6.31
Liberal George Souris15,41219.90−0.74
Family First Andrew Conlon2,4653.18+0.56
Democrats Con Sarazen8231.06−0.97
Total formal votes77,46394.85−1.33
Informal votes4,2025.15+1.33
Turnout 81,66591.59−2.61
Two-party-preferred result
Labor Martin Ferguson 58,02874.91−1.04
Liberal George Souris19,43525.09+1.04
Two-party-preferred result
Labor Martin Ferguson 44,81957.86−18.09
Greens Alexandra Bhathal32,64442.14+42.14
Labor hold Swing −18.09

Bendigo

2010 Australian federal election: Bendigo [6]
PartyCandidateVotes%±%
Labor Steve Gibbons 43,96547.65+0.51
Liberal Craig Hunter33,06735.84−2.58
Greens Kymberlie Dimozantos11,34112.29+5.04
Family First Alan Howard3,8924.22+0.67
Total formal votes92,26596.26−0.20
Informal votes3,5883.74+0.20
Turnout 95,85395.19−0.84
Two-party-preferred result
Labor Steve Gibbons 54,92859.53+3.40
Liberal Craig Hunter37,33740.47−3.40
Labor hold Swing +3.40

Bruce

2010 Australian federal election: Bruce [7]
PartyCandidateVotes%±%
Labor Alan Griffin 37,79449.24−2.61
Liberal Mike Kabos28,58037.24−0.33
Greens Stefan Zibell7,2229.41+4.32
Family First Felicity Hemmersbach3,1514.11+1.26
Total formal votes76,74794.79−1.50
Informal votes4,2205.21+1.50
Turnout 80,96791.83−2.75
Two-party-preferred result
Labor Alan Griffin 44,60358.12−0.20
Liberal Mike Kabos32,14441.88+0.20
Labor hold Swing −0.20

Calwell

2010 Australian federal election: Calwell [8]
PartyCandidateVotes%±%
Labor Maria Vamvakinou 49,58056.63−3.59
Liberal Wayne Tseng22,55625.76−0.79
Greens Lenka Thompson10,38611.86+7.50
Family First Jeff Truscott3,8514.40+0.06
Socialist Equality Peter Byrne1,1811.35+1.03
Total formal votes87,55493.47−1.68
Informal votes6,1146.53+1.68
Turnout 93,66892.45−2.39
Two-party-preferred result
Labor Maria Vamvakinou 61,04569.72+0.39
Liberal Wayne Tseng26,50930.28−0.39
Labor hold Swing +0.39

Casey

2010 Australian federal election: Casey [9]
PartyCandidateVotes%±%
Liberal Tony Smith 40,58848.38−1.77
Labor Sami Hisheh29,56535.24−0.61
Greens Brendan Powell9,66111.52+4.20
Family First Daniel Harrison4,0834.87+0.68
Total formal votes83,89795.78−1.44
Informal votes3,6954.22+1.44
Turnout 87,59294.84−1.38
Two-party-preferred result
Liberal Tony Smith 45,45854.18−1.75
Labor Sami Hisheh38,43945.82+1.75
Liberal hold Swing −1.75

Chisholm

2010 Australian federal election: Chisholm [10]
PartyCandidateVotes%±%
Labor Anna Burke 34,49244.53−3.59
Liberal John Nguyen31,09340.15+0.70
Greens Josh Fergeus9,19611.87+3.40
Family First Phil Goodman2,1072.72+0.27
Secular Nimrod Evans5620.73+0.73
Total formal votes77,45096.41−0.98
Informal votes2,8803.59+0.98
Turnout 80,33093.11−2.16
Two-party-preferred result
Labor Anna Burke 43,45956.11−1.27
Liberal John Nguyen33,99143.89+1.27
Labor hold Swing −1.27

Corangamite

2010 Australian federal election: Corangamite [11]
PartyCandidateVotes%±%
Liberal Sarah Henderson 42,15544.99+0.29
Labor Darren Cheeseman 37,04339.53−2.38
Greens Mike Lawrence10,71311.43+3.46
Family First Ann Wojczuk1,8501.97−1.59
Independent Sally-Anne Brown1,4181.51+1.51
Liberal Democrats Nathan Timmins5200.55+0.36
Total formal votes93,69996.78−0.69
Informal votes3,1173.22+0.69
Turnout 96,81695.32−1.15
Two-party-preferred result
Labor Darren Cheeseman 47,23550.41−0.44
Liberal Sarah Henderson 46,46449.59+0.44
Labor hold Swing −0.44

Corio

2010 Australian federal election: Corio [12]
PartyCandidateVotes%±%
Labor Richard Marles 42,57851.51+6.02
Liberal Don Gibson25,72931.13+1.52
Greens Gavin Brown10,35512.53+6.62
Family First Scott Amberley3,0283.66−0.30
Socialist Alliance Sue Bull9711.17+0.77
Total formal votes82,66195.49−0.78
Informal votes3,9054.51+0.78
Turnout 86,56694.12−1.30
Two-party-preferred result
Labor Richard Marles 53,08364.22+5.29
Liberal Don Gibson29,57835.78−5.29
Labor hold Swing +5.29

Deakin

2010 Australian federal election: Deakin [13]
PartyCandidateVotes%±%
Liberal Phil Barresi 33,55341.94−2.41
Labor Mike Symon 31,94139.93−1.93
Greens David Howell10,33812.92+4.44
Family First Peter Lake2,5323.17+0.02
Independent Abraham Seviloglou8361.05+1.05
Liberal Democrats Benjamin Walsh5050.63−0.08
Australia First Alex Norwick2950.37+0.37
Total formal votes80,00096.42−1.49
Informal votes2,9673.58+1.49
Turnout 82,96794.56−1.33
Two-party-preferred result
Labor Mike Symon 41,92752.41+1.00
Liberal Phil Barresi 38,07347.59−1.00
Labor hold Swing +1.00

Dunkley

2010 Australian federal election: Dunkley [14]
PartyCandidateVotes%±%
Liberal Bruce Billson 40,60247.32−2.47
Labor Helen Constas32,88938.33+0.07
Greens Simon Tiller10,03311.69+3.94
Family First Yasmin de Zilwa2,2762.65+0.06
Total formal votes85,80096.08−1.30
Informal votes3,4983.92+1.30
Turnout 89,29893.68−1.55
Two-party-preferred result
Liberal Bruce Billson 43,77751.02−3.02
Labor Helen Constas42,02348.98+3.02
Liberal hold Swing −3.02

Flinders

2010 Australian federal election: Flinders [15]
PartyCandidateVotes%±%
Liberal Greg Hunt 49,14654.30−0.17
Labor Francis Gagliano-Ventura28,74731.76−2.12
Greens Robert Brown10,41011.50+3.02
Family First Reade Smith2,1982.43+0.19
Total formal votes90,50195.87−1.35
Informal votes3,8954.13+1.35
Turnout 94,39693.58−1.85
Two-party-preferred result
Liberal Greg Hunt 53,49959.11+0.86
Labor Francis Gagliano-Ventura37,00240.89−0.86
Liberal hold Swing +0.86

Gellibrand

2010 Australian federal election: Gellibrand [16]
PartyCandidateVotes%±%
Labor Nicola Roxon 48,97158.81−1.41
Liberal David McConnell19,07022.90+0.06
Greens Rodney Solin12,77915.35+5.97
Family First Liz Mumby1,4401.73−0.29
Socialist Alliance Ben Courtice5280.63−0.96
Socialist Equality Tania Baptist4750.57+0.57
Total formal votes83,26395.00−0.78
Informal votes4,3785.00+0.78
Turnout 87,64191.66−2.50
Two-party-preferred result
Labor Nicola Roxon 61,53173.90+2.44
Liberal David McConnell21,73226.10−2.44
Labor hold Swing +2.44

Gippsland

2010 Australian federal election: Gippsland [17]
PartyCandidateVotes%±%
National Darren Chester 47,02053.00+4.63
Labor Darren McCubbin28,00831.57−4.98
Greens Michael Bond5,8266.57+1.03
Liberal Democrats Ben Buckley4,8955.52+5.52
Family First Heath Jefferis2,9633.34−0.97
Total formal votes88,71296.21−0.81
Informal votes3,4963.79+0.81
Total votes92,208 94.53 −1.14
Two-party-preferred result
National Darren Chester 54,51361.45+5.54
Labor Darren McCubbin34,19938.55−5.54
National hold Swing +5.54

Goldstein

2010 Australian federal election: Goldstein [18]
PartyCandidateVotes%±%
Liberal Andrew Robb 44,43652.55−0.37
Labor Nick Eden25,22729.83−3.86
Greens Neil Pilling13,70816.21+5.84
Family First Anthony Forster1,1871.40+0.26
Total formal votes84,55896.87−0.71
Informal votes2,7353.13+0.71
Turnout 87,29392.92−2.04
Two-party-preferred result
Liberal Andrew Robb 47,74756.47+0.42
Labor Nick Eden36,81143.53−0.42
Liberal hold Swing +0.42

Gorton

2010 Australian federal election: Gorton [19]
PartyCandidateVotes%±%
Labor Brendan O'Connor 58,76759.98−1.95
Liberal Damon Ryder23,11623.59−0.73
Greens Steve Wilson9,94910.15+4.06
Family First Sean Major6,1536.28+2.33
Total formal votes97,98593.29−2.27
Informal votes7,0486.71+2.27
Turnout 105,03392.41−2.51
Two-party-preferred result
Labor Brendan O'Connor 70,70572.16+0.94
Liberal Damon Ryder27,28027.84−0.94
Labor hold Swing +0.94

Higgins

2010 Australian federal election: Higgins [20]
PartyCandidateVotes%±%
Liberal Kelly O'Dwyer 42,08651.74−1.87
Labor Tony Clark22,70027.91−3.17
Greens Sam Hibbins 14,55917.90+7.15
Independent David Fawcett1,2251.51+1.51
Family First Ashley Truter7770.96+0.19
Total formal votes81,34797.20−0.23
Informal votes2,3432.80+0.23
Turnout 83,69092.58−1.19
Two-party-preferred result
Liberal Kelly O'Dwyer 46,16756.75−0.29
Labor Tony Clark35,18043.25+0.29
Liberal hold Swing −0.29

Holt

2010 Australian federal election: Holt [21]
PartyCandidateVotes%±%
Labor Anthony Byrne 51,99854.42−1.23
Liberal Ricardo Balancy29,25430.62−3.60
Greens Frank di Mascolo8,7459.15+5.03
Family First Ian George4,7724.99+0.60
Secular Mark Hitchins7760.81+0.81
Total formal votes95,54594.31−2.13
Informal votes5,7645.69+2.13
Turnout 101,30993.04−2.39
Two-party-preferred result
Labor Anthony Byrne 60,41263.23+1.60
Liberal Ricardo Balancy35,13336.77−1.60
Labor hold Swing +1.60

Hotham

2010 Australian federal election: Hotham [22]
PartyCandidateVotes%±%
Labor Simon Crean 42,92054.08−1.07
Liberal Fazal Cader26,11032.90−0.85
Greens Geoff Payne8,08610.19+3.34
Family First Gary Ong1,6882.13+0.09
Secular Trent Reardon5560.70+0.70
Total formal votes79,36095.56−1.14
Informal votes3,6844.44+1.14
Turnout 83,04492.70−2.09
Two-party-preferred result
Labor Simon Crean 50,39463.50+0.50
Liberal Fazal Cader28,96636.50−0.50
Labor hold Swing +0.50

Indi

2010 Australian federal election: Indi [23]
PartyCandidateVotes%±%
Liberal Sophie Mirabella 44,55552.62−1.76
Labor Zuvele Leschen23,03427.20−4.92
Greens Jenny O'Connor8,0009.45+1.87
Independent Alan Lappin4,9455.84+5.84
Family First Robert Cavedon3,1903.77−0.05
Democrats Mark Carey9471.12−0.57
Total formal votes84,67196.09−1.23
Informal votes3,4493.91+1.23
Turnout 88,12094.80−1.00
Two-party-preferred result
Liberal Sophie Mirabella 50,75559.94+0.75
Labor Zuvele Leschen33,91640.06−0.75
Liberal hold Swing +0.75

Isaacs

2010 Australian federal election: Isaacs [24]
PartyCandidateVotes%±%
Labor Mark Dreyfus 45,13149.42+0.67
Liberal Dale McClelland31,47234.47−4.00
Greens Chris Carman9,98010.93+4.69
Family First Heather Wheatley3,3773.70+1.15
Independent Gordon Ford1,3551.48+0.22
Total formal votes91,31595.29−1.40
Informal votes4,5164.71+1.40
Turnout 95,83193.23−1.95
Two-party-preferred result
Labor Mark Dreyfus 55,72161.02+3.33
Liberal Dale McClelland35,59438.98−3.33
Labor hold Swing +3.33

Jagajaga

2010 Australian federal election: Jagajaga [25]
PartyCandidateVotes%±%
Labor Jenny Macklin 40,68247.34−0.82
Liberal Joh Bauch29,74534.61−2.94
Greens Chris Kearney12,84714.95+4.70
Family First Joe Sgarlata2,1092.45+0.09
Secular Peter Harris5600.65+0.65
Total formal votes85,94396.03−1.52
Informal votes3,5563.97+1.52
Turnout 89,49994.01−1.71
Two-party-preferred result
Labor Jenny Macklin 52,86861.52+2.54
Liberal Joh Bauch33,07538.48−2.54
Labor hold Swing +2.54

Kooyong

2010 Australian federal election: Kooyong [26]
PartyCandidateVotes%±%
Liberal Josh Frydenberg 42,72852.56−2.58
Labor Steve Hurd22,26827.39−2.64
Greens Des Benson15,01918.48+6.66
Family First John Laidler1,2721.56+0.02
Total formal votes81,28797.22−0.68
Informal votes2,3262.78+0.68
Turnout 83,61393.26−1.54
Two-party-preferred result
Liberal Josh Frydenberg 46,77957.55−1.98
Labor Steve Hurd34,50842.45+1.98
Liberal hold Swing −1.98

Lalor

2010 Australian federal election: Lalor [27]
PartyCandidateVotes%±%
Labor Julia Gillard 66,29864.25+4.36
Liberal Sheridan Ingram23,79123.06−6.71
Greens Peter Taylor7,0456.83+2.81
Family First Lori McLean2,8802.79−1.61
Secular Paul Sheehan8810.85+0.85
Independent Joanne Clarke7080.69+0.69
Independent Brian Shaw6590.64+0.64
Van Rudd 5160.50+0.50
Independent Marc Aussie-Stone4100.40+0.40
Total formal votes103,18893.76−2.75
Informal votes6,8646.24+2.75
Turnout 110,05294.04−1.38
Two-party-preferred result
Labor Julia Gillard 74,45272.15+6.62
Liberal Sheridan Ingram28,73627.85−6.62
Labor hold Swing +6.62

La Trobe

2010 Australian federal election: La Trobe [28]
PartyCandidateVotes%±%
Liberal Jason Wood 39,05343.88−2.60
Labor Laura Smyth 33,97038.17−2.22
Greens Jim Reiher10,93112.28+3.44
Sex Party Martin Leahy2,5392.85+2.85
Family First David Barrow1,9172.15−0.69
Liberal Democrats Shem Bennett5870.66+0.56
Total formal votes88,99795.93−0.79
Informal votes3,7734.07+0.79
Turnout 92,77094.70−1.14
Two-party-preferred result
Labor Laura Smyth 45,30850.91+1.42
Liberal Jason Wood 43,68949.09−1.42
Labor gain from Liberal Swing +1.42

Mallee

2010 Australian federal election: Mallee [29]
PartyCandidateVotes%±%
National John Forrest 54,39966.79+2.85
Labor Bob Scates16,19819.89−1.96
Greens Helen Healy6,4007.86+3.69
Family First Carl Carter4,4565.47−1.06
Total formal votes81,45395.77−0.64
Informal votes3,5944.23+0.64
Turnout 85,04794.66−1.23
Two-party-preferred result
National John Forrest 60,61174.41+3.14
Labor Bob Scates20,84225.59−3.14
National hold Swing +3.14

Maribyrnong

2010 Australian federal election: Maribyrnong [30]
PartyCandidateVotes%±%
Labor Bill Shorten 42,40455.38−2.19
Liberal Conrad D'Souza22,26229.07−0.95
Greens Tim Long9,07711.85+5.03
Family First Colin Moyle1,9882.60+0.02
Democrats Robert Livesay8411.10−0.47
Total formal votes76,57294.32−1.70
Informal votes4,6075.68+1.70
Turnout 81,17991.82−2.33
Two-party-preferred result
Labor Bill Shorten 51,19366.86+1.54
Liberal Conrad D'Souza25,37933.14−1.54
Labor hold Swing +1.54

McEwen

2010 Australian federal election: McEwen [31]
PartyCandidateVotes%±%
Labor Rob Mitchell 45,37443.17+2.97
Liberal Cameron Caine42,05440.01−5.76
Greens Steve Meacher12,44011.84+3.16
Family First Belinda Clarkson3,3583.19+0.70
Liberal Democrats Mark Bini1,3321.27+0.44
Secular Robert Gordon5490.52+0.52
Total formal votes105,10795.60−0.44
Informal votes4,8434.40+0.44
Turnout 109,95094.96−1.28
Two-party-preferred result
Labor Rob Mitchell 58,14455.32+5.34
Liberal Cameron Caine46,96344.68−5.34
Labor gain from Liberal Swing +5.34

McMillan

2010 Australian federal election: McMillan [32]
PartyCandidateVotes%±%
Liberal Russell Broadbent 41,87049.28−0.65
Labor Christine Maxfield30,21235.56−2.58
Greens Malcolm McKelvie8,2589.72+3.72
Family First Linden Stokes2,7763.27+0.33
Independent Leigh Gatt1,8442.17+2.17
Total formal votes84,96096.03−0.54
Informal votes3,5113.97+0.54
Turnout 88,47194.80−1.08
Two-party-preferred result
Liberal Russell Broadbent 46,22954.41−0.38
Labor Christine Maxfield38,73145.59+0.38
Liberal hold Swing −0.38

Melbourne

2010 Australian federal election: Melbourne [33]
PartyCandidateVotes%±%
Labor Cath Bowtell34,02238.09−11.42
Greens Adam Bandt 32,30836.17+13.37
Liberal Simon Olsen18,76021.00−2.49
Sex Party Joel Murray1,6331.83+1.83
Family First Georgia Pearson1,3891.55+0.55
Secular Penelope Green6130.69+0.69
Democrats David Collyer6020.67−0.76
Total formal votes89,32796.38−0.82
Informal votes3,3563.62+0.82
Turnout 92,68390.09−1.41
Notional two-party-preferred count
Labor Cath Bowtell65,47373.30+1.03
Liberal Simon Olsen23,85426.70−1.03
Two-candidate-preferred result
Greens Adam Bandt 50,05956.04+10.75
Labor Cath Bowtell39,26843.96−10.75
Greens gain from Labor Swing +10.75

Melbourne Ports

2010 Australian federal election: Melbourne Ports [34]
PartyCandidateVotes%±%
Labor Michael Danby 32,39138.19−4.28
Liberal Kevin Ekendahl32,05737.79−1.89
Greens Sue Plowright17,52820.66+5.63
Sex Party Christian Vega1,8512.18+2.18
Family First Daniel Emmerson6320.75−0.10
Secular Gregory Storer3620.43+0.43
Total formal votes84,82196.75−1.09
Informal votes2,8483.25+1.09
Turnout 87,66989.67−2.05
Two-party-preferred result
Labor Michael Danby 48,81957.56+0.41
Liberal Kevin Ekendahl36,00242.44−0.41
Labor hold Swing +0.41

Menzies

2010 Australian federal election: Menzies [35]
PartyCandidateVotes%±%
Liberal Kevin Andrews 43,93253.63+2.03
Labor Joy Banerji26,28732.09−2.69
Greens Chris Padgham8,80210.75+4.46
Family First Ken Smithies2,8923.53+1.11
Total formal votes81,91395.91−1.33
Informal votes3,4974.09+1.33
Turnout 85,41093.89−2.26
Two-party-preferred result
Liberal Kevin Andrews 48,10258.72+2.70
Labor Joy Banerji33,81141.28−2.70
Liberal hold Swing +2.70

Murray

2010 Australian federal election: Murray [36]
PartyCandidateVotes%±%
Liberal Sharman Stone 52,33764.98+2.91
Labor Hugh Mortensen18,84223.39−0.72
Greens Ian Christoe4,9066.09+3.14
Family First Serena Moore2,9583.67+0.35
Christian Democrats Ewan McDonald6320.78+0.78
Citizens Electoral Council Jeff Davy4930.61+0.36
Secular William Clarke-Hannaford3800.47+0.47
Total formal votes80,54894.17−0.59
Informal votes4,9865.83+0.59
Turnout 85,53494.81−0.91
Two-party-preferred result
Liberal Sharman Stone 56,66670.35+2.09
Labor Hugh Mortensen23,88229.65−2.09
Liberal hold Swing +2.09

Scullin

2010 Australian federal election: Scullin [37]
PartyCandidateVotes%±%
Labor Harry Jenkins 49,31062.12−1.20
Liberal Max Williams19,14224.11−0.28
Greens Gurm Sekhon6,7028.44+2.41
Family First Ian Stratov4,2265.32+0.59
Total formal votes79,38094.01−1.93
Informal votes5,0555.99+1.93
Turnout 84,43592.97−2.73
Two-party-preferred result
Labor Harry Jenkins 57,35572.25+1.40
Liberal Max Williams22,02527.75−1.40
Labor hold Swing +1.40

Wannon

2010 Australian federal election: Wannon [38]
PartyCandidateVotes%±%
Liberal Dan Tehan 38,81346.62−5.94
Labor Judith McNamara24,50229.43−6.74
Greens Lisa Owen5,0166.03−0.95
Independent James Purcell 4,6525.59+5.59
Independent Katrina Rainsford4,0664.88+4.88
Independent Ralph Leutton2,5823.10+3.10
Family First Jahzeel Concepcion1,7952.16−2.13
Independent Allan Marsh1,0801.30+1.30
Independent Robert O'Brien7450.89+0.89
Total formal votes83,25194.68−2.73
Informal votes4,6765.32+2.73
Turnout 87,92795.30−1.10
Two-party-preferred result
Liberal Dan Tehan 47,69757.29−0.18
Labor Judith McNamara35,55442.71+0.18
Liberal hold Swing −0.18

Wills

2010 Australian federal election: Wills [39]
PartyCandidateVotes%±%
Labor Kelvin Thomson 43,71851.81−5.08
Liberal Claude Tomisich20,08023.79−0.76
Greens Mark Riley17,38120.60+6.78
Family First Daniel Mumby1,3201.56+0.13
Democrats Paul Roberton7340.87−1.46
Socialist Alliance Trent Hawkins7260.86+0.14
Citizens Electoral Council Craig Isherwood4290.51+0.25
Total formal votes84,38893.98−1.69
Informal votes5,4036.02+1.69
Turnout 89,79191.07−2.60
Two-party-preferred result
Labor Kelvin Thomson 61,29772.64+0.24
Liberal Claude Tomisich23,09127.36−0.24
Labor hold Swing +0.24

See also

Related Research Articles

Fran Bailey Australian politician

Frances Esther Bailey is a former Australian politician. She is a member of the Liberal Party and served in the House of Representatives from 1990 to 1993 and 1996 to 2010, representing the Division of McEwen in Victoria. She held ministerial office in the Howard Government as Minister for Employment Services (2004) and Small Business and Tourism (2004–2007).

Division of Higgins Australian federal electoral division

The Division of Higgins is an Australian Electoral Division in Victoria for the Australian House of Representatives. The division covers 41 km2 (16 sq mi) in Melbourne's inner south-eastern suburbs. The main suburbs include Armadale, Ashburton, Carnegie, Glen Iris, Kooyong, Malvern, Malvern East, Murrumbeena, Prahran and Toorak; along with parts of Camberwell, Ormond and South Yarra. Though historically a safe conservative seat, Higgins was won by the Liberal Party by a margin of just 3.9 percent over the Labor Party at the 2019 election, the closest result in the seat’s history. It then flipped to Labor in the 2022 election.

Division of Indi Australian federal electoral division

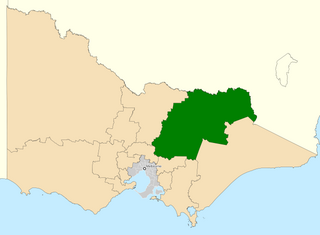
The Division of Indi is an Australian electoral division in the state of Victoria. The division is located in the north-east of the state, adjoining the border with New South Wales. The largest settlements in the division are the regional cities of Wodonga, Wangaratta, and Benalla. Other towns in the electorate include Rutherglen, Mansfield, Beechworth, Myrtleford, Bright, Alexandra, Tallangatta, Corryong and a number of other small villages. While Indi is one of the largest electorates in Victoria, much of it is located within the largely uninhabited Australian Alps. While Wodonga serves as a regional hub for much of the more heavily populated northern part of the electorate, the southern part is closer to Melbourne than Wodonga.

John Brumby Australian politician

John Mansfield Brumby is the current Chancellor of La Trobe University and former Victorian Labor Party politician who was Premier of Victoria from 2007 to 2010. He became leader of the Victorian Labor Party and premier after the resignation of Steve Bracks. He also served as the Minister for Veterans' Affairs and the Minister for Multicultural Affairs. He contested his first election as premier at the November 2010 Victorian state election. His government was defeated by the Liberal/National Coalition led by Ted Baillieu. Brumby resigned as Labor leader after the election, on 30 November, to be replaced by Daniel Andrews. Within weeks of this leadership change, Brumby left parliament, with a Broadmeadows by-election taking place on 19 February 2011.

Division of McEwen Australian federal electoral division

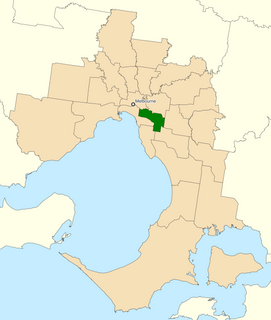
The Division of McEwen is an Australian Electoral Division in the state of Victoria. Classed as a rural seat, the electorate is located in the centre of the state, north of its capital city Melbourne. It includes the outer northern suburbs of Doreen, Mernda, and Wollert, and extends along the Hume Freeway north of the metropolitan area to include the towns of Gisborne as well as Wallan as well as many other small towns.

Australian Greens Victoria Political party in Australia

The Australian Greens Victoria, commonly known as the Victorian Greens or just as The Greens, is the Victorian state member party of the Australian Greens, a green political party in Australia.

In Australia, a redistribution is the process of redrawing the boundaries of electoral divisions for the House of Representatives arising from changes in population and changes in the number of representatives. There is no redistribution for the Senate as each State constitutes a division, though with multiple members. The Australian Electoral Commission (AEC), an independent statutory authority, oversees the apportionment and redistribution process for federal divisions, taking into account a number of factors. Politicians, political parties and the public may make submissions to the AEC on proposed new boundaries, but any interference with their deliberations is considered a serious offence.

Peter Cleeland Australian politician

Peter Robert Cleeland, Australian politician, was a Labor member of the Australian House of Representatives, representing the electorate of McEwen in Victoria between 1984 and 1990, and subsequently between 1993 and 1996.

2010 Australian federal election Election for the 43rd Parliament of Australia

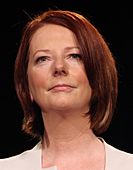
The 2010 Australian federal election was held on Saturday, 21 August 2010 to elect members of the 43rd Parliament of Australia. The incumbent centre-left Australian Labor Party led by Prime Minister Julia Gillard won a second term against the opposition centre-right Liberal Party of Australia led by Opposition Leader Tony Abbott and Coalition partner the National Party of Australia, led by Warren Truss, after Labor formed a minority government with the support of three independent MPs and one Australian Greens MP.

Rob Mitchell (Victorian politician) Australian politician

Robert George Mitchell is an Australian politician. He has been an Australian Labor Party member of the Australian House of Representatives since August 2010, representing the electorate of McEwen. Previously a member of the Victorian Legislative Council from 2002 to 2006, he currently serves in the position of second deputy speaker.

This is a list of electoral results for the Division of La Trobe in Australian federal elections from the division's creation in 1949 until the present.

McEwan, an Australian Electoral Division in the Australian state of Victoria, has existed since 1984.

This is a list of electoral results for the Division of McMillan in Australian federal elections from the division's creation in 1949 until its abolition in 2019.

The following tables show state-by-state results in the Australian House of Representatives at the 2010 federal election, Labor 72, Coalition 72, Nationals (WA) 1, Australian Greens 1, with 4 independents.

The following tables show state-by-state results in the Australian House of Representatives at the 2013 federal election, Coalition 90, Labor 55, Australian Greens 1, Palmer United Party 1, Katter's Australian Party 1, with 2 independents.

Results of the 2013 Australian federal election in Victoria

This is a list of electoral division results for the Australian 2013 federal election in the state of Victoria.

Results of the 2016 Australian federal election in Victoria

This is a list of electoral division results for the 2016 Australian federal election in the state of Victoria.

Results of the 2019 Australian federal election in Victoria

This is a list of electoral division results for the 2019 Australian federal election in the state of Victoria. Victoria bucked the national trend, seeing a swing from the Coalition to Labor, whereas the swing across Australia was from Labor to the Coalition.

Results of the 2007 Australian federal election in Victoria

This is a list of electoral division results for the Australian 2007 federal election in the state of Victoria.

Results of the 2004 Australian federal election in Victoria

This is a list of electoral division results for the Australian 2004 federal election in the state of Victoria.

References

  1. "2010 election results for Victoria by Division". AEC.
  2. "2010 first preference votes Victoria". AEC.
  3. "2010 results for Aston". AEC.
  4. "2010 results for Ballarat". AEC.
  5. "2010 results for Batman". AEC.
  6. "2010 results for Bendigo". AEC.
  7. "2010 results for Bruce". AEC.
  8. "2010 results for Calwell". AEC.
  9. "2010 results for Casey". AEC.
  10. "2010 results for Chisholm". AEC.
  11. "2010 results for Corangamite". AEC.
  12. "2010 results for Corio". AEC.
  13. "2010 results for Deakin". AEC.
  14. "2010 results for Dunkley". AEC.
  15. "2010 results for Flinders". AEC.
  16. "2010 results for Gellibrand". AEC.
  17. "2010 results for Gippsland". AEC.
  18. "2010 results for Goldstein". AEC.
  19. "2010 results for Gorton". AEC.
  20. "2010 results for Higgins". AEC.
  21. "2010 results for Holt". AEC.
  22. "2010 results for Hotham". AEC.
  23. "2010 results for Indi". AEC.
  24. "2010 results for Isaacs". AEC.
  25. "2010 results for Jagajaga". AEC.
  26. "2010 results for Kooyong". AEC.
  27. "2010 results for Lalor". AEC.
  28. "2010 results for La Trobe". AEC.
  29. "2010 results for Mallee". AEC.
  30. "2010 results for Maribyrnong". AEC.
  31. "2010 results for McEwen". AEC.
  32. "2010 results for McMillan". AEC.
  33. "2010 results for Melbourne". AEC.
  34. "2010 results for Melbourne Ports". AEC.
  35. "2010 results for Menzies". AEC.
  36. "2010 results for Murray". AEC.
  37. "2010 results for Scullin". AEC.
  38. "2010 results for Wannon". AEC.
  39. "2010 results for Wills". AEC.