The Australian Electoral Commission (AEC) is the independent federal agency in charge of organising, conducting and supervising federal Australian elections, by-elections and referendums.

The Division of Higgins is an Australian Electoral Division in Victoria for the Australian House of Representatives. The division covers 41 km2 (16 sq mi) in Melbourne's inner south-eastern suburbs. The main suburbs include Armadale, Ashburton, Carnegie, Glen Iris, Kooyong, Malvern, Malvern East, Murrumbeena, Prahran and Toorak; along with parts of Camberwell, Ormond and South Yarra. Though historically a safe conservative seat, Higgins was won by the Liberal Party by a margin of just 3.9 percent over the Labor Party at the 2019 election, the closest result in the seat’s history. It then flipped to Labor in the 2022 election.

In Australia, electoral districts for the Australian House of Representatives are called divisions or more commonly referred to as electorates or seats. There are currently 151 single-member electorates for the Australian House of Representatives.

The Australian Greens Victoria, commonly known as the Victorian Greens or just as The Greens, is the Victorian state member party of the Australian Greens, a green political party in Australia.
In Australia, a redistribution is the process of redrawing the boundaries of electoral divisions for the House of Representatives arising from changes in population and changes in the number of representatives. There is no redistribution for the Senate as each State constitutes a division, though with multiple members. The Australian Electoral Commission (AEC), an independent statutory authority, oversees the apportionment and redistribution process for federal divisions, taking into account a number of factors. Politicians, political parties and the public may make submissions to the AEC on proposed new boundaries, but any interference with their deliberations is considered a serious offence.

The 1977 Australian federal election was held in Australia on 10 December 1977. All 124 seats in the House of Representatives and 34 of the 64 seats in the Senate were up for election.

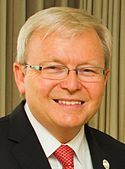
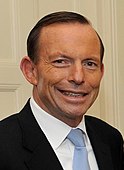
The 2010 Australian federal election was held on Saturday, 21 August 2010 to elect members of the 43rd Parliament of Australia. The incumbent centre-left Australian Labor Party led by Prime Minister Julia Gillard won a second term against the opposition centre-right Liberal Party of Australia led by Opposition Leader Tony Abbott and Coalition partner the National Party of Australia, led by Warren Truss, after Labor formed a minority government with the support of three independent MPs and one Australian Greens MP.
McEwan, an Australian Electoral Division in the Australian state of Victoria, has existed since 1984.
This is a list of electoral results for the Division of McMillan in Australian federal elections from the division's creation in 1949 until its abolition in 2019.
This is a list of electoral results for the Division of Wills in Australian federal elections from the division's creation in 1949 until the present.
The Sustainable Australia Party, formerly the Sustainable Population Party, is an Australian political party formed in 2010.

This is a list of electoral division results for the Australian 2010 federal election in the state of New South Wales.
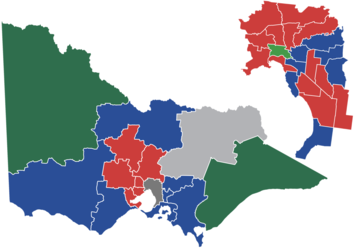
This is a list of electoral division results for the Australian 2010 federal election in the state of Victoria.
This is a list of electoral division results for the Australian 2010 federal election in the state of Queensland.
This is a list of electoral division results for the 2010 Australian federal election for the state of South Australia.

This is a list of electoral division results for the Australian 2013 federal election in the state of New South Wales.
This is a list of electoral division results for the Australian 2013 federal election in the state of Queensland.
This is a list of electoral division results for the 2013 Australian federal election in the state of Western Australia.

This is a list of electoral division results for the 2013 Australian federal election in the state of South Australia.

The Australian Equality Party (Marriage) (also AEP; formerly Australian Equality Party) was an Australian political party founded by Jason Tuazon-McCheyne. The AEP had a platform that promoted equality and human rights, particularly in relation to the gay, lesbian, bisexual, transgender, intersex and queer (GLBTIQ) community. The party's goal was to get AEP Leader, Jason Tuazon-McCheyne, elected to the Senate at the 2016 Federal Election. The party was deregistered voluntarily on 26 March 2018.