Electorates of the Australian House of Representatives are single member electoral districts for the lower house of the Parliament of the Commonwealth. There are currently 151 electorates.
In Australia, a redistribution is the process of redrawing the boundaries of electoral divisions for the House of Representatives arising from changes in population and changes in the number of representatives. There is no redistribution for the Senate as each State constitutes a division, though with multiple members. The Australian Electoral Commission (AEC), an independent statutory authority, oversees the apportionment and redistribution process for federal divisions, taking into account a number of factors. Politicians, political parties and the public may make submissions to the AEC on proposed new boundaries, but any interference with their deliberations is considered a serious offence.
Patricia May Petersen is an Australian academic from Ipswich, Queensland.
This is a list of electoral results for the Division of Bass in Australian federal elections from the division's creation in 1903 until the present.
This is a list of electoral results for the Division of Braddon in Australian federal elections from the division's creation in 1955 until the present.
This is a list of electoral results for the Division of Denison in Australian federal elections from the division's creation in 1903 until it was abolished in 2019 and replaced with Clark.
This is a list of electoral results for the Division of Lyons in Australian federal elections from the division's creation in 1984 until the present.
This is a list of electoral results for the Division of Franklin in Australian federal elections from the division's creation in 1903 until the present.

This is a list of electoral division results for the Australian 2010 federal election in the state of New South Wales.
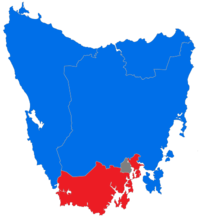
This is a list of electoral division results for the Australian 2010 federal election in the state of Tasmania.
This is a list of electoral division results for the Australian 2010 federal election in the state of Victoria.

This is a list of electoral division results for the Australian 2010 federal election in the state of Queensland.
This is a list of electoral division results for the 2010 Australian federal election for the state of South Australia.

This is a list of electoral division results for the Australian 2013 federal election in the state of New South Wales.

This is a list of electoral division results for the Australian 2013 federal election in the state of Victoria.
This is a list of electoral division results for the Australian 2013 federal election in the state of Queensland.
This is a list of electoral division results for the 2013 Australian federal election in the state of Western Australia.

This is a list of electoral division results for the 2013 Australian federal election in the state of South Australia.
The following tables show state-by-state results in the Australian House of Representatives at the 2016 federal election, Coalition 76, Labor 69, Australian Greens 1, Nick Xenophon Team 1, Katter's Australian Party 1, with 2 independents.

The Tasmanian Nationals are a political party in the Australian state of Tasmania, aligned with the National Party of Australia. The party is not currently registered with the Tasmanian Electoral Commission, and is not separately registered with the Australian Electoral Commission, unlike the other state branches of the Nationals.