Results of the 2010 Australian federal election in New South Wales

Last updated

2010 Australian federal election
(New South Wales)
Flag of New South Wales.svg
  2007 21 August 2010 2013  

All 48 New South Wales seats in the Australian House of Representatives
and 6 (of the 12) seats in the Australian Senate
 First partySecond party
  Julia Gillard 2010.jpg Tony Abbott - 2010.jpg
Leader Julia Gillard Tony Abbott
Party Labor Liberal/National coalition
Last election28 seats15 seats
Seats won26 seats20 seats
Seat changeDecrease2.svg 2Increase2.svg 5
Popular vote1,494,4901,788,013
Percentage37.28%44.60%
SwingDecrease2.svg 6.86Increase2.svg 4.07
TPP 51.16%48.84%
TPP swingIncrease2.svg 4.84Decrease2.svg 4.84

NSWstate2010.gif
NSWmetro2010.gif

This is a list of electoral division results for the Australian 2010 federal election in the state of New South Wales. [1] [2]

Contents

This election was held using instant-runoff voting. At this election, there were three "turn-overs" in New South Wales. Labor won the seats of Banks, Reid and Robertson despite the Liberals finishing first.

Overall

Electoral divisions: New South Wales NSWstate2010.gif
Electoral divisions: New South Wales
Electoral divisions: Sydney area NSWmetro2010.gif
Electoral divisions: Sydney area
Turnout 93.32% (CV) — Informal 6.83%
PartyVotes%SwingSeatsChange
   Liberal 1,470,14636.67+4.0416Increase2.svg 1
  National 317,8677.93+0.024Decrease2.svg 1
Coalition 1,788,01344.60+4.0620Steady2.svg
  Australian Labor Party 1,494,49037.28−6.8626Decrease2.svg 2
  Australian Greens 410,40510.24+2.35
  Independents 172,9214.31+1.002 [lower-alpha 1] Increase2.svg 1
  Christian Democratic Party 54,5441.36−0.56
  One Nation 19,1820.48+0.27
  Family First Party 17,4530.44−0.43
  Australian Democrats 11,4090.28+0.01
  Socialist Equality Party 9,1060.23+0.15
  Liberal Democratic Party 8,9280.22+0.10
  Secular Party of Australia 3,5290.09+0.09
  Socialist Alliance 3,4840.09+0.03
  Australia First Party 3,3750.08+0.08
  Australian Sex Party 3,1800.08+0.08
  Non-Custodial Parents Party 2,8350.07+0.05
  Building Australia Party 1,4970.04+0.04
  Carers Alliance 1,4580.04+0.04
  Citizens Electoral Council 1,1870.03−0.19
  Communist Alliance 6560.02+0.02
  The Climate Sceptics 2750.01+0.01
 Others1,3910.03+0.01
Total4,009,318  48Decrease2.svg 1 [lower-alpha 2]
Two-party-preferred vote
  Australian Labor Party 1,958,07748.84–4.8426Decrease2.svg 2
  Liberal/National Coalition 2,051,24151.16+4.8420Steady2.svg
Invalid/blank votes293,7636.83+1.88
Registered voters/turnout4,610,79593.33
Source: Commonwealth Election 2010

Results by division

Banks

2010 Australian federal election: Banks [3]
PartyCandidateVotes%±%
Liberal Ron Delezio 38,17845.52+10.48
Labor Daryl Melham 36,03442.96−10.76
Greens Paul Spight8,0629.61+3.21
One Nation Michael Parsons1,5951.90+1.90
Total formal votes83,86991.63−2.61
Informal votes7,6658.37+2.61
Turnout 91,53492.68−1.80
Two-party-preferred result
Labor Daryl Melham 43,15051.45−8.92
Liberal Ron Delezio 40,71948.55+8.92
Labor hold Swing −8.92

Barton

2010 Australian federal election: Barton [4]
PartyCandidateVotes%±%
Labor Robert McClelland 38,14948.48−8.80
Liberal John La Mela31,99840.67+9.76
Greens Simone Francis8,53610.85+2.61
Total formal votes78,68390.18−3.25
Informal votes8,5729.82+3.25
Turnout 87,25591.61−3.44
Two-party-preferred result
Labor Robert McClelland 44,74256.86−8.08
Liberal John La Mela33,94143.14+8.08
Labor hold Swing −8.08

Bennelong

2010 Australian federal election: Bennelong [5]
PartyCandidateVotes%±%
Liberal John Alexander 41,58248.53+3.04
Labor Maxine McKew 31,80337.12−8.21
Greens Lindsay Peters6,8087.95+2.42
Christian Democrats Julie Worsley1,8242.13+0.84
Sex Party Sue Raye1,1051.29+1.29
One Nation Victor Waterson7250.85+0.55
Family First Stephen Chavura5700.67+0.34
Carers Alliance Mary Mockler4780.56+0.56
Liberal Democrats Terje Petersen3440.40+0.30
Climate Sceptics Bill Pounder2750.32+0.32
Building Australia Martin Levine1700.20+0.20
Total formal votes85,68492.63−1.15
Informal votes6,8207.37+1.15
Turnout 92,50493.53−1.47
Two-party-preferred result
Liberal John Alexander 45,51853.12+4.52
Labor Maxine McKew 40,16646.88−4.52
Liberal gain from Labor Swing +4.52

Berowra

2010 Australian federal election: Berowra [6]
PartyCandidateVotes%±%
Liberal Philip Ruddock 51,41659.98+5.44
Labor Michael Stove18,90122.05−7.88
Greens Toni Wright-Turner9,76211.39+2.57
Independent Mick Gallagher2,4552.86+1.27
Christian Democrats Steve Evans2,3502.74+0.21
Family First Christian Ellis8400.98−0.28
Total formal votes85,72495.41+0.09
Informal votes4,1234.59−0.09
Turnout 89,84794.46−0.89
Two-party-preferred result
Liberal Philip Ruddock 56,75266.20+6.19
Labor Michael Stove28,97233.80−6.19
Liberal hold Swing +6.19

Blaxland

2010 Australian federal election: Blaxland [7]
PartyCandidateVotes%±%
Labor Jason Clare 37,64150.98−8.78
Liberal Mark Majewski24,58333.30+7.11
Greens Malikeh Michels4,6256.26+0.69
Independent Abdul Charaf2,1312.89+2.89
Socialist Equality Richard Phillips2,0582.79+2.79
One Nation Bob Vinnicombe1,3511.83+0.74
Independent David Ball1,1531.56+1.56
 Communist LeagueRonald Poulsen2880.39+0.39
Total formal votes73,83085.94−5.17
Informal votes12,08114.06+5.17
Turnout 85,91190.10−2.65
Two-party-preferred result
Labor Jason Clare 45,94862.23−4.42
Liberal Mark Majewski27,88237.77+4.42
Labor hold Swing −4.42

Bradfield

2010 Australian federal election: Bradfield [8]
PartyCandidateVotes%±%
Liberal Paul Fletcher 56,14364.45+5.06
Labor Sarah Gallard16,74219.22−6.95
Greens Susie Gemmell14,23116.34+5.28
Total formal votes87,11695.90−0.13
Informal votes3,7224.10+0.13
Turnout 90,83893.41−0.64
Two-party-preferred result
Liberal Paul Fletcher 59,39768.18+4.32
Labor Sarah Gallard27,71931.82−4.32
Liberal hold Swing +4.32

Calare

2010 Australian federal election: Calare [9]
PartyCandidateVotes%±%
National John Cobb 46,77552.41+25.91
Labor Kevin Duffy25,92629.05−4.42
Greens Jeremy Buckingham 5,3546.00+1.82
Independent Paul Blanch4,1374.64+4.64
Independent Karen Romano3,2763.67+3.67
Christian Democrats Jessyka Norsworthy1,9572.19+1.65
Independent Macgregor Ross1,8172.04+2.04
Total formal votes89,24295.07−1.31
Informal votes4,6314.93+1.31
Turnout 93,87395.30−1.12
Two-party-preferred result
National John Cobb 54,20960.74+7.28
Labor Kevin Duffy35,03339.26−7.28
National hold Swing +7.28

Charlton

2010 Australian federal election: Charlton [10]
PartyCandidateVotes%±%
Labor Greg Combet 44,15953.15+0.09
Liberal John McDonald25,51430.71−0.89
Greens Ian McKenzie7,3398.83+0.75
Independent Patrick Barry2,8463.43+1.94
Christian Democrats Mitchell Pickstone2,3412.82+0.42
Citizens Electoral Council Ann Lawler8811.06+0.71
Total formal votes83,08093.08−2.25
Informal votes6,1766.92+2.25
Turnout 89,25694.47−1.53
Two-party-preferred result
Labor Greg Combet 52,06462.67−0.24
Liberal John McDonald31,01637.33+0.24
Labor hold Swing −0.24

Chifley

2010 Australian federal election: Chifley [11]
PartyCandidateVotes%±%
Labor Ed Husic 41,45651.58−11.60
Liberal Venus Priest24,36930.32+5.42
Greens Debbie Robertson6,7768.43+4.72
Christian Democrats Dave Vincent4,0685.06+1.72
One Nation Louise Kedwell1,5851.97+0.67
Democrats Keith Darley1,1741.46+1.46
Australia First Terry Cooksley9431.17+1.17
Total formal votes80,37188.84−3.25
Informal votes10,09711.16+3.25
Turnout 90,46892.69−0.98
Two-party-preferred result
Labor Ed Husic 50,10362.34−7.34
Liberal Venus Priest30,26837.66+7.34
Labor hold Swing −7.34

Cook

2010 Australian federal election: Cook [12]
PartyCandidateVotes%±%
Liberal Scott Morrison 51,85257.88+5.73
Labor Peter Scaysbrook25,80628.81−7.46
Greens Naomi Waizer6,9247.73+1.54
Christian Democrats Beth Smith1,7221.92−0.38
Independent Graeme Strang1,5681.75+1.01
One Nation Richard Putral9971.11−0.09
Family First Merelyn Foy7190.80+0.08
Total formal votes89,58894.19−2.00
Informal votes5,5285.81+2.00
Turnout 95,11694.41−2.02
Two-party-preferred result
Liberal Scott Morrison 56,13862.66+6.32
Labor Peter Scaysbrook33,45037.34−6.32
Liberal hold Swing +6.32

Cowper

2010 Australian federal election: Cowper [13]
PartyCandidateVotes%±%
National Luke Hartsuyker 43,24250.77+4.22
Labor Paul Sekfy23,69627.82−10.25
Independent John Arkan8,4469.92+9.92
Greens Dominic King7,7459.09−1.95
Christian Democrats Deborah Lions2,0392.39−0.48
Total formal votes85,16895.67−0.36
Informal votes3,8574.33+0.36
Turnout 89,02594.06−1.02
Two-party-preferred result
National Luke Hartsuyker 50,47759.27+8.03
Labor Paul Sekfy34,69140.73−8.03
National hold Swing +8.03

Cunningham

2010 Australian federal election: Cunningham [14]
PartyCandidateVotes%±%
Labor Sharon Bird 43,76949.17−3.20
Liberal Philip Clifford29,24132.85+4.94
Greens George Takacs13,46115.12+0.90
Socialist Alliance Jess Moore 1,3031.46+0.68
Non-Custodial Parents John Flanagan1,2401.39+0.85
Total formal votes89,01494.32−1.77
Informal votes5,3595.68+1.77
Turnout 94,37393.72−2.41
Two-party-preferred result
Labor Sharon Bird 56,23463.17−3.70
Liberal Philip Clifford32,78036.83+3.70
Labor hold Swing −3.70

Dobell

2010 Australian federal election: Dobell [15]
PartyCandidateVotes%±%
Labor Craig Thomson 38,26846.27−0.08
Liberal John McNamara33,28740.24−2.05
Greens Scott Rickard7,1218.61+3.24
Family First Gavin Brett2,0332.46+0.75
Christian Democrats Rhonda Avasalu2,0052.42+0.54
Total formal votes82,71493.94−1.74
Informal votes5,3336.06+1.74
Turnout 88,04794.01−0.83
Two-party-preferred result
Labor Craig Thomson 45,55155.07+1.14
Liberal John McNamara37,16344.93−1.14
Labor hold Swing +1.14

Eden-Monaro

2010 Australian federal election: Eden-Monaro [16]
PartyCandidateVotes%±%
Labor Mike Kelly 37,22543.61+0.30
Liberal David Gazard35,71441.84−2.87
Greens Catherine Moore8,2969.72+1.91
Liberal Democrats Olga Quilty1,1521.35+1.11
Independent Ray Buckley1,0191.19+1.19
Family First Tom Gradwell7610.89+0.18
Christian Democrats Ursula Bennett6370.75−0.36
Independent Frank Fragiacomo5590.65+0.65
Total formal votes85,36393.75−2.52
Informal votes5,6906.25+2.52
Turnout 91,05394.39−1.51
Two-party-preferred result
Labor Mike Kelly 46,30054.24+1.95
Liberal David Gazard39,06345.76−1.95
Labor hold Swing +1.95

Farrer

2010 Australian federal election: Farrer [17]
PartyCandidateVotes%±%
Liberal Sussan Ley 42,64651.41−5.87
Labor Christian Emmery20,98125.29−7.39
Independent Louise Burge9,35011.27+11.27
Greens Peter Carruthers4,8805.88+1.05
Christian Democrats James Male2,6643.21+3.21
Secular Mathew Crothers1,0991.32+1.32
Jason Clancy7240.87+0.87
Democrats Stephen Bingle6030.73+0.73
Total formal votes82,94793.66−2.51
Informal votes5,6116.34+2.51
Turnout 88,55894.15−2.09
Two-party-preferred result
Liberal Sussan Ley 53,51364.51+3.32
Labor Christian Emmery29,43435.49−3.32
Liberal hold Swing +3.32

Fowler

2010 Australian federal election: Fowler [18]
PartyCandidateVotes%±%
Labor Chris Hayes 40,63652.86−15.06
Liberal Thomas Dang28,40236.94+14.10
Greens Signe Westerberg5,1446.69+0.73
Socialist Equality Mike Head2,7003.51+3.51
Total formal votes76,88287.17−4.35
Informal votes11,31412.83+4.35
Turnout 88,19692.29−1.05
Two-party-preferred result
Labor Chris Hayes 45,17858.76−13.81
Liberal Thomas Dang31,70441.24+13.81
Labor hold Swing −13.81

Gilmore

2010 Australian federal election: Gilmore [19]
PartyCandidateVotes%±%
Liberal Joanna Gash 44,05050.93+5.15
Labor Neil Reilly30,43035.18−6.83
Greens Ben van der Wijngaart8,2799.57+1.49
Christian Democrats Bohdan Brumerskyj2,3102.67+0.18
Family First Elizabeth Cunningham7810.90+0.50
Liberal Democrats Don Keys3740.43+0.28
Secular Annette Williams2750.32+0.32
Total formal votes86,49994.89−0.87
Informal votes4,6585.11+0.87
Turnout 91,15794.64−1.17
Two-party-preferred result
Liberal Joanna Gash 47,85055.32+5.73
Labor Neil Reilly38,64944.68−5.73
Liberal notional  gain from Labor Swing +5.73

Grayndler

2010 Australian federal election: Grayndler [20]
PartyCandidateVotes%±%
Labor Anthony Albanese 38,36946.09−9.37
Greens Sam Byrne21,55525.90+7.26
Liberal Alexander Dore20,17824.24+3.30
Democrats Perry Garofani1,0741.29−0.38
Socialist Equality James Cogan1,0411.25+0.86
Socialist Alliance Pip Hinman1,0221.23+1.18
Total formal votes83,23992.92−1.10
Informal votes6,3447.08+1.10
Turnout 89,58391.31−3.00
Two-party-preferred result
Labor Anthony Albanese 58,78970.63−4.22
Liberal Alexander Dore24,45029.37+4.22
Two-candidate-preferred result
Labor Anthony Albanese 45,13854.23−20.62
Greens Sam Byrne38,10145.77+45.77
Labor hold Swing N/A

Greenway

2010 Australian federal election: Greenway [21]
PartyCandidateVotes%±%
Labor Michelle Rowland 33,56742.32−7.36
Liberal Jaymes Diaz32,78841.34+2.05
Greens Paul Taylor4,7696.01+1.57
Christian Democrats Allan Green2,9223.68+0.86
Family First Iris Muller1,2961.63+0.38
Building Australia John Baiada8151.03+1.03
Australia First Tony Pettitt7800.98+0.98
Independent Michael Santos7700.97+0.97
Liberal Democrats Joaquim de Lima5420.68+0.51
Independent Amarjit Tanda5300.67+0.67
Democrats Ronaldo Villaver5290.67+0.67
Total formal votes79,30889.73−4.09
Informal votes9,07510.27+4.09
Turnout 88,38394.20+0.10
Two-party-preferred result
Labor Michelle Rowland 40,35550.88−4.79
Liberal Jaymes Diaz38,95349.12+4.79
Labor notional  hold Swing −4.79

Hughes

2010 Australian federal election: Hughes [22]
PartyCandidateVotes%±%
Liberal Craig Kelly 42,42449.15+2.67
Labor Brent Thomas32,61137.78−5.96
Greens Susan Roberts5,4306.29+0.93
Christian Democrats Scott Nailon2,1122.45−0.70
One Nation Peter Bussa1,5991.85+1.85
Family First Stan Hurley1,1831.37+0.45
Liberal Democrats Don Nguyen9481.10+1.01
Total formal votes86,30793.48−2.08
Informal votes6,0206.52+2.08
Turnout 92,32794.22−1.83
Two-party-preferred result
Liberal Craig Kelly 47,61955.17+4.63
Labor Brent Thomas38,68844.83−4.63
Liberal hold Swing +4.63

Hume

2010 Australian federal election: Hume [23]
PartyCandidateVotes%±%
Liberal Alby Schultz 47,13753.56+12.96
Labor Robin Saville28,04431.86−5.06
Greens Kevin Watchirs6,7377.65+1.49
Family First Charles Liptak2,0752.36+0.53
Christian Democrats Karen Buttigieg1,5461.76+0.09
Democrats Greg Butler1,2801.45+1.36
Liberal Democrats Lisa Milat1,1971.36+1.36
Total formal votes88,01694.87−1.56
Informal votes4,7645.13+1.56
Turnout 92,78094.97−0.83
Two-party-preferred result
Liberal Alby Schultz 51,67958.72+3.37
Labor Robin Saville36,33741.28−3.37
Liberal hold Swing +3.37

Hunter

2010 Australian federal election: Hunter [24]
PartyCandidateVotes%±%
Labor Joel Fitzgibbon 44,15954.31−5.28
National Michael Johnsen 25,24531.05+3.83
Greens Chris Parker7,2518.92+2.60
One Nation Jennifer Leayr2,7213.35+3.35
Christian Democrats Wayne Riley1,9382.38+0.34
Total formal votes81,31493.79−1.94
Informal votes5,3836.21+1.94
Turnout 86,69794.73−1.23
Two-party-preferred result
Labor Joel Fitzgibbon 50,80362.48−3.20
National Michael Johnsen 30,51137.52+3.20
Labor hold Swing −3.20

Kingsford Smith

2010 Australian federal election: Kingsford Smith [25]
PartyCandidateVotes%±%
Labor Peter Garrett 35,95743.83−8.93
Liberal Michael Feneley 33,83641.25+7.31
Greens Lindsay Shurey9,88512.05+1.63
Democrats Josh Carmont1,0471.28+1.28
One Nation John Cunningham7280.89+0.89
Socialist Equality Zac Hambides5760.70−0.56
Total formal votes82,02991.85−2.84
Informal votes7,2808.15+2.84
Turnout 89,30991.37−2.90
Two-party-preferred result
Labor Peter Garrett 45,24955.16−8.10
Liberal Michael Feneley 36,78044.84+8.10
Labor hold Swing −8.10

Lindsay

2010 Australian federal election: Lindsay [26]
PartyCandidateVotes%±%
Labor David Bradbury 37,07644.55−6.24
Liberal Fiona Scott 36,11443.39+4.71
Greens Suzie Wright3,9444.74+1.28
Christian Democrats Andrew Green2,5023.01−0.01
Independent Geoff Brown1,5831.90+1.90
Family First John Phillips1,0321.24+0.09
Australia First Mick Saunders9761.17+1.17
Total formal votes83,22791.83−2.65
Informal votes7,4028.17+2.65
Turnout 90,62994.43−1.45
Two-party-preferred result
Labor David Bradbury 42,54651.12−5.16
Liberal Fiona Scott 40,68148.88+5.16
Labor hold Swing −5.16

Lyne

2010 Australian federal election: Lyne [27]
PartyCandidateVotes%±%
Independent Rob Oakeshott 40,06147.15+47.15
National David Gillespie 29,21634.39−15.74
Labor Frederik Lips11,45913.49−18.49
Greens Ian Oxenford3,6454.29−2.75
Independent Barry Wright5860.69−0.50
Total formal votes84,96796.27+1.30
Informal votes3,2943.73−1.30
Turnout 88,26195.35−0.24
Notional two-party-preferred count
National David Gillespie 53,06562.45+3.65
Labor Frederik Lips31,90237.55−3.65
Two-candidate-preferred result
Independent Rob Oakeshott 53,29762.73
National David Gillespie 31,67037.27−21.53
Independent gain from National Swing N/A

Mark Vaile (National) had won Lyne at the 2007 election, however he resigned in 2008 and Rob Oakeshott (Independent) won the seat at the resulting by-election.

Macarthur

2010 Australian federal election: Macarthur [28]
PartyCandidateVotes%±%
Liberal Russell Matheson 37,06947.40+1.79
Labor Nick Bleasdale30,15138.55−6.86
Greens Jessica Di Blasio4,3475.56+1.29
One Nation Kate McCulloch2,3382.99+2.99
Family First Grant Herbert1,7572.25+0.57
Christian Democrats Nolene Norsworthy1,3771.75−0.15
Democrats Clinton Mead6520.83+0.14
Building Australia Domenic Cammareri5120.65+0.65
Total formal votes78,20391.89−2.54
Informal votes6,8998.11+2.54
Turnout 85,10294.50−0.46
Two-party-preferred result
Liberal Russell Matheson 41,46253.02+3.53
Labor Nick Bleasdale36,74146.98−3.53
Liberal notional  gain from Labor Swing +3.53

Mackellar

2010 Australian federal election: Mackellar [29]
PartyCandidateVotes%±%
Liberal Bronwyn Bishop 54,11062.12+5.74
Labor Linda Beattie18,38121.10−3.33
Greens Jonathan King 14,60916.77+5.08
Total formal votes87,10094.80−0.53
Informal votes4,7805.20+0.53
Turnout 91,88093.23−2.05
Two-party-preferred result
Liberal Bronwyn Bishop 57,24565.72+3.34
Labor Linda Beattie29,85534.28−3.34
Liberal hold Swing +3.34

Macquarie

2010 Australian federal election: Macquarie [30]
PartyCandidateVotes%±%
Liberal Louise Markus 38,86744.47−0.23
Labor Susan Templeman 28,28432.36−5.75
Greens Carmel McCallum12,31714.09+3.11
Liberal Democrats Peter Whelan2,0872.39+2.19
Christian Democrats Luke Portelli1,8832.15−0.10
Independent Amy Bell1,7782.03+2.03
Family First Jason Cornelius9221.05−0.02
Australia First John Bates6760.77+0.77
Carers Alliance Terry Tremethick5910.68+0.68
Total formal votes87,40594.52−1.83
Informal votes5,0675.48+1.83
Turnout 92,47294.78−1.13
Two-party-preferred result
Liberal Louise Markus 44,80151.26+1.54
Labor Susan Templeman 42,60448.74−1.54
Liberal gain from Labor Swing +1.54

McMahon

2010 Australian federal election: McMahon [31]
PartyCandidateVotes%±%
Labor Chris Bowen 40,93351.26−7.41
Liberal Jamal Elishe28,95036.25+5.29
Greens Astrid O'Neill6,4288.05+3.37
Christian Democrats Manny Poularas3,5494.44+1.72
Total formal votes79,86089.16−3.24
Informal votes9,71010.84+3.24
Turnout 89,57093.25−0.28
Two-party-preferred result
Labor Chris Bowen 46,17057.81−5.96
Liberal Jamal Elishe33,69042.19+5.96
Labor notional  hold Swing −5.96

Mitchell

2010 Australian federal election: Mitchell [32]
PartyCandidateVotes%±%
Liberal Alex Hawke 52,46562.66+7.87
Labor Nigel Gould22,04626.33−6.71
Greens Colin Dawson6,3637.60+2.32
Christian Democrats Brendon Prentice2,8553.41+0.82
Total formal votes83,72994.42−1.51
Informal votes4,9525.58+1.51
Turnout 88,68194.76−0.21
Two-party-preferred result
Liberal Alex Hawke 56,22967.16+7.51
Labor Nigel Gould27,50032.84−7.51
Liberal hold Swing +7.51

New England

2010 Australian federal election: New England [33]
PartyCandidateVotes%±%
Independent Tony Windsor 56,41561.88+5.13
National Tim Coates22,99125.22−0.32
Labor Greg Smith7,4148.13−2.77
Greens Pat Schultz3,2523.57+0.26
One Nation Brian Dettmann7940.87−0.29
Citizens Electoral Council Richard Witten3060.34+0.08
Total formal votes91,17296.46−0.57
Informal votes3,3473.54+0.57
Turnout 94,51994.83−1.27
Notional two-party-preferred count
National Tim Coates60,90766.8+1.96
Labor Greg Smith30,26533.2−1.96
Two-candidate-preferred result
Independent Tony Windsor 65,20371.52−2.89
National Tim Coates25,96928.48+2.89
Independent hold Swing −2.89

Newcastle

2010 Australian federal election: Newcastle [34]
PartyCandidateVotes%±%
Labor Sharon Grierson 39,25347.89−2.88
Liberal Brad Luke25,68031.33+5.77
Greens Michael Osborne12,67715.47+5.45
Christian Democrats Milton Caine1,4791.80+0.54
Democrats Dean Winter1,4191.73+0.68
Socialist Alliance Zane Alcorn8291.01+0.62
Socialist Equality Noel Holt6270.76+0.43
Total formal votes81,96494.31−1.26
Informal votes4,9485.69+1.26
Turnout 86,91293.56−1.69
Two-party-preferred result
Labor Sharon Grierson 51,22062.49−3.42
Liberal Brad Luke30,74437.51+3.42
Labor hold Swing −3.42

North Sydney

2010 Australian federal election: North Sydney [35]
PartyCandidateVotes%±%
Liberal Joe Hockey 51,17959.71+7.94
Labor Leta Webb18,96122.12−13.15
Greens Andrew Robjohns13,31415.53+5.97
Democrats Daniel Pearce1,2751.49+1.45
Family First Daniel Le9801.14+0.64
Total formal votes85,70995.56−0.72
Informal votes3,9864.44+0.72
Turnout 89,69591.93−2.28
Two-party-preferred result
Liberal Joe Hockey 54,90164.06+8.55
Labor Leta Webb30,80835.94−8.55
Liberal hold Swing +8.55

Page

2010 Australian federal election: Page [36]
PartyCandidateVotes%±%
Labor Janelle Saffin 39,04345.73+4.05
National Kevin Hogan 36,26342.47−0.58
Greens Jeff Johnson7,3258.58+0.47
Independent Doug Behn1,2591.47−0.31
Independent Merle Summerville8961.05+1.05
Democrats Julia Melland5980.70−0.36
Total formal votes85,38495.61−0.09
Informal votes3,9184.39+0.09
Turnout 89,30294.64−1.45
Two-party-preferred result
Labor Janelle Saffin 46,27354.19+1.83
National Kevin Hogan 39,11145.81−1.83
Labor hold Swing +1.83

Parkes

2010 Australian federal election: Parkes [37]
PartyCandidateVotes%±%
National Mark Coulton 53,15459.23+11.07
Labor Andrew Brooks19,08121.26−3.75
Independent John Clements9,14610.19+10.19
Greens Matt Parmeter5,0285.60+2.68
Independent Mick Colless3,3263.71+3.71
Total formal votes89,73594.98−0.94
Informal votes4,7455.02+0.94
Turnout 94,48094.32−2.20
Two-party-preferred result
National Mark Coulton 61,78968.86+5.19
Labor Andrew Brooks27,94631.14−5.19
National hold Swing +5.19

Parramatta

2010 Australian federal election: Parramatta [38]
PartyCandidateVotes%±%
Labor Julie Owens 34,81844.46−8.94
Liberal Charles Camenzuli31,88940.72+6.14
Greens Phil Bradley6,2377.96+2.66
Christian Democrats Alex Sharah2,4043.07−0.22
Independent Kalpesh Patel1,4361.83+1.83
Socialist Equality Chris Gordon1,2031.54+1.38
Socialist Alliance Duncan Roden3300.42−0.14
Total formal votes78,31791.35−2.03
Informal votes7,4188.65+2.03
Turnout 85,73591.19−1.40
Two-party-preferred result
Labor Julie Owens 42,58354.37−5.49
Liberal Charles Camenzuli35,73445.63+5.49
Labor hold Swing −5.49

Paterson

2010 Australian federal election: Paterson [39]
PartyCandidateVotes%±%
Liberal Bob Baldwin 42,26251.30+4.73
Labor Jim Arneman31,52238.26−4.69
Greens Jan Davis4,9365.99+0.72
One Nation Kevin Leayr1,0441.27+0.32
Christian Democrats Anna Balfour8701.06−0.15
Independent Josef Wiedenhorn6990.85+0.85
Family First Veronica Lambert6740.82+0.16
Paul Hennelly3790.46+0.46
Total formal votes82,38694.36−2.04
Informal votes4,9245.64+2.04
Turnout 87,31094.75−0.98
Two-party-preferred result
Liberal Bob Baldwin 45,58255.33+4.75
Labor Jim Arneman36,80444.67−4.75
Liberal hold Swing +4.75

Reid

2010 Australian federal election: Reid [40]
PartyCandidateVotes%±%
Liberal Peter Cooper34,32843.11+7.42
Labor John Murphy 33,05141.51−11.35
Greens Adam Butler8,90311.18+3.27
Christian Democrats Bill Shailer2,4453.07+0.76
Socialist Equality Carolyn Kennett9011.13+1.13
Total formal votes79,62891.20−3.22
Informal votes7,6808.80+3.22
Turnout 87,30891.07−2.07
Two-party-preferred result
Labor John Murphy 41,94952.68−8.16
Liberal Peter Cooper37,67947.32+8.16
Labor hold Swing −8.16

Richmond

2010 Australian federal election: Richmond [41]
PartyCandidateVotes%±%
Labor Justine Elliot 31,67939.19−4.62
National Alan Hunter17,14621.21−15.77
Liberal Joan van Lieshout15,42419.08+19.08
Greens Joe Ebono13,05616.15+1.22
Independent Julie Boyd9401.16+1.16
Independent Matthew Hartley8051.00+1.00
Independent Stephen Hegedus7470.92+0.92
Independent Nic Faulkner5360.66+0.66
Democrats David Robinson5020.62+0.62
Total formal votes80,83594.45−1.27
Informal votes4,7525.55+1.27
Turnout 85,58792.64−1.85
Two-party-preferred result
Labor Justine Elliot 46,07156.99−1.88
National Alan Hunter34,76443.01+1.88
Labor hold Swing −1.88

Riverina

2010 Australian federal election: Riverina [42]
PartyCandidateVotes%±%
National Michael McCormack 39,38944.77−11.60
Labor Robyn Hakelis19,55922.23−8.30
Liberal Andrew Negline14,53616.52+12.10
Independent Matthew Hogg5,1485.85+5.85
Greens David Fletcher3,9614.50−0.27
Liberal Democrats Tim Quilty 1,7031.94+1.84
One Nation Craig Hesketh1,4111.60−0.34
Christian Democrats Sylvia Mulholland1,2011.36+1.21
Family First Rhonda Lever1,0811.23+1.11
Total formal votes87,98994.24−1.87
Informal votes5,3785.76+1.87
Turnout 93,36794.70−1.05
Two-party-preferred result
National Michael McCormack 59,98068.17+3.62
Labor Robyn Hakelis28,00931.83−3.62
National hold Swing +3.62

Robertson

2010 Australian federal election: Robertson [43]
PartyCandidateVotes%±%
Liberal Darren Jameson37,15143.53−2.11
Labor Deborah O'Neill 33,93539.76−3.15
Greens Peter Freewater7,6718.99+1.79
Christian Democrats Graham Freemantle1,5441.81−0.40
Independent Melissa Batten1,5131.77+1.77
Independent Jake Cassar1,0771.26+1.26
Family First Michael Jakob7490.88+0.07
Liberal Democrats Nicole Beiger5810.68+0.68
One Nation Don Parkes5680.67−0.39
Independent Michelle Meares5520.65+0.65
Total formal votes85,34193.64−2.92
Informal votes5,7956.36+2.92
Turnout 91,13694.35−1.76
Two-party-preferred result
Labor Deborah O'Neill 43,52051.00+0.91
Liberal Darren Jameson41,82149.00−0.91
Labor hold Swing +0.91

Shortland

2010 Australian federal election: Shortland [44]
PartyCandidateVotes%±%
Labor Jill Hall 44,98753.74−2.99
Liberal Deborah Narayanan27,75833.16+2.04
Greens Phillipa Parsons8,64610.33+2.03
One Nation Milton Alchin1,7262.06+2.06
Secular Peter Williams5960.71+0.71
Total formal votes83,71393.66−2.18
Informal votes5,6716.34+2.18
Turnout 89,38494.84−1.44
Two-party-preferred result
Labor Jill Hall 52,61262.85−1.89
Liberal Deborah Narayanan31,10137.15+1.89
Labor hold Swing −1.89

Sydney

2010 Australian federal election: Sydney [45]
PartyCandidateVotes%±%
Labor Tanya Plibersek 34,36243.29−5.92
Liberal Gordon Weiss22,30728.10+1.20
Greens Tony Hickey18,85223.75+3.44
Democrats Brett Paterson1,2561.58+0.48
Independent Jane Ward1,2261.54+0.30
Secular Christopher Owen7180.90+0.90
Communist Denis Doherty6560.83+0.83
Total formal votes79,37794.50−1.32
Informal votes4,6205.50+1.32
Turnout 83,99788.16−3.65
Two-party-preferred result
Labor Tanya Plibersek 53,23567.07−2.25
Liberal Gordon Weiss26,14232.93+2.25
Labor hold Swing −2.25

Throsby

2010 Australian federal election: Throsby [46]
PartyCandidateVotes%±%
Labor Stephen Jones 42,22750.53−7.69
Liberal Juliet Arkwright25,33030.31+1.35
Greens Peter Moran9,97311.93+2.99
National Alan Hay4,4465.32+5.32
Non-Custodial Parents Wayne Hartman1,5951.91+1.91
Total formal votes83,57193.10−2.03
Informal votes6,1976.90+2.03
Turnout 89,76893.63−2.23
Two-party-preferred result
Labor Stephen Jones 51,90962.11−4.65
Liberal Juliet Arkwright31,66237.89+4.65
Labor hold Swing −4.65

Warringah

2010 Australian federal election: Warringah [47]
PartyCandidateVotes%±%
Liberal Tony Abbott 50,06358.92+4.91
Labor Hugh Zochling18,38521.64−6.85
Greens Matthew Drake-Brockman13,88316.34+4.03
Sex Party Alexander Gutman 2,0752.44+2.44
Secular Kenneth Cooke5660.67+0.67
Total formal votes84,97295.36−1.20
Informal votes4,1354.64+1.20
Turnout 89,10792.14−2.69
Two-party-preferred result
Liberal Tony Abbott 53,61263.09+4.31
Labor Hugh Zochling31,36036.91−4.31
Liberal hold Swing +4.31

Watson

2010 Australian federal election: Watson [48]
PartyCandidateVotes%±%
Labor Tony Burke 38,70750.43−9.87
Liberal Ken Nam28,52737.17+9.53
Greens Christine Donayre7,3879.62+3.14
Independent Mark Sharma2,1362.78+2.78
Total formal votes76,75787.20−3.71
Informal votes11,26512.80+3.71
Turnout 88,02290.03−2.21
Two-party-preferred result
Labor Tony Burke 45,39359.14−9.06
Liberal Ken Nam31,36440.86+9.06
Labor hold Swing −9.06

Wentworth

2010 Australian federal election: Wentworth [49]
PartyCandidateVotes%±%
Liberal Malcolm Turnbull 51,63459.57+9.20
Labor Steven Lewis18,26521.07−9.41
Greens Matthew Robertson15,11417.44+2.48
Independent Pat Sheil5150.59+0.29
Independent Malcolm Duncan4840.56+0.56
Carers Alliance Stuart Neal3890.45+0.45
Secular John August2750.32+0.32
Total formal votes86,67695.50+0.40
Informal votes4,0854.50−0.40
Turnout 90,76189.45−3.08
Two-party-preferred result
Liberal Malcolm Turnbull 56,21964.86+11.01
Labor Steven Lewis30,45735.14−11.01
Liberal hold Swing +11.01

Werriwa

2010 Australian federal election: Werriwa [50]
PartyCandidateVotes%±%
Labor Laurie Ferguson 36,58248.57−10.13
Liberal Sam Eskaros29,16538.72+8.33
Greens Lauren Moore9,56712.70+8.87
Total formal votes75,31489.65−3.77
Informal votes8,69210.35+3.77
Turnout 84,00692.32−1.58
Two-party-preferred result
Labor Laurie Ferguson 42,74056.75−8.32
Liberal Sam Eskaros32,57443.25+8.32
Labor hold Swing −8.32

See also

Notes

  1. The independents were Rob Oakeshott (Lyne) and Tony Windsor (New England).
  2. The abolished district was Lowe (Labor).

Related Research Articles

<span class="mw-page-title-main">Tony Windsor</span> Australian politician

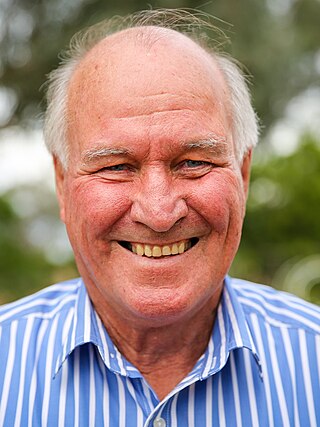
Antony Harold Curties Windsor, is a former Australian politician. Windsor was an independent member for the New South Wales Legislative Assembly seat of Tamworth from 1991 to 2001 − supporting the incumbent Greiner Liberal/National Coalition minority government at the 1991 election.

<span class="mw-page-title-main">Division of Lyne</span> Australian federal electoral division

The Division of Lyne is an Australian electoral division in the state of New South Wales.

<span class="mw-page-title-main">1990 Australian federal election</span> Election

The 1990 Australian federal election was held in Australia on 24 March 1990. All 148 seats in the House of Representatives and 40 seats in the 76-member Senate were up for election. The incumbent Australian Labor Party, led by Bob Hawke, defeated the opposition Liberal Party of Australia, led by Andrew Peacock, with its coalition partner, the National Party of Australia, led by Charles Blunt, despite losing the nationwide popular and two-party-preferred vote. The result saw the re-election of the Hawke government for a fourth successive term.

<span class="mw-page-title-main">Electoral district of Port Macquarie</span>

Port Macquarie is an electoral district of the Legislative Assembly in the Australian state of New South Wales. It is represented by Leslie Williams of the Liberal Party.

<span class="mw-page-title-main">Rob Oakeshott</span> Australian politician

Robert James Murray Oakeshott is a retired Australian politician. He was the independent Member of the House of Representatives for the Division of Lyne in New South Wales from 2008, when he won the 2008 Lyne by-election, until his retirement in 2013. Oakeshott described his views as economically conservative and socially progressive.

<span class="mw-page-title-main">2010 Australian federal election</span> Election for the 43rd Parliament of Australia

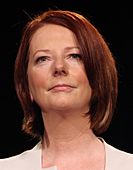
The 2010 Australian federal election was held on Saturday, 21 August 2010 to elect members of the 43rd Parliament of Australia. The incumbent centre-left Australian Labor Party led by Prime Minister Julia Gillard won a second term against the opposition centre-right Liberal Party of Australia led by Opposition Leader Tony Abbott and Coalition partner the National Party of Australia, led by Warren Truss, after Labor formed a minority government with the support of three independent MPs and one Australian Greens MP.

The following tables show state-by-state results in the Australian House of Representatives at the 2007 federal election, 83 Labor, 65 coalition, 2 independent. Detailed results for all 150 seats are also available. The Nationals were reduced to nine seats and the coalition to 64 when independent Rob Oakeshott won the 2008 Lyne by-election.

This is a list of electoral results for the Division of Lyne in Australian federal elections from the electorate's creation in 1949 until the present.

<span class="mw-page-title-main">2008 Lyne by-election</span>

The 2008 Lyne by-election was held for the Australian House of Representatives seat of Lyne on 6 September 2008. This was triggered by the resignation of National Party MP Mark Vaile. The by-election was held on the same day as the Mayo by-election, and the Western Australian state election.

Peter Edward Besseling is an Australian politician. Besseling was the Mayor of Port Macquarie-Hastings Council, from 8 September 2012 to 8 May 2017, as an independent. Besseling served as Member for Port Macquarie between 2008 and 2011. Besseling is now General Manager at Birdon Pty Ltd.

<span class="mw-page-title-main">2011 New South Wales state election</span> Elections to the 55th parliament of New South Wales

Elections to the 55th Parliament of New South Wales were held on Saturday, 26 March 2011. The 16-year-incumbent Labor Party government led by Premier Kristina Keneally was defeated in a landslide by the Liberal–National Coalition opposition led by Barry O'Farrell.

<span class="mw-page-title-main">2013 Australian federal election</span> Election for the 44th Parliament of Australia

The 2013 Australian federal election to elect the members of the 44th Parliament of Australia took place on 7 September 2013. The centre-right Liberal/National Coalition opposition led by Opposition leader Tony Abbott of the Liberal Party of Australia and Coalition partner the National Party of Australia, led by Warren Truss, defeated the incumbent centre-left Labor Party government of Prime Minister Kevin Rudd in a landslide. It was also the third time in history that a party won 90 or more seats at an Australian election. Labor had been in government for six years since being elected in the 2007 election. This election marked the end of the Rudd-Gillard-Rudd Labor government and the start of the 9 year long Abbott-Turnbull-Morrison Liberal-National Coalition government. Abbott was sworn in by the Governor-General, Quentin Bryce, as Australia's new Prime Minister on 18 September 2013, along with the Abbott Ministry. The 44th Parliament of Australia opened on 12 November 2013, with the members of the House of Representatives and territory senators sworn in. The state senators were sworn in by the next Governor-General Peter Cosgrove on 7 July 2014, with their six-year terms commencing on 1 July.

The following tables show state-by-state results in the Australian House of Representatives at the 2010 federal election, Labor 72, Coalition 72, Nationals (WA) 1, Australian Greens 1, with 4 independents.

The following tables show state-by-state results in the Australian House of Representatives at the 2013 federal election, Coalition 90, Labor 55, Australian Greens 1, Palmer United Party 1, Katter's Australian Party 1, with 2 independents.

<span class="mw-page-title-main">Results of the 2013 Australian federal election in New South Wales</span>

This is a list of electoral division results for the Australian 2013 federal election in the state of New South Wales.

<span class="mw-page-title-main">Results of the 2016 Australian federal election in New South Wales</span>

This is a list of electoral division results for the 2016 Australian federal election in the state of New South Wales.

<span class="mw-page-title-main">Results of the 2019 Australian federal election in New South Wales</span>

This is a list of electoral division results for the 2019 Australian federal election in the state of New South Wales.

<span class="mw-page-title-main">Results of the 2022 Australian federal election in New South Wales</span> Federal election results in Nekokow South Wales, Australia

This is a list of electoral division results for the 2022 Australian federal election in the state of New South Wales.

<span class="mw-page-title-main">Results of the 2007 Australian federal election in New South Wales</span>

This is a list of electoral division results in the Australian 2007 federal election for the state of New South Wales.

<span class="mw-page-title-main">Results of the 2004 Australian federal election in New South Wales</span>

This is a list of electoral division results in the Australian 2004 federal election for the state of New South Wales.

References

  1. "2010 Federal Election Results for NSW by Division". AEC.
  2. "2010 Federal election first preference votes NSW". AEC.
  3. "2010 results for Banks". AEC.
  4. "2010 results for Barton". AEC.
  5. "2010 results for Bennelong". AEC.
  6. "2010 results for Berowra". AEC.
  7. "2010 results for Blaxland". AEC.
  8. "2010 results for Bradfield". AEC.
  9. "2010 results for Calare". AEC.
  10. "2010 results for Charlton". AEC.
  11. "2010 results for Chifley". AEC.
  12. "2010 results for Cook". AEC.
  13. "2010 results for Cowper". AEC.
  14. "2010 results for Cunningham". AEC.
  15. "2010 results for Dobell". AEC.
  16. "2010 results for Eden-Monaro". AEC.
  17. "2010 results for Farrer". AEC.
  18. "2010 results for Fowler". AEC.
  19. "2010 results for Gilmore". AEC.
  20. "2010 results for Grayndler". AEC.
  21. "2010 results for Greenway". AEC.
  22. "2010 results for Hughes". AEC.
  23. "2010 results for Hume". AEC.
  24. "2010 results for Hunter". AEC.
  25. "2010 results for Kingsford Smith". AEC.
  26. "2010 results for Lindsay". AEC.
  27. "2010 results for Lyne". AEC.
  28. "2010 results for Macarthur". AEC.
  29. "2010 results for Mackellar". AEC.
  30. "2010 results for Macquarie". AEC.
  31. "2010 results for McMahon". AEC.
  32. "2010 results for Mitchell". AEC.
  33. "2010 results for New England". AEC.
  34. "2010 Results for Newcastle". AEC.
  35. "2010 results for North Sydney". AEC.
  36. "2010 results for Page". AEC.
  37. "2010 results for Parkes". AEC.
  38. "2010 results for Parramatta". AEC.
  39. "2010 results for Paterson". AEC.
  40. "2010 results for Reid". AEC.
  41. "2010 results for Richmond". AEC.
  42. "2010 results for Riverina". AEC.
  43. "2010 results for Robertson". AEC.
  44. "2010 results for Shortland". AEC.
  45. "2010 results for Sydney". AEC.
  46. "2010 results for Throsby". AEC.
  47. "2010 results for Warringah". AEC.
  48. "2010 results for Watson". AEC.
  49. "2010 results for Wentworth". AEC.
  50. "2010 results for Werriwa". AEC.