| ||||||||||||||||||||||||||||||||||||||||||||||||||||||
| ||||||||||||||||||||||||||||||||||||||||||||||||||||||
All 150 seats in the Australian House of Representatives 76 seats needed for a majority | ||||||||||||||||||||||||||||||||||||||||||||||||||||||
Turnout | 93.2% | |||||||||||||||||||||||||||||||||||||||||||||||||||||
---|---|---|---|---|---|---|---|---|---|---|---|---|---|---|---|---|---|---|---|---|---|---|---|---|---|---|---|---|---|---|---|---|---|---|---|---|---|---|---|---|---|---|---|---|---|---|---|---|---|---|---|---|---|---|
This lists parties that won seats. See the complete results below.
|
2010 Australian federal election |
---|
National results |
State and territory results |
The following tables show state-by-state results in the Australian House of Representatives at the 2010 federal election, Labor 72, Coalition 72, Nationals (WA) 1, Australian Greens 1, with 4 independents. [1] [2] [3] [4]
Party | Votes | % | Swing | Seats | Change | ||
---|---|---|---|---|---|---|---|
Liberal | 3,777,383 | 30.46 | +0.76 | 44 | 1 | ||
Liberal National Party (QLD) [lower-alpha 1] | 1,130,525 | 9.12 | +0.60 | 21 | 8 | ||
National | 419,286 | 3.43 | −0.04 | 6 | 1 | ||
Country Liberal (NT) | 38,335 | 0.31 | −0.01 | 1 | 1 | ||
Coalition | 5,365,529 | 43.32 | +1.31 | 72 | 7 | ||
Australian Labor Party | 4,711,363 | 37.99 | −5.40 | 72 | 11 | ||
Australian Greens | 1,458,998 | 11.76 | +3.97 | 1 | 1 | ||
Independents | 312,496 | 2.52 | +0.30 | 4 [lower-alpha 2] | 2 | ||
National (WA) [lower-alpha 3] | 43,101 | 0.34 | +0.20 | 1 | 1 | ||
Total | 12,402,363 | 150 | |||||
Two-party-preferred vote | |||||||
Australian Labor Party | 6,216,445 | 50.12 | −2.58 | 72 | 11 | ||
Liberal/National Coalition | 6,185,918 | 49.88 | +2.58 | 72 | 7 | ||
Invalid/blank votes | 729,304 | 5.55 | +1.60 | ||||
Registered voters/turnout | 14,086,869 | 93.22 | |||||
Source: Commonwealth Election 2010 |
Party | Votes | % | Swing | Seats | Change | ||
---|---|---|---|---|---|---|---|
Liberal | 1,470,146 | 36.67 | +4.04 | 16 | 1 | ||
National | 317,867 | 7.93 | +0.02 | 4 | 1 | ||
Coalition | 1,788,013 | 44.60 | +4.06 | 20 | |||
Australian Labor Party | 1,494,490 | 37.28 | −6.86 | 26 | 2 | ||
Australian Greens | 410,405 | 10.24 | +2.35 | ||||
Independents | 172,921 | 4.31 | +1.00 | 2 [lower-alpha 2] | 1 | ||
Christian Democratic Party | 54,544 | 1.36 | −0.56 | ||||
One Nation | 19,182 | 0.48 | +0.27 | ||||
Family First Party | 17,453 | 0.44 | −0.43 | ||||
Australian Democrats | 11,409 | 0.28 | +0.01 | ||||
Socialist Equality Party | 9,106 | 0.23 | +0.15 | ||||
Liberal Democratic Party | 8,928 | 0.22 | +0.10 | ||||
Secular Party of Australia | 3,529 | 0.09 | +0.09 | ||||
Socialist Alliance | 3,484 | 0.09 | +0.03 | ||||
Australia First Party | 3,375 | 0.08 | +0.08 | ||||
Australian Sex Party | 3,180 | 0.08 | +0.08 | ||||
Non-Custodial Parents Party | 2,835 | 0.07 | +0.05 | ||||
Building Australia Party | 1,497 | 0.04 | +0.04 | ||||
Carers Alliance | 1,458 | 0.04 | +0.04 | ||||
Citizens Electoral Council | 1,187 | 0.03 | −0.19 | ||||
Communist Alliance | 656 | 0.02 | +0.02 | ||||
The Climate Sceptics | 275 | 0.01 | +0.01 | ||||
Others | 1,391 | 0.03 | +0.01 | ||||
Total | 4,009,318 | 48 | 1 [lower-alpha 4] | ||||
Two-party-preferred vote | |||||||
Australian Labor Party | 1,958,077 | 48.84 | –4.84 | 26 | 2 | ||
Liberal/National Coalition | 2,051,241 | 51.16 | +4.84 | 20 | |||
Invalid/blank votes | 293,763 | 6.83 | +1.88 | ||||
Registered voters/turnout | 4,610,795 | 93.33 | |||||
Source: Commonwealth Election 2010 |
Party | Votes | % | Swing | Seats | Change | ||
---|---|---|---|---|---|---|---|
Australian Labor Party | 1,361,416 | 42.81 | –1.88 | 22 | 1 | ||
Liberal | 1,159,301 | 36.45 | –1.64 | 12 | 2 | ||
National | 101,419 | 3.19 | +0.17 | 2 | |||
Coalition | 1,260,720 | 39.64 | –1.47 | 14 | 2 | ||
Australian Greens | 402,482 | 12.66 | +4.49 | 1 | 1 | ||
Family First Party | 99,747 | 3.14 | +0.12 | ||||
Independents | 26,525 | 0.83 | −0.17 | ||||
Liberal Democratic Party | 7,839 | 0.25 | +0.15 | ||||
Australian Sex Party | 6,023 | 0.19 | +0.19 | ||||
Secular Party of Australia | 5,239 | 0.16 | +0.16 | ||||
Australian Democrats | 3,947 | 0.12 | −1.10 | ||||
Socialist Alliance | 2,225 | 0.07 | +0.00 | ||||
Socialist Equality Party | 1,656 | 0.05 | +0.03 | ||||
Citizens Electoral Council | 922 | 0.03 | −0.24 | ||||
Christian Democratic Party | 632 | 0.02 | −0.02 | ||||
Australia First Party | 295 | 0.01 | +0.01 | ||||
Others | 516 | 0.02 | +0.00 | ||||
Total | 3,180,184 | 37 | |||||
Two-party-preferred vote | |||||||
Australian Labor Party | 1,758,982 | 55.31 | +1.04 | 22 | 1 | ||
Liberal/National Coalition | 1,421,202 | 44.69 | –1.04 | 14 | 2 | ||
Invalid/blank votes | 149,699 | 4.50 | +1.25 | ||||
Registered voters/turnout | 3,561,873 | 93.49 | |||||
Source: Commonwealth Election 2010 |
Party | Votes | % | Swing | Seats | Change | |
---|---|---|---|---|---|---|
Liberal National Party | 1,130,525 | 47.42 | +2.95 | 21 | 8 | |
Australian Labor Party | 800,712 | 33.58 | –9.33 | 8 | 7 | |
Australian Greens | 260,471 | 10.92 | +5.29 | |||
Family First Party | 92,794 | 3.89 | +1.62 | |||
Independents | 83,310 | 3.49 | +0.50 | 1 [lower-alpha 2] | ||
Liberal Democratic Party | 4,662 | 0.20 | +0.05 | |||
Democratic Labor Party | 4,590 | 0.19 | +0.19 | |||
One Nation | 3,921 | 0.16 | −0.20 | |||
Citizens Electoral Council | 1,462 | 0.06 | −0.09 | |||
Socialist Alliance | 717 | 0.03 | −0.02 | |||
Secular Party of Australia | 414 | 0.02 | +0.02 | |||
Others | 601 | 0.03 | +0.03 | |||
Total | 2,384,179 | 30 | 1 [lower-alpha 5] | |||
Two-party-preferred vote | ||||||
Liberal National Party | 1,314,675 | 55.14 | +5.58 | 21 | 8 | |
Australian Labor Party | 1,069,504 | 44.86 | –5.58 | 8 | 7 | |
Invalid/blank votes | 137,395 | 5.45 | +1.89 | |||
Registered voters/turnout | 2,719,360 | 92.73 | ||||
Source: Commonwealth Election 2010 |
Party | Votes | % | Swing | Seats | Change | |
---|---|---|---|---|---|---|
Liberal | 566,145 | 47.02 | +0.71 | 11 | ||
Labor | 375,381 | 31.18 | –5.62 | 3 | 1 | |
Greens | 158,117 | 13.13 | +4.20 | |||
National [lower-alpha 3] | 43,101 | 3.58 | +2.44 | 1 | 1 | |
Christian Democrats | 27,833 | 2.31 | +0.20 | |||
Family First | 20,698 | 1.72 | +0.51 | |||
Independents | 5,079 | 0.42 | –1.27 | |||
Sex Party | 2,060 | 0.17 | +0.17 | |||
One Nation | 1,471 | 0.12 | −1.03 | |||
Socialist Alliance | 1,280 | 0.11 | +0.01 | |||
Citizens Electoral Council | 1,277 | 0.11 | −0.15 | |||
Democratic Labour | 622 | 0.05 | +0.05 | |||
Climate Sceptics | 539 | 0.04 | +0.04 | |||
Socialist Equality | 398 | 0.03 | +0.02 | |||
Total | 1,204,001 | 15 | ||||
Two-party-preferred vote | ||||||
Liberal | 679,140 | 56.41 | +3.15 | 11 | ||
Labor | 524,861 | 43.59 | –3.15 | 3 | 1 | |
Invalid/blank votes | 60,967 | 4.82 | +0.97 | |||
Registered voters/turnout | 1,362,534 | 92.84 | ||||
Source: Commonwealth Election 2010 |
Party | Votes | % | Swing | Seats | Change | |
---|---|---|---|---|---|---|
Australian Labor Party | 399,279 | 40.74 | –2.44 | 6 | ||
Liberal | 394,003 | 40.21 | –1.55 | 5 | ||
Australian Greens | 117,364 | 11.98 | +5.03 | |||
Family First Party | 48,638 | 4.96 | +0.91 | |||
Australian Democrats | 7,020 | 0.72 | −0.79 | |||
Independents | 5,086 | 0.52 | –0.18 | |||
The Climate Sceptics | 3,525 | 0.36 | +0.36 | |||
Liberal Democratic Party | 2,833 | 0.29 | +0.12 | |||
One Nation | 1,105 | 0.11 | −0.06 | |||
Socialist Alliance | 786 | 0.08 | +0.08 | |||
Secular Party of Australia | 310 | 0.03 | +0.03 | |||
Total | 979,949 | 11 | ||||
Two-party-preferred vote | ||||||
Australian Labor Party | 521,115 | 53.18 | +0.78 | 6 | ||
Liberal | 458,834 | 46.82 | –0.78 | 5 | ||
Invalid/blank votes | 56,565 | 5.46 | +1.68 | |||
Registered voters/turnout | 1,104,698 | 93.83 | ||||
Source: Commonwealth Election 2010 |
Party | Votes | % | Swing | Seats | Change | |
---|---|---|---|---|---|---|
Australian Labor Party | 143,796 | 43.95 | +1.18 | 4 | 1 | |
Liberal | 109,908 | 33.60 | –4.62 | 0 | ||
Australian Greens | 55,042 | 16.82 | +3.32 | |||
Independents | 15,627 | 4.78 | +2.56 | 1 [lower-alpha 2] | 1 | |
Secular Party of Australia | 1,085 | 0.33 | +0.33 | |||
Socialist Alliance | 856 | 0.26 | +0.00 | |||
Citizens Electoral Council | 838 | 0.26 | −0.31 | |||
Total | 327,152 | 5 | ||||
Two-party-preferred vote | ||||||
Australian Labor Party | 198,332 | 60.62 | +4.41 | 4 | 1 | |
Liberal | 128,830 | 39.38 | –4.41 | 0 | ||
Invalid/blank votes | 13,791 | 4.04 | +1.12 | |||
Registered voters/turnout | 358,609 | 95.07 | ||||
Source: Commonwealth Election 2010 |
Party | Votes | % | Swing | Seats | Change | |
---|---|---|---|---|---|---|
Australian Labor Party | 100,700 | 45.02 | –6.08 | 2 | ||
Liberal | 77,880 | 34.81 | +1.58 | 0 | ||
Australian Greens | 42,942 | 19.20 | +6.04 | |||
Secular Party of Australia | 2,175 | 0.97 | +0.97 | |||
Total | 223,697 | 2 | ||||
Two-party-preferred vote | ||||||
Australian Labor Party | 137,948 | 61.67 | –1.73 | 2 | ||
Liberal | 85,749 | 38.33 | +1.73 | 0 | ||
Invalid/blank votes | 10,926 | 4.66 | +2.35 | |||
Registered voters/turnout | 247,941 | 94.63 | ||||
Source: Commonwealth Election 2010 |
Party | Votes | % | Swing | Seats | Change | |
---|---|---|---|---|---|---|
Country Liberal Party | 38,335 | 40.83 | –0.20 | 1 | 1 | |
Australian Labor Party | 35,589 | 37.91 | –9.74 | 1 | 1 | |
Australian Greens | 12,175 | 12.97 | +4.92 | |||
Independents | 3,948 | 4.21 | +1.55 | |||
Citizens Electoral Council | 2,331 | 2.48 | +2.23 | |||
One Nation | 1,505 | 1.60 | +1.60 | |||
Total | 93,883 | 2 | ||||
Two-party-preferred vote | ||||||
Australian Labor Party | 47,636 | 50.74 | –4.67 | 1 | 1 | |
Country Liberal Party | 46,247 | 49.26 | +4.67 | 1 | 1 | |
Invalid/blank votes | 6,198 | 6.19 | +2.34 | |||
Registered voters/turnout | 121,059 | 82.67 | ||||
Source: Commonwealth Election 2010 |
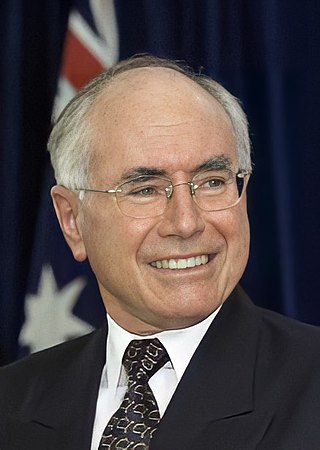
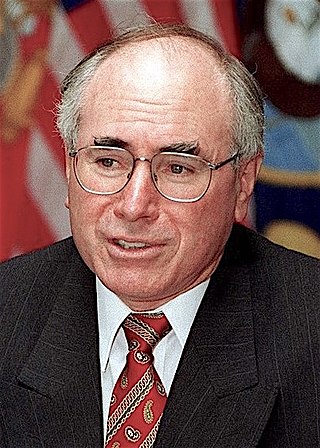
The 2001 Australian federal election was held in Australia on 10 November 2001. All 150 seats in the House of Representatives and 40 seats in the 76-member Senate were up for election. The incumbent Liberal Party of Australia led by Prime Minister of Australia John Howard and coalition partner the National Party of Australia led by John Anderson defeated the opposition Australian Labor Party led by Kim Beazley.
The 1998 Australian federal election was held to determine the members of the 39th Parliament of Australia. It was held on 3 October 1998. All 148 seats of the House of Representatives and 40 seats of the 76-seat Senate were up for election. The incumbent centre-right Liberal/National Coalition government led by Prime Minister John Howard of the Liberal Party and coalition partner Tim Fischer of the National Party defeated the centre-left Australian Labor Party opposition led by Opposition Leader Kim Beazley, despite losing the nationwide popular and two-party preferred vote.
The 2004 Australian federal election was held in Australia on 9 October 2004. All 150 seats in the House of Representatives and 40 seats in the 76-member Senate were up for election. The incumbent Liberal Party of Australia led by Prime Minister of Australia John Howard and coalition partner the National Party of Australia led by John Anderson defeated the opposition Australian Labor Party led by Mark Latham.
The 1996 Australian federal election was held to determine the members of the 38th Parliament of Australia. It was held on 2 March 1996. All 148 seats of the House of Representatives and 40 seats of the 76-seat Senate were up for election. The centre-right Liberal/National Coalition led by Opposition Leader John Howard of the Liberal Party and coalition partner Tim Fischer of the National Party defeated the incumbent centre-left Australian Labor Party government led by Prime Minister Paul Keating in a landslide victory. The Coalition won 94 seats in the House of Representatives, which is the largest number of seats held by a federal government to date.
The 1990 Australian federal election was held in Australia on 24 March 1990. All 148 seats in the House of Representatives and 40 seats in the 76-member Senate were up for election. The incumbent Australian Labor Party led by Bob Hawke defeated the opposition Liberal Party of Australia led by Andrew Peacock with coalition partner the National Party of Australia led by Charles Blunt despite losing the nationwide popular and two-party-preferred vote. The election saw the reelection of a Hawke government, the fourth successive term.
The 1987 Australian federal election was held in Australia on 11 July 1987, following the granting of a double dissolution on 5 June by the Governor-General Sir Ninian Stephen. Consequently, all 148 seats in the House of Representatives as well as all 76 seats in the Senate were up for election. The incumbent Australian Labor Party, led by Prime Minister Bob Hawke, defeated the opposition Liberal Party of Australia, led by John Howard and the National Party of Australia led by Ian Sinclair. This was the first, and to date only, time the Labor Party won a third consecutive election.
In Australian politics, the two-party-preferred vote is the result of an election or opinion poll after preferences have been distributed to the highest two candidates, who in some cases can be independents. For the purposes of TPP, the Liberal/National Coalition is usually considered a single party, with Labor being the other major party. Typically the TPP is expressed as the percentages of votes attracted by each of the two major parties, e.g. "Coalition 50%, Labor 50%", where the values include both primary votes and preferences. The TPP is an indicator of how much swing has been attained/is required to change the result, taking into consideration preferences, which may have a significant effect on the result.
The Climate Change Coalition (CCC), briefly known as 4Change, was an Australian political party, which was formed in 2007 with a view to accelerate action by politicians from all parties on global warming and climate change. Its position on working towards addressing climate change stressed cooperation with big business in order to achieve significant progress on the issue. The party therefore advocated a close working relationship between environmentalists and the business community. The CCC was registered as a political party with the Australian Electoral Commission (AEC) on 4 September 2007 and deregistered on 25 March 2010.
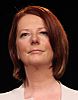
The 2010 Australian federal election was held on Saturday, 21 August 2010 to elect members of the 43rd Parliament of Australia. The incumbent centre-left Australian Labor Party led by Prime Minister Julia Gillard won a second term against the opposition centre-right Liberal Party of Australia led by Opposition Leader Tony Abbott and Coalition partner the National Party of Australia, led by Warren Truss, after Labor formed a minority government with the support of three independent MPs and one Australian Greens MP.
The following tables show state-by-state results in the Australian House of Representatives at the 2007 federal election, 83 Labor, 65 coalition, 2 independent. Detailed results for all 150 seats are also available. The Nationals were reduced to nine seats and the coalition to 64 when independent Rob Oakeshott won the 2008 Lyne by-election.
The following tables show state-by-state results in the Australian Senate at the 2007 federal election, 37 Coalition, 32 Labor, five Green, one Family First, and one independent, Nick Xenophon. Senators are elected for six-year terms, and took their seats from 1 July 2008, but senators representing the territories have three-year terms and take their seats immediately.
How-to-vote cards (HTV) are small leaflets that are handed out by party supporters during elections in Australia. Voting in the Australian lower house uses a preferential voting system. Voters must rank every candidate on the ballot in order for their vote to count. There are often numerous candidates on the ballot, some with little public profile, so voters may find it difficult to decide on all of them. Parties produce how-to-vote cards ostensibly to help voters. They contain details about the candidate or party as well as instruction how to cast a ranked vote in the order that the party would prefer the voter follow. The flow of preferences can assist the party dispersing the cards directly and indirectly help allied parties.
Elections to the 55th Parliament of New South Wales were held on Saturday, 26 March 2011. The 16-year-incumbent Labor Party government led by Premier Kristina Keneally was defeated in a landslide by the Liberal–National Coalition opposition led by Barry O'Farrell.
The 2013 Australian federal election to elect the members of the 44th Parliament of Australia took place on 7 September 2013. The centre-right Liberal/National Coalition opposition led by Opposition leader Tony Abbott of the Liberal Party of Australia and Coalition partner the National Party of Australia, led by Warren Truss, defeated the incumbent centre-left Labor Party government of Prime Minister Kevin Rudd in a landslide. Labor had been in government for six years since being elected in the 2007 election. This election marked the end of the Rudd-Gillard-Rudd Labor government and the start of the 9 year long Abbott-Turnbull-Morrison Liberal-National Coalition government. Abbott was sworn in by the Governor-General, Quentin Bryce, as Australia's new Prime Minister on 18 September 2013, along with the Abbott Ministry. The 44th Parliament of Australia opened on 12 November 2013, with the members of the House of Representatives and territory senators sworn in. The state senators were sworn in by the next Governor-General Peter Cosgrove on 7 July 2014, with their six-year terms commencing on 1 July.
The following tables show state-by-state results in the Australian Senate at the 2010 federal election. Senators total 34 Coalition, 31 Labor, nine Green, one Democratic Labor Party, and one independent, Nick Xenophon. New Senators took their places from 1 July 2011.
The following tables show state-by-state results in the Australian House of Representatives at the 2013 federal election, Coalition 90, Labor 55, Australian Greens 1, Palmer United Party 1, Katter's Australian Party 1, with 2 independents.
The following tables show state-by-state results in the Australian Senate at the 2013 Australian federal election.
The 2015 Canning by-election was held for the Australian House of Representatives on Saturday 19 September from 8 am to 6 pm WST. The by-election in the seat of Canning was triggered by the death of sitting Liberal MP Don Randall on 21 July 2015.
The 2022 Australian federal election was held on Saturday 21 May 2022 to elect members of the 47th Parliament of Australia. The incumbent Liberal/National Coalition government, led by Prime Minister Scott Morrison, sought to win a fourth consecutive term in office but was defeated by the opposition Labor Party, led by Anthony Albanese. Up for election were all 151 seats in the lower house, the House of Representatives, and 40 of the 76 seats in the upper house, the Senate.
The number of seats won by each party in the Australian House of Representatives at the 2022 federal election were: Coalition 58, Labor 77, Australian Greens 4, Centre Alliance 1, Katter's Australian Party 1, and Independents 10.