Electoral district no. 5 | |
---|---|
Valimisringkond nr 5 | |
Electoral District for the Riigikogu | |
County | |
Population | 62,842 (2020) [1] |
Electorate | 51,093 (2019) |
Current Electoral District | |
Created | 1992 |
Seats | List
|
Member of the Riigikogu [2] | List
|
Electoral district no. 5 (Estonian : Valimisringkond nr 5) is one of the 12 multi-member electoral districts of the Riigikogu, the national legislature of Estonia. The district was established as electoral district no. 6 in 1992 when the Riigikogu was re-established following Estonia's independence from the Soviet Union. It was renamed electoral district no. 5 in 1995 following the re-organisation of electoral districts. It is conterminous with the counties of Hiiu, Lääne and Saare. The district currently elects six of the 101 members of the Riigikogu using the open party-list proportional representation electoral system. At the 2019 parliamentary election it had 51,093 registered electors.
Electoral district no. 5 currently elects six of the 101 members of the Riigikogu using the open party-list proportional representation electoral system. [3] [4] The allocation of seats is carried out in three stages. In the first stage, any individual candidate, regardless of whether they are a party or independent candidate, who receives more votes than the district's simple quota (Hare quota: valid votes in district/number of seats allocated to district) is elected via a personal mandate. [5] In the second stage, district mandates are allocated to parties by dividing their district votes by the district's simple quota. [5] Only parties that reach the 5% national threshold compete for district mandates and any personal mandates won by the party are subtracted from the party's district mandates. [5] Prior to 2003 if a party's surplus/remainder votes was equal to or greater than 75% of the district's simple quota it received one additional district mandate. [5] Any unallocated district seats are added to a national pool of compensatory seats. [5] In the final stage, compensatory mandates are calculated based on the national vote and using a modified D'Hondt method. [5] Only parties that reach the 5% national threshold compete for compensatory seats and any personal and district mandates won by the party are subtracted from the party's compensatory mandates. [5] Though calculated nationally, compensatory mandates are allocated at the district level.
Seats allocated to electoral district no. 5 by the National Electoral Committee of Estonia at each election was as follows:
Election | Left EÜVP/EVP/ESDTP/Õ/V | Constitution K/EÜRP/MKOE | Social Democrats SDE/RM/M | Greens EER/NJ/R | Centre K/R | Reform RE | Isamaa I/IRL/I/I\ERSP/I | Conservative People's EKRE/ERL/EME/KMÜ | ||||||||||||||||
---|---|---|---|---|---|---|---|---|---|---|---|---|---|---|---|---|---|---|---|---|---|---|---|---|
Votes | % | Seats | Votes | % | Seats | Votes | % | Seats | Votes | % | Seats | Votes | % | Seats | Votes | % | Seats | Votes | % | Seats | Votes | % | Seats | |
2019 | 13 | 0.04% | 0 | 3,414 | 10.67% | 0 | 639 | 2.00% | 0 | 5,736 | 17.93% | 1 | 9,150 | 28.60% | 1 | 3,347 | 10.46% | 0 | 6,894 | 21.55% | 1 | |||
2015 | 15 | 0.04% | 0 | 5,018 | 14.90% | 1 | 590 | 1.75% | 0 | 4,368 | 12.97% | 1 | 10,489 | 31.15% | 2 | 4,938 | 14.66% | 1 | 3,770 | 11.20% | 0 | |||
2011 | 8,187 | 24.06% | 1 | 1,820 | 5.35% | 0 | 5,155 | 15.15% | 1 | 11,134 | 32.72% | 2 | 5,595 | 16.44% | 1 | 599 | 1.76% | 0 | ||||||
2007 | 29 | 0.08% | 0 | 17 | 0.05% | 0 | 4,081 | 11.95% | 1 | 2,541 | 7.44% | 0 | 6,948 | 20.35% | 1 | 10,758 | 31.51% | 2 | 5,166 | 15.13% | 1 | 3,049 | 8.93% | 0 |
2003 | 129 | 0.40% | 0 | 109 | 0.34% | 0 | 2,433 | 7.60% | 0 | 7,455 | 23.29% | 1 | 4,807 | 15.02% | 1 | 2,065 | 6.45% | 0 | 5,384 | 16.82% | 1 | |||
1999 | 416 | 1.29% | 0 | 6,093 | 18.91% | 1 | 8,423 | 26.14% | 1 | 5,779 | 17.94% | 1 | 3,487 | 10.82% | 0 | 2,852 | 8.85% | 0 | ||||||
1995 | 774 | 2.04% | 0 | 247 | 0.65% | 0 | 3,103 | 8.17% | 0 | 185 | 0.49% | 0 | 6,343 | 16.69% | 1 | 8,497 | 22.36% | 1 | 2,245 | 5.91% | 0 | 13,595 | 35.78% | 2 |
1992 | 1,117 | 3.33% | 0 | 3,604 | 10.75% | 0 | 633 | 1.89% | 0 | 2,850 | 8.50% | 0 | 4,416 | 13.18% | 1 |
(Excludes compensatory seats)
Results of the 2019 parliamentary election held on 3 March 2019: [14] [15] [16]
Party | Votes per county | Total Votes | % | Seats | |||||||||
---|---|---|---|---|---|---|---|---|---|---|---|---|---|
Hiiu | Lääne | Saare | Over -seas | Elec -tronic | Per. | Dis. | Com. | Tot. | |||||
Estonian Reform Party | RE | 558 | 1,407 | 1,843 | 32 | 5,310 | 9,150 | 28.60% | 0 | 1 | 2 | 3 | |
Conservative People's Party of Estonia | EKRE | 545 | 1,713 | 2,263 | 55 | 2,318 | 6,894 | 21.55% | 0 | 1 | 0 | 1 | |
Estonian Centre Party | K | 506 | 1,426 | 2,105 | 12 | 1,687 | 5,736 | 17.93% | 0 | 1 | 1 | 2 | |
Social Democratic Party | SDE | 498 | 494 | 683 | 8 | 1,731 | 3,414 | 10.67% | 0 | 0 | 0 | 0 | |
Isamaa | I | 170 | 429 | 1,157 | 18 | 1,573 | 3,347 | 10.46% | 0 | 0 | 0 | 0 | |
Estonia 200 | 48 | 120 | 456 | 1 | 779 | 1,404 | 4.39% | 0 | 0 | 0 | 0 | ||
Estonian Free Party | EVA | 78 | 114 | 128 | 0 | 324 | 644 | 2.01% | 0 | 0 | 0 | 0 | |
Estonian Greens | EER | 29 | 113 | 128 | 5 | 364 | 639 | 2.00% | 0 | 0 | 0 | 0 | |
Harry Raudvere (Independent) | 29 | 62 | 187 | 0 | 128 | 406 | 1.27% | 0 | 0 | 0 | 0 | ||
Estonian Biodiversity Party | 13 | 55 | 93 | 1 | 188 | 350 | 1.09% | 0 | 0 | 0 | 0 | ||
Estonian United Left Party | EÜVP | 1 | 4 | 6 | 0 | 2 | 13 | 0.04% | 0 | 0 | 0 | 0 | |
Valid Votes | 2,475 | 5,937 | 9,049 | 132 | 14,404 | 31,997 | 100.00% | 0 | 3 | 3 | 6 | ||
Rejected Votes | 23 | 86 | 100 | 0 | 0 | 209 | 0.65% | ||||||
Total Polled | 2,498 | 6,023 | 9,149 | 132 | 14,404 | 32,206 | 63.03% | ||||||
Registered Electors | 8,016 | 15,607 | 27,068 | 402 | 51,093 |
The following candidates were elected: [16]
Results of the 2015 parliamentary election held on 1 March 2015: [17] [18] [19]
Party | Votes per county | Total Votes | % | Seats | |||||||||
---|---|---|---|---|---|---|---|---|---|---|---|---|---|
Hiiu | Lääne | Saare | Over -seas | Elec -tronic | Per. | Dis. | Com. | Tot. | |||||
Estonian Reform Party | RE | 1,147 | 2,224 | 3,092 | 21 | 4,005 | 10,489 | 31.15% | 0 | 2 | 1 | 3 | |
Social Democratic Party | SDE | 567 | 1,231 | 1,421 | 7 | 1,792 | 5,018 | 14.90% | 0 | 1 | 0 | 1 | |
Pro Patria and Res Publica Union | IRL | 439 | 1,045 | 1,782 | 30 | 1,642 | 4,938 | 14.66% | 0 | 1 | 0 | 1 | |
Estonian Centre Party | K | 420 | 1,423 | 1,953 | 6 | 566 | 4,368 | 12.97% | 0 | 1 | 0 | 1 | |
Estonian Free Party | EVA | 188 | 1,027 | 1,406 | 7 | 1,669 | 4,297 | 12.76% | 0 | 1 | 0 | 1 | |
Conservative People's Party of Estonia | EKRE | 380 | 1,215 | 1,154 | 9 | 1,012 | 3,770 | 11.20% | 0 | 0 | 0 | 0 | |
Estonian Greens | EER | 31 | 107 | 154 | 2 | 296 | 590 | 1.75% | 0 | 0 | 0 | 0 | |
Estonian Independence Party | EIP | 5 | 30 | 49 | 1 | 28 | 113 | 0.34% | 0 | 0 | 0 | 0 | |
Party of People's Unity | RÜE | 15 | 21 | 20 | 0 | 19 | 75 | 0.22% | 0 | 0 | 0 | 0 | |
Estonian United Left Party | EÜVP | 0 | 5 | 9 | 0 | 1 | 15 | 0.04% | 0 | 0 | 0 | 0 | |
Valid Votes | 3,192 | 8,328 | 11,040 | 83 | 11,030 | 33,673 | 100.00% | 0 | 6 | 1 | 7 | ||
Rejected Votes | 30 | 77 | 70 | 1 | 0 | 178 | 0.53% | ||||||
Total Polled | 3,222 | 8,405 | 11,110 | 84 | 11,030 | 33,851 | 60.41% | ||||||
Registered Electors | 8,191 | 19,657 | 28,101 | 84 | 56,033 |
The following candidates were elected: [19]
Results of the 2011 parliamentary election held on 6 March 2011: [20] [21] [22]
Party | Votes per county | Total Votes | % | Seats | |||||||||
---|---|---|---|---|---|---|---|---|---|---|---|---|---|
Hiiu | Lääne | Saare | Over -seas | Elec -tronic | Per. | Dis. | Com. | Tot. | |||||
Estonian Reform Party | RE | 1,237 | 2,742 | 3,737 | 47 | 3,371 | 11,134 | 32.72% | 0 | 2 | 1 | 3 | |
Social Democratic Party | SDE | 1,138 | 2,169 | 2,845 | 7 | 2,028 | 8,187 | 24.06% | 0 | 1 | 2 | 3 | |
Pro Patria and Res Publica Union | IRL | 489 | 1,585 | 1,708 | 56 | 1,757 | 5,595 | 16.44% | 0 | 1 | 0 | 1 | |
Estonian Centre Party | K | 424 | 1,569 | 2,566 | 4 | 592 | 5,155 | 15.15% | 0 | 1 | 0 | 1 | |
Estonian Greens | EER | 126 | 722 | 454 | 2 | 516 | 1,820 | 5.35% | 0 | 0 | 0 | 0 | |
People's Union of Estonia | ERL | 57 | 217 | 231 | 2 | 92 | 599 | 1.76% | 0 | 0 | 0 | 0 | |
Raimond Ellik (Independent) | 12 | 27 | 336 | 0 | 71 | 446 | 1.31% | 0 | 0 | 0 | 0 | ||
Party of Estonian Christian Democrats | EKD | 31 | 152 | 151 | 1 | 60 | 395 | 1.16% | 0 | 0 | 0 | 0 | |
Rein Teesalu (Independent) | 21 | 61 | 134 | 0 | 55 | 271 | 0.80% | 0 | 0 | 0 | 0 | ||
Üllar Õun (Independent) | 11 | 37 | 86 | 0 | 19 | 153 | 0.45% | 0 | 0 | 0 | 0 | ||
Estonian Independence Party | EIP | 10 | 40 | 56 | 0 | 33 | 139 | 0.41% | 0 | 0 | 0 | 0 | |
Eugen Veges (Independent) | 6 | 30 | 32 | 0 | 29 | 97 | 0.29% | 0 | 0 | 0 | 0 | ||
Russian Party in Estonia | VEE | 0 | 29 | 5 | 0 | 3 | 37 | 0.11% | 0 | 0 | 0 | 0 | |
Valid Votes | 3,562 | 9,380 | 12,341 | 119 | 8,626 | 34,028 | 100.00% | 0 | 5 | 3 | 8 | ||
Rejected Votes | 29 | 97 | 115 | 12 | 0 | 253 | 0.74% | ||||||
Total Polled | 3,591 | 9,477 | 12,456 | 131 | 8,626 | 34,281 | 58.52% | ||||||
Registered Electors | 8,491 | 20,887 | 29,074 | 131 | 58,583 |
The following candidates were elected: [22]
Results of the 2007 parliamentary election held on 4 March 2007: [23] [24] [25] [26] [27]
Party | Votes per county | Total Votes | % | Seats | |||||||||
---|---|---|---|---|---|---|---|---|---|---|---|---|---|
Hiiu | Lääne | Saare | Over -seas | Elec -tronic | Per. | Dis. | Com. | Tot. | |||||
Estonian Reform Party | RE | 1,058 | 3,692 | 5,397 | 22 | 589 | 10,758 | 31.51% | 0 | 2 | 1 | 3 | |
Estonian Centre Party | K | 661 | 2,490 | 3,673 | 13 | 111 | 6,948 | 20.35% | 0 | 1 | 0 | 1 | |
Pro Patria and Res Publica Union | IRL | 618 | 1,919 | 2,108 | 103 | 418 | 5,166 | 15.13% | 0 | 1 | 0 | 1 | |
Social Democratic Party | SDE | 1,269 | 1,387 | 1,159 | 16 | 250 | 4,081 | 11.95% | 0 | 1 | 0 | 1 | |
People's Union of Estonia | ERL | 712 | 588 | 1,662 | 4 | 83 | 3,049 | 8.93% | 0 | 0 | 0 | 0 | |
Estonian Greens | EER | 279 | 1,130 | 945 | 7 | 180 | 2,541 | 7.44% | 0 | 0 | 1 | 1 | |
Party of Estonian Christian Democrats | EKD | 132 | 392 | 860 | 4 | 48 | 1,436 | 4.21% | 0 | 0 | 0 | 0 | |
Estonian Independence Party | EIP | 5 | 40 | 44 | 0 | 4 | 93 | 0.27% | 0 | 0 | 0 | 0 | |
Estonian Left Party | EVP | 1 | 12 | 15 | 0 | 1 | 29 | 0.08% | 0 | 0 | 0 | 0 | |
Russian Party in Estonia | VEE | 2 | 11 | 7 | 0 | 0 | 20 | 0.06% | 0 | 0 | 0 | 0 | |
Constitution Party | K | 0 | 9 | 8 | 0 | 0 | 17 | 0.05% | 0 | 0 | 0 | 0 | |
Valid Votes | 4,737 | 11,670 | 15,878 | 169 | 1,684 | 34,138 | 100.00% | 0 | 5 | 2 | 7 | ||
Rejected Votes | 40 | 123 | 139 | 8 | 0 | 310 | 0.90% | ||||||
Total Polled | 4,777 | 11,793 | 16,017 | 177 | 1,684 | 34,448 | 58.77% | ||||||
Registered Electors | 8,494 | 20,961 | 28,979 | 177 | 58,611 |
The following candidates were elected: [27]
Results of the 2003 parliamentary election held on 2 March 2003: [28] [29] [30] [31] [32]
Party | Votes per county | Total Votes | % | Seats | ||||||||
---|---|---|---|---|---|---|---|---|---|---|---|---|
Hiiu | Lääne | Saare | Over -seas | Per. | Dis. | Com. | Tot. | |||||
Union for the Republic–Res Publica | ÜVE-RP | 939 | 3,872 | 3,527 | 87 | 8,425 | 26.32% | 0 | 2 | 0 | 2 | |
Estonian Centre Party | K | 938 | 2,464 | 4,039 | 14 | 7,455 | 23.29% | 0 | 1 | 0 | 1 | |
People's Union of Estonia | ERL | 310 | 1,398 | 3,670 | 6 | 5,384 | 16.82% | 0 | 1 | 0 | 1 | |
Estonian Reform Party | RE | 877 | 1,855 | 2,057 | 18 | 4,807 | 15.02% | 0 | 1 | 0 | 1 | |
Moderate People's Party | RM | 1,372 | 602 | 445 | 14 | 2,433 | 7.60% | 0 | 0 | 0 | 0 | |
Pro Patria Union Party | I | 226 | 831 | 934 | 74 | 2,065 | 6.45% | 0 | 0 | 0 | 0 | |
Estonian Christian People's Party | EKRP | 44 | 279 | 507 | 4 | 834 | 2.61% | 0 | 0 | 0 | 0 | |
Estonian Independence Party | EIP | 19 | 68 | 163 | 0 | 250 | 0.78% | 0 | 0 | 0 | 0 | |
Estonian Social Democratic Labour Party | ESDTP | 8 | 28 | 93 | 0 | 129 | 0.40% | 0 | 0 | 0 | 0 | |
Estonian United People's Party | EÜRP | 5 | 102 | 2 | 0 | 109 | 0.34% | 0 | 0 | 0 | 0 | |
Eino Paju (Independent) | 5 | 30 | 50 | 0 | 85 | 0.27% | 0 | 0 | 0 | 0 | ||
Russian Party in Estonia | VEE | 1 | 25 | 9 | 0 | 35 | 0.11% | 0 | 0 | 0 | 0 | |
Valid Votes | 4,744 | 11,554 | 15,496 | 217 | 32,011 | 100.00% | 0 | 5 | 0 | 5 | ||
Rejected Votes | 36 | 122 | 150 | 8 | 316 | 0.98% | ||||||
Total Polled | 4,780 | 11,676 | 15,646 | 225 | 32,327 | 55.09% | ||||||
Registered Electors | 8,516 | 21,044 | 28,895 | 225 | 58,680 | |||||||
Turnout | 56.13% | 55.48% | 54.15% | 100.00% | 55.09% |
The following candidates were elected: [32]
Results of the 1999 parliamentary election held on 7 March 1999: [33] [34] [35] [36] [37]
Party | Votes per county | Total Votes | % | Seats | ||||||||
---|---|---|---|---|---|---|---|---|---|---|---|---|
Hiiu | Lääne | Saare | Over -seas | Per. | Dis. | Com. | Tot. | |||||
Estonian Centre Party | K | 738 | 2,829 | 4,847 | 9 | 8,423 | 26.14% | 0 | 1 | 1 | 2 | |
Moderate | M | 1,860 | 1,898 | 2,247 | 88 | 6,093 | 18.91% | 0 | 1 | 1 | 2 | |
Estonian Reform Party | RE | 765 | 2,789 | 2,207 | 18 | 5,779 | 17.94% | 0 | 1 | 0 | 1 | |
Pro Patria Union | I | 469 | 1,369 | 1,387 | 262 | 3,487 | 10.82% | 0 | 0 | 1 | 1 | |
Estonian Coalition Party | KE | 355 | 768 | 1,803 | 13 | 2,939 | 9.12% | 0 | 0 | 0 | 0 | |
Estonian Country People's Party | EME | 132 | 953 | 1,765 | 2 | 2,852 | 8.85% | 0 | 0 | 1 | 1 | |
Estonian Christian People's Party | EKRP | 106 | 577 | 710 | 9 | 1,402 | 4.35% | 0 | 0 | 0 | 0 | |
Estonian United People's Party | EÜRP | 156 | 134 | 126 | 0 | 416 | 1.29% | 0 | 0 | 0 | 0 | |
Estonian Blue Party | ESE | 49 | 90 | 235 | 3 | 377 | 1.17% | 0 | 0 | 0 | 0 | |
Russian Party in Estonia | VEE | 47 | 85 | 17 | 0 | 149 | 0.46% | 0 | 0 | 0 | 0 | |
Farmers' Assembly | 11 | 30 | 75 | 6 | 122 | 0.38% | 0 | 0 | 0 | 0 | ||
Eino Paju (Independent) | 6 | 15 | 53 | 0 | 74 | 0.23% | 0 | 0 | 0 | 0 | ||
Ilmar Altvälja (Independent) | 9 | 37 | 13 | 4 | 63 | 0.20% | 0 | 0 | 0 | 0 | ||
Progress Party | 18 | 5 | 22 | 0 | 45 | 0.14% | 0 | 0 | 0 | 0 | ||
Valid Votes | 4,721 | 11,579 | 15,507 | 414 | 32,221 | 100.00% | 0 | 3 | 4 | 7 | ||
Rejected Votes | 75 | 185 | 244 | 6 | 510 | 1.56% | ||||||
Total Polled | 4,796 | 11,764 | 15,751 | 420 | 32,731 | 54.85% | ||||||
Registered Electors | 8,438 | 21,342 | 29,472 | 420 | 59,672 | |||||||
Turnout | 56.84% | 55.12% | 53.44% | 100.00% | 54.85% |
The following candidates were elected: [37]
Results of the 1995 parliamentary election held on 5 March 1995: [38] [39] [40] [41] [42]
Party | Votes per county | Total Votes | % | Seats | ||||||||
---|---|---|---|---|---|---|---|---|---|---|---|---|
Hiiu | Lääne | Saare | Over -seas | Per. | Dis. | Com. | Tot. | |||||
Coalition Party and Rural People's Association | KMÜ | 2,149 | 3,361 | 8,029 | 56 | 13,595 | 35.78% | 0 | 2 | 0 | 2 | |
Estonian Reform Party | RE | 1,271 | 4,327 | 2,825 | 74 | 8,497 | 22.36% | 1 | 0 | 2 | 3 | |
Estonian Centre Party | K | 689 | 1,916 | 3,718 | 20 | 6,343 | 16.69% | 0 | 1 | 0 | 1 | |
Moderate | M | 282 | 785 | 1,983 | 53 | 3,103 | 8.17% | 0 | 0 | 0 | 0 | |
Pro Patria and ERSP Union | I\ERSP | 482 | 720 | 594 | 449 | 2,245 | 5.91% | 0 | 0 | 0 | 0 | |
Justice | Õ | 431 | 135 | 206 | 2 | 774 | 2.04% | 0 | 0 | 0 | 0 | |
The Right Wingers | P | 81 | 371 | 232 | 56 | 740 | 1.95% | 0 | 0 | 0 | 0 | |
Better Estonia/Estonian Citizen | PE/EK | 57 | 190 | 476 | 9 | 732 | 1.93% | 0 | 0 | 0 | 0 | |
Estonian Farmers' Party | ETRE | 123 | 426 | 80 | 1 | 630 | 1.66% | 0 | 0 | 0 | 0 | |
Estonian Future Party | TEE | 51 | 185 | 280 | 4 | 520 | 1.37% | 0 | 0 | 0 | 0 | |
Our Home is Estonia | MKOE | 18 | 194 | 33 | 2 | 247 | 0.65% | 0 | 0 | 0 | 0 | |
Fourth Force | NJ | 66 | 63 | 53 | 3 | 185 | 0.49% | 0 | 0 | 0 | 0 | |
Forest Party | 24 | 76 | 55 | 4 | 159 | 0.42% | 0 | 0 | 0 | 0 | ||
Estonian National Federation | ERKL | 14 | 33 | 89 | 0 | 136 | 0.36% | 0 | 0 | 0 | 0 | |
Blue Party | SE | 8 | 12 | 41 | 2 | 63 | 0.17% | 0 | 0 | 0 | 0 | |
Estonian Democratic Union | EDL | 7 | 16 | 8 | 0 | 31 | 0.08% | 0 | 0 | 0 | 0 | |
Valid Votes | 5,753 | 12,810 | 18,702 | 735 | 38,000 | 100.00% | 1 | 3 | 2 | 6 | ||
Rejected Votes | 51 | 109 | 157 | 0 | 317 | 0.83% | ||||||
Total Polled | 5,804 | 12,919 | 18,859 | 735 | 38,317 | 68.15% | ||||||
Registered Electors | 8,184 | 19,129 | 28,177 | 735 | 56,225 | |||||||
Turnout | 70.92% | 67.54% | 66.93% | 100.00% | 68.15% |
The following candidates were elected: [42]
Results of the 1992 parliamentary election held on 20 September 1992: [43] [44] [45] [46] [47]
Party | Votes per county | Total Votes | % | Seats | ||||||||
---|---|---|---|---|---|---|---|---|---|---|---|---|
Hiiu | Lääne | Saare | Over -seas | Per. | Dis. | Com. | Tot. | |||||
Independent Kings | SK | 993 | 1,868 | 3,859 | 9 | 6,729 | 20.08% | 1 | 0 | 0 | 1 | |
Pro Patria | I | 562 | 2,016 | 1,401 | 437 | 4,416 | 13.18% | 0 | 1 | 1 | 2 | |
Moderate | M | 1,258 | 323 | 1,986 | 37 | 3,604 | 10.75% | 0 | 0 | 1 | 1 | |
Ülo Uluots (Independent) | 109 | 2,895 | 378 | 16 | 3,398 | 10.14% | 0 | 0 | 0 | 0 | ||
Safe Home | KK | 485 | 1,502 | 1,191 | 42 | 3,220 | 9.61% | 0 | 0 | 1 | 1 | |
Popular Front of Estonia | R | 315 | 420 | 2,086 | 29 | 2,850 | 8.50% | 0 | 0 | 1 | 1 | |
Estonian National Independence Party | ERSP | 164 | 432 | 1,688 | 297 | 2,581 | 7.70% | 0 | 0 | 0 | 0 | |
Farmers' Assembly | 83 | 209 | 1,215 | 55 | 1,562 | 4.66% | 0 | 0 | 0 | 0 | ||
Left Option | V | 299 | 152 | 664 | 2 | 1,117 | 3.33% | 0 | 0 | 0 | 0 | |
Estonian Union of Pensioners | EPL | 97 | 516 | 481 | 6 | 1,100 | 3.28% | 0 | 0 | 0 | 0 | |
Estonian Citizen | EK | 70 | 243 | 476 | 19 | 808 | 2.41% | 0 | 0 | 2 | 2 | |
Greens | R | 123 | 192 | 300 | 18 | 633 | 1.89% | 0 | 0 | 0 | 0 | |
Handicapped Union | 62 | 198 | 186 | 0 | 446 | 1.33% | 0 | 0 | 0 | 0 | ||
Estonian Entrepreneurs' Party | EEE | 90 | 70 | 148 | 6 | 314 | 0.94% | 0 | 0 | 0 | 0 | |
Aarne Maripuu (Independent) | 207 | 26 | 63 | 5 | 301 | 0.90% | 0 | 0 | 0 | 0 | ||
National Party of the Illegally Repressed | ÕRRE | 9 | 149 | 94 | 10 | 262 | 0.78% | 0 | 0 | 0 | 0 | |
Arnold-Aare Kivisikk (Independent) | 127 | 20 | 29 | 0 | 176 | 0.53% | 0 | 0 | 0 | 0 | ||
Valid Votes | 5,053 | 11,231 | 16,245 | 988 | 33,517 | 100.00% | 1 | 1 | 6 | 8 | ||
Rejected Votes | 117 | 229 | 374 | 0 | 720 | 2.10% | ||||||
Total Polled | 5,170 | 11,460 | 16,619 | 988 | 34,237 | 65.48% | ||||||
Registered Electors | 7,715 | 17,697 | 25,855 | 1,018 | 52,285 | |||||||
Turnout | 67.01% | 64.76% | 64.28% | 97.05% | 65.48% |
The following candidates were elected: [47]
Indrek Saar is an Estonian actor and politician, leader of the Social Democratic Party, and former Minister of Culture.
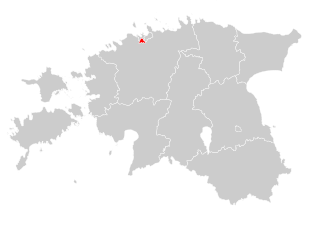
Electoral district no. 1 is one of the 12 multi-member electoral districts of the Riigikogu, the national legislature of Estonia. The electoral district was established in 1995 following the re-organisation of the electoral districts in Tallinn. It is conterminous with the districts of Haabersti, Kristiine and Põhja-Tallinn in Tallinn. The district currently elects 10 of the 101 members of the Riigikogu using the open party-list proportional representation electoral system. At the 2019 parliamentary election it had 85,469 registered electors.
Electoral district no. 2 is one of the 12 multi-member electoral districts of the Riigikogu, the national legislature of Estonia. The electoral district was established in 1995 following the re-organisation of the electoral districts in Tallinn. It is conterminous with the districts of Kesklinn, Lasnamäe and Pirita in Tallinn. The district currently elects 13 of the 101 members of the Riigikogu using the open party-list proportional representation electoral system. At the 2019 parliamentary election it had 111,135 registered electors.
Electoral district no. 3 is one of the 12 multi-member electoral districts of the Riigikogu, the national legislature of Estonia. The electoral district was established in 1995 following the re-organisation of the electoral districts in Tallinn. It is conterminous with the districts of Mustamäe and Nõmme in Tallinn. The district currently elects eight of the 101 members of the Riigikogu using the open party-list proportional representation electoral system. At the 2019 parliamentary election it had 71,882 registered electors.
Electoral district no. 4 is one of the 12 multi-member electoral districts of the Riigikogu, the national legislature of Estonia. The district was established as electoral district no. 5 in 1992 when the Riigikogu was re-established following Estonia's independence from the Soviet Union. It was renamed electoral district no. 4 in 1995 following the re-organisation of electoral districts. It is conterminous with the counties of Harju and Rapla. The district currently elects 15 of the 101 members of the Riigikogu using the open party-list proportional representation electoral system. At the 2019 parliamentary election it had 133,437 registered electors.
Electoral district no. 6 is one of the 12 multi-member electoral districts of the Riigikogu, the national legislature of Estonia. The district was established in 2003 when the existing electoral district no. 6 was split into two. It is conterminous with the county of Lääne-Viru. The district currently elects five of the 101 members of the Riigikogu using the open party-list proportional representation electoral system. At the 2019 parliamentary election it had 44,583 registered electors.
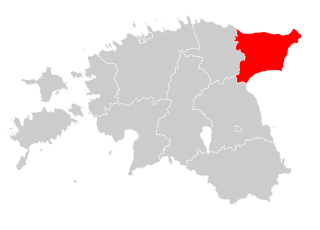
Electoral district no. 7 is one of the 12 multi-member electoral districts of the Riigikogu, the national legislature of Estonia. Established in 1992 when the Riigikogu was re-established following Estonia's independence from the Soviet Union, the district was abolished in 1995 following the re-organisation of electoral districts only to be re-established in 2003. It is conterminous with the county of Ida-Viru. The district currently elects seven of the 101 members of the Riigikogu using the open party-list proportional representation electoral system. At the 2019 parliamentary election it had 56,836 registered electors.
Electoral district no. 8 is one of the 12 multi-member electoral districts of the Riigikogu, the national legislature of Estonia. The district was established as electoral district no. 7 in 1995 following the re-organisation of electoral districts. It was renamed electoral district no. 8 in 2003 following another re-organisation of electoral districts. It is conterminous with the counties of Järva and Viljandi. The district currently elects seven of the 101 members of the Riigikogu using the open party-list proportional representation electoral system. At the 2019 parliamentary election it had 61,657 registered electors.
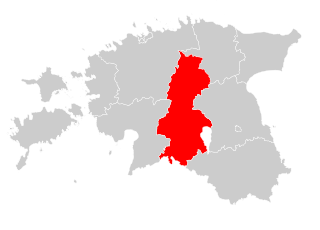
Electoral district no. 9 is one of the 12 multi-member electoral districts of the Riigikogu, the national legislature of Estonia. The district was established as electoral district no. 8 in 1995 following the re-organisation of electoral districts. It was renamed electoral district no. 9 in 2003 following another re-organisation of electoral districts. It is conterminous with the counties of Jõgeva and Tartu. The district currently elects seven of the 101 members of the Riigikogu using the open party-list proportional representation electoral system. At the 2019 parliamentary election it had 65,898 registered electors.
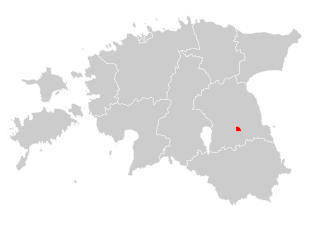
Electoral district no. 10 is one of the 12 multi-member electoral districts of the Riigikogu, the national legislature of Estonia. The district was established as electoral district no. 9 in 1995 following the re-organisation of electoral districts. It was renamed electoral district no. 10 in 2003 following another re-organisation of electoral districts. It is conterminous with the municipality of Tartu. The district currently elects eight of the 101 members of the Riigikogu using the open party-list proportional representation electoral system. At the 2019 parliamentary election it had 67,525 registered electors.
Electoral district no. 11 is one of the 12 multi-member electoral districts of the Riigikogu, the national legislature of Estonia. The district was established in 1992 when the Riigikogu was re-established following Estonia's independence from the Soviet Union. It was renamed electoral district no. 10 in 1995 following the re-organisation of electoral districts but reverted to electoral district no. 11 in 2003. It is conterminous with the counties of Põlva, Valga and Võru. The district currently elects eight of the 101 members of the Riigikogu using the open party-list proportional representation electoral system. At the 2019 parliamentary election it had 70,706 registered electors.
Electoral district no. 12 is one of the 12 multi-member electoral districts of the Riigikogu, the national legislature of Estonia. The district was established in 1992 when the Riigikogu was re-established following Estonia's independence from the Soviet Union. It was renamed electoral district no. 11 in 1995 following the re-organisation of electoral districts but reverted to electoral district no. 12 in 2003. It is conterminous with the county of Pärnu. The district currently elects seven of the 101 members of the Riigikogu using the open party-list proportional representation electoral system. At the 2019 parliamentary election it had 66,852 registered electors.
Electoral district no. 6 was one of the multi-member electoral districts of the Riigikogu, the national legislature of Estonia. The district was established in 1995 following the re-organisation of electoral districts. It was abolished in 2003. It was conterminous with the counties of Ida-Viru and Lääne-Viru.
Electoral district no. 1 was one of the multi-member electoral districts of the Riigikogu, the national legislature of Estonia. The district was established in 1992 when the Riigikogu was re-established following Estonia's independence from the Soviet Union. It was abolished in 1995. It covered south Tallinn.
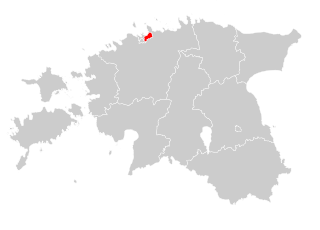
Electoral district no. 2 was one of the multi-member electoral districts of the Riigikogu, the national legislature of Estonia. The district was established in 1992 when the Riigikogu was re-established following Estonia's independence from the Soviet Union. It was abolished in 1995. It covered north Tallinn.
Electoral district no. 3 was one of the multi-member electoral districts of the Riigikogu, the national legislature of Estonia. The district was established in 1992 when the Riigikogu was re-established following Estonia's independence from the Soviet Union. It was abolished in 1995. It covered west Tallinn.
Electoral district no. 4 was one of the multi-member electoral districts of the Riigikogu, the national legislature of Estonia. The district was established in 1992 when the Riigikogu was re-established following Estonia's independence from the Soviet Union. It was abolished in 1995. It covered east Tallinn.
Electoral district no. 8 was one of the multi-member electoral districts of the Riigikogu, the national legislature of Estonia. The district was established in 1992 when the Riigikogu was re-established following Estonia's independence from the Soviet Union. It was abolished in 1995. It was conterminous with the counties of Järva and Lääne-Viru.
Electoral district no. 9 was one of the multi-member electoral districts of the Riigikogu, the national legislature of Estonia. The district was established in 1992 when the Riigikogu was re-established following Estonia's independence from the Soviet Union. It was abolished in 1995. It was conterminous with the counties of Jõgeva and Viljandi.
Electoral district no. 10 was one of the multi-member electoral districts of the Riigikogu, the national legislature of Estonia. The district was established in 1992 when the Riigikogu was re-established following Estonia's independence from the Soviet Union. It was abolished in 1995. It was conterminous with the county of Tartu.