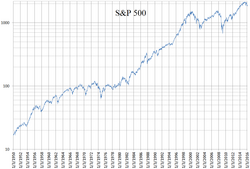
A linear chart of the S&P 500 daily closing values from January 3, 1950, to February 19, 2016
A logarithmic chart of the S&P 500 index daily closing values from January 3, 1950, to February 19, 2016
A daily volume chart of the S&P 500 index from January 3, 1950, to February 19, 2016
Though there is large variability in month-to-month changes in the S&P 500 (gray lines), a seasonal pattern emerges when the monthly change values are averaged (bold line).S&P 500 Max Min Chart to Jan 2025 with Trend, with plots less Inflation, and comparison plots
S&P 500 (Standard and Poor's 500)[6] is a stock market index tracking the stock performance of 500 leading companies listed on stock exchanges in the United States. It is one of the most commonly followed equity indices and includes approximately 80% of the total market capitalization of U.S. public companies, with an aggregate market cap of more than $61.1 trillion as of December 31, 2025.[2]
The S&P 500 index is a public float weighted/capitalization-weighted index. The ten largest companies on the list of S&P 500 companies account for approximately 38% of the market capitalization of the index and the 50 largest components account for 60% of the index. As of January 2026, the 10 largest components are, in order of highest to lowest weighting: Nvidia (7.17%), Alphabet (6.39%, including both class A & C shares), Apple (5.86%), Microsoft (5.33%), Amazon (3.98%), Broadcom (2.51%), Meta Platforms (2.49%), Tesla (2.31%), Berkshire Hathaway (1.68%), and Lilly (Eli) (1.55%).[4] The components that have increased their dividends in 25 consecutive years are known as the S&P 500 Dividend Aristocrats.[7] Companies in the S&P 500 derive a collective 72% of revenues from the United States and 28% from other countries.[8]
In 1860, Henry Varnum Poor formed Poor's Publishing, which published an investor's guide to the railroad industry.[16] In 1923, Standard Statistics Company (founded in 1906 as the Standard Statistics Bureau) began rating mortgage bonds[16] and developed its first stock market index consisting of the stocks of 233 U.S. companies, computed weekly.[1] Three years later, it developed a 90-stock index, computed daily.[1] In 1941, Poor's Publishing merged with Standard Statistics Company to form Standard & Poor's.[16][17]
On Monday, March 4, 1957, the index was expanded to its current extent of 500 companies and was renamed the S&P 500 Stock Composite Index.[1] In 1962, Ultronic Systems became the compiler of the S&P indices including the S&P 500 Stock Composite Index, the 425 Stock Industrial Index, the 50 Stock Utility Index, and the 25 Stock Rail Index.[18] On August 31, 1976, The Vanguard Group offered the first mutual fund to retail investors that tracked the index.[1] On April 21, 1982, the Chicago Mercantile Exchange began trading futures based on the index.[1] On July 1, 1983, Chicago Board Options Exchange began trading options based on the index.[1] Beginning in 1986, the index value was updated every 15 seconds, or 1,559 times per trading day, with price updates disseminated by Reuters. Prior to this, it had been updated once every minute.[19]
On January 22, 1993, the Standard & Poor's Depositary Receipts exchange-traded fund issued by State Street Corporation began trading.[1] On September 9, 1997, CME Group introduced the S&P E-mini futures contract.[1] In 2005, the index transitioned to a public float-adjusted capitalization-weighting.[20] Friday, September 17, 2021, was the final trading date for the original SP big contract which began trading in 1982.[21]
Selection criteria
Like other indices managed by S&P Dow Jones Indices, but unlike indices such as the Russell 1000 Index which are strictly rule-based, the components of the S&P 500 are selected by a committee. When considering the eligibility of a new addition, the committee assesses the company's merit using the following primary criteria:[3]
Market capitalization - Market capitalization must be greater than or equal to US$22.7 billion (effective on July 1, 2025).[22] These market cap eligibility criteria are for addition to an index, not for continued membership. As a result, an index constituent that appears to violate criteria for addition to that index is not removed unless ongoing conditions warrant an index change.[22]
A stock may rise in value when it is added to the index since index funds must purchase that stock to continue tracking the index.[25][26]
A study published by the National Bureau of Economic Research in October 2021 alleged that companies' purchases of ratings services from S&P Global appear to improve their chance of entering the S&P 500, even if they are not the best fit per the rules.[27][28]
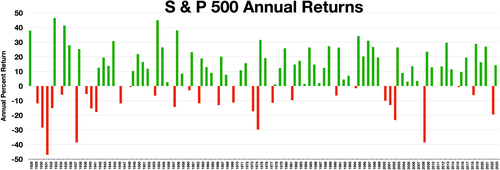
Since its inception in 1926, the index's compound annual growth rate—including dividends—has been approximately 9.8% (6% after inflation), with the standard deviation of the return, calculated on a monthly basis, over the same time period being 20.81%. While the index has declined in several years by over 30%,[29] it has posted annual increases 70% of the time,[30] with 5% of all trading days resulting in record highs.[31]
Returns are generally quoted as price returns (excluding returns from dividends). However, they can also be quoted as total return, which includes returns from dividends and the reinvestment thereof, and "net total return", which reflects the effects of dividend reinvestment after the deduction of withholding tax.[2]
Show / Hide table
Year
Change in Index
Total Annual Return, including dividends
Value of $1.00 invested on January 1, 1970
Annualized Return over
5 years
10 years
15 years
20 years
25 years
1961
23.13%
-
-
-
-
-
-
-
1962
−11.81%
-
-
-
-
-
-
-
1963
18.89%
-
-
-
-
-
-
-
1964
12.97%
-
-
-
-
-
-
-
1965
9.06%
-
-
-
-
-
-
-
1966
−13.09%
-
-
-
-
-
-
-
1967
20.09%
-
-
-
-
-
-
-
1968
7.66%
-
-
-
-
-
-
-
1969
−11.36%
-
-
-
-
-
-
-
1970
0.10%
4.01%
$1.04
-
-
-
-
-
1971
10.79%
14.31%
$1.19
-
-
-
-
-
1972
15.63%
18.98%
$1.41
-
-
-
-
-
1973
−17.37%
−14.66%
$1.21
-
-
-
-
-
1974
−29.72%
−26.47%
$0.89
−2.35%
-
-
-
-
1975
31.55%
37.20%
$1.22
3.21%
-
-
-
-
1976
19.15%
23.84%
$1.51
4.87%
-
-
-
-
1977
−11.50%
−7.18%
$1.40
−0.21%
-
-
-
-
1978
1.06%
6.56%
$1.49
4.32%
-
-
-
-
1979
12.31%
18.44%
$1.77
14.76%
5.86%
-
-
-
1980
25.77%
32.50%
$2.34
13.96%
8.45%
-
-
-
1981
−9.73%
−4.92%
$2.23
8.10%
6.47%
-
-
-
1982
14.76%
21.55%
$2.71
14.09%
6.70%
-
-
-
1983
17.27%
22.56%
$3.32
17.32%
10.63%
-
-
-
1984
1.40%
6.27%
$3.52
14.81%
14.78%
8.76%
-
-
1985
26.33%
31.73%
$4.64
14.67%
14.32%
10.49%
-
-
1986
14.62%
18.67%
$5.51
19.87%
13.83%
10.76%
-
-
1987
2.03%
5.25%
$5.80
16.47%
15.27%
9.86%
-
-
1988
12.40%
16.61%
$6.76
15.31%
16.31%
12.17%
-
-
1989
27.25%
31.69%
$8.90
20.37%
17.55%
16.61%
11.55%
-
1990
−6.56%
−3.10%
$8.63
13.20%
13.93%
13.94%
11.16%
-
1991
26.31%
30.47%
$11.26
15.36%
17.59%
14.34%
11.90%
-
1992
4.46%
7.62%
$12.11
15.88%
16.17%
15.47%
11.34%
-
1993
7.06%
10.08%
$13.33
14.55%
14.93%
15.72%
12.76%
-
1994
−1.54%
1.32%
$13.51
8.70%
14.38%
14.52%
14.58%
10.98%
1995
34.11%
37.58%
$18.59
16.59%
14.88%
14.81%
14.60%
12.22%
1996
20.26%
22.96%
$22.86
15.22%
15.29%
16.80%
14.56%
12.55%
1997
31.01%
33.36%
$30.48
20.27%
18.05%
17.52%
16.65%
13.07%
1998
26.67%
28.58%
$39.19
24.06%
19.21%
17.90%
17.75%
14.94%
1999
19.53%
21.04%
$47.44
28.56%
18.21%
18.93%
17.88%
17.25%
2000
−10.14%
−9.10%
$43.12
18.33%
17.46%
16.02%
15.68%
15.34%
2001
−13.04%
−11.89%
$37.99
10.70%
12.94%
13.74%
15.24%
13.78%
2002
−23.37%
−22.10%
$29.60
−0.59%
9.34%
11.48%
12.71%
12.98%
2003
26.38%
28.68%
$38.09
−0.57%
11.07%
12.22%
12.98%
13.84%
2004
8.99%
10.88%
$42.23
−2.30%
12.07%
10.94%
13.22%
13.54%
2005
3.00%
4.91%
$44.30
0.54%
9.07%
11.52%
11.94%
12.48%
2006
13.62%
15.79%
$51.30
6.19%
8.42%
10.64%
11.80%
13.37%
2007
3.53%
5.49%
$54.12
12.83%
5.91%
10.49%
11.82%
12.73%
2008
−38.49%
−37.00%
$34.09
−2.19%
−1.38%
6.46%
8.43%
9.77%
2009
23.45%
26.46%
$43.11
0.41%
−0.95%
8.04%
8.21%
10.54%
2010
12.78%
15.06%
$49.61
2.29%
1.41%
6.76%
9.14%
9.94%
2011
-0.00%
2.11%
$50.65
−0.25%
2.92%
5.45%
7.81%
9.28%
2012
13.41%
16.00%
$58.76
1.66%
7.10%
4.47%
8.22%
9.71%
2013
29.60%
32.39%
$77.79
17.94%
7.40%
4.68%
9.22%
10.26%
2014
11.39%
13.69%
$88.44
15.45%
7.67%
4.24%
9.85%
9.62%
2015
−0.73%
1.38%
$89.66
12.57%
7.30%
5.00%
8.19%
9.82%
2016
9.54%
11.96%
$100.38
14.66%
6.94%
6.69%
7.68%
9.15%
2017
19.42%
21.83%
$122.30
15.79%
8.49%
9.92%
7.19%
9.69%
2018
−6.24%
−4.38%
$116.94
8.49%
13.12%
7.77%
5.62%
9.07%
2019
28.88%
31.49%
$153.76
11.70%
13.56%
9.00%
6.06%
10.22%
2020
16.26%
18.40%
$182.06
15.22%
13.89%
9.88%
7.47%
9.56%
2021
26.89%
28.71%
$234.33
18.48%
16.55%
10.66%
9.52%
9.76%
2022
−19.44%
−18.11%
$191.89
9.43%
12.56%
8.80%
9.80%
7.64%
2023
24.23%
26.29%
$242.34
15.69%
12.03%
13.97%
9.69%
7.56%
2024
23.31%
25.02%
$302.97
14.53%
13.10%
13.88%
10.35%
7.70%
2025
16.39%
17.88%
$357.14
14.43%
14.82%
14.07%
11.00%
8.82%
High
34.11%
37.58%
---
28.56%
19.21%
18.93%
17.88%
17.25%
Low
−38.49%
−37.00%
---
−2.35%
−1.38%
4.24%
5.62%
7.56%
Median
12.59%
15.90%
---
14.26%
12.94%
10.85%
11.16%
10.24%
Year
Change in Index
Total Annual Return, including dividends
Value of $1.00 invested on January 1, 1970
Annualized Return over
5 years
10 years
15 years
20 years
25 years
The S&P 500’s record closing high of 6,932.05 was set on December 24, 2025. The index had experienced an intra-year correction, typically defined as a decline of 10 to 20%, and it fell to a low of 4,982.77 on April 8 before staging a sharp recovery. The S&P 500 rose above 7,000 points during trading, for the first time in history on January 28, 2026.[32]
This page is based on this Wikipedia article Text is available under the CC BY-SA 4.0 license; additional terms may apply. Images, videos and audio are available under their respective licenses.