Sheffield Heeley | |
---|---|
Borough constituency for the House of Commons | |
County | South Yorkshire |
Electorate | 65,373 (December 2018) [1] |
Current constituency | |
Created | 1950 |
Member of Parliament | Louise Haigh (Labour) |
Seats | One |
Created from | Sheffield Ecclesall and Sheffield Park |
Sheffield Heeley is a constituency [n 1] represented in the House of Commons of the UK Parliament since 2015 by Louise Haigh, a member of the Labour Party. [n 2] It is located in the city of Sheffield, South Yorkshire.
This seat was created in 1950, largely replacing the former Sheffield Ecclesall constituency, its boundaries being significantly altered in 1955 with the abolition of Sheffield Neepsend. At its first five elections, up to but excluding 1966, the seat was won by a Conservative, Peter Roberts; it changed hands three times between 1966 and 1974.
Against the national swing, the 1979 election saw Sheffield Heeley move from being a marginal Labour seat to having a solid Labour majority. Of the subsequent elections, only the 1983 and 2010 results have been fairly marginal; the others have suggested a safe Labour seat. At the 2010 election the Liberal Democrat had more than a quarter of the vote, whereas the Conservatives, on 17.3%, garnered 3% more votes than in 2005. [n 3]
1950–1955: The County Borough of Sheffield wards of Heeley, Nether Edge, Norton, and Woodseats.
1955–1974: The County Borough of Sheffield wards of Heeley, Nether Edge, Norton, Sharrow, and Woodseats.
1974–1983: The County Borough of Sheffield wards of Beauchief, Gleadless, Heeley, and Intake.
1983–2010: The City of Sheffield wards of Beauchief, Heeley, Intake, Norton, and Park.
2010–present: The City of Sheffield wards of Arbourthorne, Beauchief and Greenhill, Gleadless Valley, Graves Park, and Richmond.
Further to the 2023 Periodic Review of Westminster constituencies, enacted by the Parliamentary Constituencies Order 2023, from the next general election, due by January 2025, the constituency will be composed of the following (as they existed on 1 December 2020):
After adjusting for revised ward boundaries, the Manor Castle ward will be added from Sheffield Central, partly offset by the transfer of part of the Richmond ward to Sheffield South East.
This constituency has a moderate Labour majority and contains a mixture of urban areas. In 2010 the BNP, unusually in Britain, achieved more than the 5% share of the vote necessary to recover the election deposit; its 5.5% share was a record in Sheffield.
The constituency consists of Census Output Areas a local government districts with: a working population whose income is marginally below the national average, and that has close to average reliance upon social housing. [3] At the end of 2012, 5.7% of the population was claiming Jobseekers Allowance, compared to the regional average of 4.7%. [4] The district contributing to the seat has a medium 33% of its population without a car. [n 4] A medium 24.3% of the city's population are without qualifications, a high 15.8% of the population with level 3 qualifications and a medium 25.7% with level 4 qualifications or above. In terms of tenure, as of the 2011 census, a relatively low 58.3% of homes were owned outright or on a mortgage by occupants across the district. [5]
Election | Member | Party | |
---|---|---|---|
1950 | Peter Roberts | Conservative | |
1966 | Frank Hooley | Labour | |
1970 | John Spence | Conservative | |
Feb 1974 | Frank Hooley | Labour | |
1983 | Bill Michie | ||
2001 | Meg Munn | ||
2015 | Louise Haigh |
Party | Candidate | Votes | % | ±% | |
---|---|---|---|---|---|
SDP | Helen Jackman [6] | ||||
TUSC | Mick Suter [7] | ||||
Party | Candidate | Votes | % | ±% | |
---|---|---|---|---|---|
Labour | Louise Haigh | 21,475 | 50.3 | -9.7 | |
Conservative | Gordon Gregory | 12,955 | 30.3 | +1.6 | |
Brexit Party | Tracy Knowles | 3,538 | 8.3 | New | |
Liberal Democrats | Simon Clement-Jones | 2,916 | 6.8 | +2.2 | |
Green | Paul Turpin | 1,811 | 4.2 | +2.1 | |
Majority | 8,520 | 20.0 | -11.3 | ||
Turnout | 42,695 | 63.8 | -1.3 | ||
Labour hold | Swing | -5.6 | |||
Party | Candidate | Votes | % | ±% | |
---|---|---|---|---|---|
Labour | Louise Haigh | 26,524 | 60.0 | +11.8 | |
Conservative | Gordon Gregory | 12,696 | 28.7 | +12.5 | |
Liberal Democrats | Joe Otten | 2,022 | 4.6 | -6.7 | |
UKIP | Howard Denby | 1,977 | 4.5 | -12.9 | |
Green | Declan Walsh | 943 | 2.1 | -4.0 | |
SDP | Jaspreet Oberoi | 64 | 0.1 | New | |
Majority | 13,828 | 31.3 | +0.5 | ||
Turnout | 44,226 | 65.1 | +0.4 | ||
Labour hold | Swing | -0.4 | |||
Party | Candidate | Votes | % | ±% | |
---|---|---|---|---|---|
Labour | Louise Haigh | 20,269 | 48.2 | +5.6 | |
UKIP | Howard Denby | 7,315 | 17.4 | +13.7 | |
Conservative | Stephen Castens | 6,792 | 16.2 | -1.1 | |
Liberal Democrats | Simon Clement-Jones | 4,746 | 11.3 | -17.1 | |
Green | Rita Wilcock | 2,566 | 6.1 | +3.7 | |
TUSC | Alan Munro | 238 | 0.6 | New | |
English Democrat | David Haslett | 122 | 0.3 | New | |
Majority | 12,954 | 30.8 | +16.6 | ||
Turnout | 42,048 | 60.7 | -1.3 | ||
Labour hold | Swing | ||||
Party | Candidate | Votes | % | ±% | |
---|---|---|---|---|---|
Labour Co-op | Meg Munn | 17,409 | 42.6 | -11.5 | |
Liberal Democrats | Simon Clement-Jones | 11,602 | 28.4 | +7.0 | |
Conservative | Anne Crampton | 7,081 | 17.3 | +3.0 | |
BNP | John Beatson | 2,260 | 5.5 | +2.1 | |
UKIP | Charlotte Arnott | 1,530 | 3.7 | +1.4 | |
Green | Gareth Roberts | 989 | 2.4 | -1.2 | |
Majority | 5,807 | 14.2 | -19.5 | ||
Turnout | 40,871 | 62.0 | +4.3 | ||
Labour Co-op hold | Swing | -9.25 | |||
Party | Candidate | Votes | % | ±% | |
---|---|---|---|---|---|
Labour Co-op | Meg Munn | 18,405 | 54.0 | -3.0 | |
Liberal Democrats | Colin Ross | 7,035 | 20.6 | -2.0 | |
Conservative | Aster Crawshaw | 4,987 | 14.6 | +0.4 | |
BNP | John Beatson | 1,314 | 3.9 | New | |
Green | Rob Unwin | 1,312 | 3.9 | +1.6 | |
UKIP | Mark Suter | 775 | 2.3 | +0.4 | |
Socialist Alternative | Mark Dunnell | 265 | 0.8 | New | |
Majority | 11,370 | 33.4 | -0.9 | ||
Turnout | 34,093 | 57.1 | +2.0 | ||
Labour Co-op hold | Swing | -0.5 | |||
Party | Candidate | Votes | % | ±% | |
---|---|---|---|---|---|
Labour Co-op | Meg Munn | 19,452 | 57.0 | -3.7 | |
Liberal Democrats | Dave Willis | 7,748 | 22.7 | +1.4 | |
Conservative | Carolyn Abbott | 4,864 | 14.2 | -1.4 | |
Green | Rob Unwin | 774 | 2.3 | New | |
Socialist Labour | Brian Fischer | 667 | 2.0 | New | |
UKIP | David Dunn | 634 | 1.9 | New | |
Majority | 11,704 | 34.3 | -5.1 | ||
Turnout | 34,139 | 55.1 | -9.9 | ||
Labour Co-op hold | Swing | ||||
Party | Candidate | Votes | % | ±% | |
---|---|---|---|---|---|
Labour | Bill Michie | 26,274 | 60.7 | +5.0 | |
Liberal Democrats | Roger Davison | 9,196 | 21.3 | +2.9 | |
Conservative | John Harthman | 6,767 | 15.6 | -10.3 | |
Referendum | David Mawson | 1,029 | 2.4 | New | |
Majority | 17,078 | 39.4 | +9.6 | ||
Turnout | 43,266 | 65.0 | -5.9 | ||
Labour hold | Swing | ||||
Party | Candidate | Votes | % | ±% | |
---|---|---|---|---|---|
Labour | Bill Michie | 28,005 | 55.7 | +2.3 | |
Conservative | David Beck | 13,051 | 25.9 | -0.4 | |
Liberal Democrats | Peter Moore | 9,247 | 18.4 | -1.9 | |
Majority | 14,954 | 29.8 | +2.7 | ||
Turnout | 50,303 | 70.9 | -1.1 | ||
Labour hold | Swing | ||||
Party | Candidate | Votes | % | ±% | |
---|---|---|---|---|---|
Labour | Bill Michie | 28,425 | 53.4 | +7.6 | |
Conservative | Nicholas Mearing-Smith | 13,985 | 26.3 | -3.6 | |
Alliance | Peter Moore | 10,811 | 20.3 | -4.0 | |
Majority | 14,440 | 27.1 | +11.2 | ||
Turnout | 53,221 | 72.0 | +1.5 | ||
Labour hold | Swing | ||||
Party | Candidate | Votes | % | ±% | |
---|---|---|---|---|---|
Labour | Bill Michie | 24,111 | 45.8 | -4.0 | |
Conservative | Sidney Cordle | 15,743 | 29.9 | -10.2 | |
Alliance | John Day | 12,813 | 24.3 | +14.8 | |
Majority | 8,368 | 15.9 | +5.2 | ||
Turnout | 52,667 | 70.5 | -6.8 | ||
Labour hold | Swing | ||||
Party | Candidate | Votes | % | ±% | |
---|---|---|---|---|---|
Labour | Frank Hooley | 24,618 | 49.8 | -1.8 | |
Conservative | Danny George | 19,845 | 40.1 | +8.1 | |
Liberal | Rodney Webb | 4,708 | 9.5 | -5.4 | |
National Front | P. K. Thorpe | 274 | 0.6 | -0.9 | |
Majority | 4,773 | 9.7 | -9.9 | ||
Turnout | 49,445 | 77.3 | +3.8 | ||
Labour hold | Swing | ||||
Party | Candidate | Votes | % | ±% | |
---|---|---|---|---|---|
Labour | Frank Hooley | 24,728 | 51.6 | +3.9 | |
Conservative | Alan Page | 15,322 | 32.0 | -3.3 | |
Liberal | Royden Fairfax | 7,151 | 14.9 | -2.1 | |
National Front | Peter Revell | 723 | 1.5 | New | |
Majority | 9,406 | 19.6 | +7.2 | ||
Turnout | 47,924 | 73.5 | -8.5 | ||
Labour hold | Swing | ||||
Party | Candidate | Votes | % | ±% | |
---|---|---|---|---|---|
Labour | Frank Hooley | 25,317 | 47.7 | +1.8 | |
Conservative | Robert Ingle | 18,732 | 35.3 | -11.7 | |
Liberal | Anthony Singleton | 9,061 | 17.0 | +9.9 | |
Majority | 6,585 | 12.4 | N/A | ||
Turnout | 53,110 | 82.0 | +8.6 | ||
Labour gain from Conservative | Swing | ||||
Party | Candidate | Votes | % | ±% | |
---|---|---|---|---|---|
Conservative | John Spence | 27,950 | 47.0 | +1.0 | |
Labour | Frank Hooley | 27,237 | 45.9 | -8.1 | |
Liberal | Anthony Singleton | 4,220 | 7.1 | New | |
Majority | 713 | 1.1 | N/A | ||
Turnout | 59,407 | 73.4 | -5.3 | ||
Conservative gain from Labour | Swing | ||||
Party | Candidate | Votes | % | ±% | |
---|---|---|---|---|---|
Labour | Frank Hooley | 31,996 | 54.0 | +5.5 | |
Conservative | John Spence | 27,267 | 46.0 | -5.5 | |
Majority | 4,729 | 8.0 | N/A | ||
Turnout | 59,263 | 78.7 | +2.7 | ||
Labour gain from Conservative | Swing | ||||
Party | Candidate | Votes | % | ±% | |
---|---|---|---|---|---|
Conservative | Peter Roberts | 29,587 | 51.5 | -7.5 | |
Labour | Frank Hooley | 27,883 | 48.5 | +7.5 | |
Majority | 1,704 | 3.0 | -15.0 | ||
Turnout | 57,470 | 76.0 | -1.6 | ||
Conservative hold | Swing | ||||
Party | Candidate | Votes | % | ±% | |
---|---|---|---|---|---|
National Liberal | Peter Roberts | 33,236 | 59.0 | -1.9 | |
Labour | Joan Mellors | 23,109 | 41.0 | +1.9 | |
Majority | 10,127 | 18.0 | -3.8 | ||
Turnout | 56,345 | 77.6 | +0.6 | ||
National Liberal hold | Swing | ||||
Party | Candidate | Votes | % | ±% | |
---|---|---|---|---|---|
National Liberal | Peter Roberts | 30,798 | 60.9 | -0.1 | |
Labour | John Sewell | 19,747 | 39.1 | +0.1 | |
Majority | 11,051 | 21.8 | -0.2 | ||
Turnout | 50,545 | 77.0 | -7.6 | ||
National Liberal hold | Swing | ||||
Party | Candidate | Votes | % | ±% | |
---|---|---|---|---|---|
National Liberal | Peter Roberts | 27,776 | 61.0 | +4.7 | |
Labour | Arnold Jennings | 17,729 | 39.0 | +1.2 | |
Majority | 10,047 | 22.0 | +3.5 | ||
Turnout | 45,505 | 84.6 | -3.5 | ||
National Liberal hold | Swing | ||||
Party | Candidate | Votes | % | ±% | |
---|---|---|---|---|---|
National Liberal | Peter Roberts | 26,560 | 56.3 | ||
Labour | Arnold Jennings | 17,856 | 37.8 | ||
Liberal | Phillip Beckerlegge | 2,779 | 5.9 | ||
Majority | 8,704 | 18.5 | |||
Turnout | 47,195 | 88.1 | |||
National Liberal win (new seat) |
Sheffield Hallam is a constituency represented in the House of Commons of the UK Parliament since 2019 by Olivia Blake of the Labour Party.
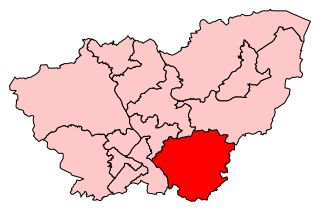
Rother Valley is a constituency represented in the House of Commons of the UK Parliament by Alexander Stafford, a member of the Conservative Party.
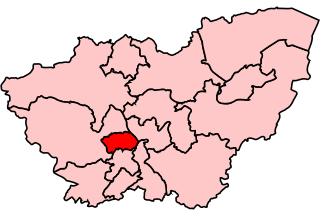
Sheffield, Brightside was a parliamentary constituency in the City of Sheffield. Created for the 1885 general election, and replaced at the 2010 general election by the new constituency of Sheffield Brightside and Hillsborough, it elected one Member of Parliament (MP) to the House of Commons of the Parliament of the United Kingdom, using the first-past-the-post voting system.
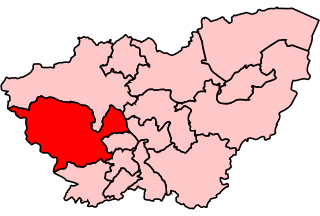
Sheffield Attercliffe was a parliamentary constituency in the City of Sheffield. It was created at the 1885 general election and abolished at the 2010 general election, when it was replaced by a new Sheffield South East constituency.
Sheffield Hillsborough was a Parliamentary constituency in the City of Sheffield. It was considered a safe Labour seat and was represented by Helen Jackson from 1992 to 2005. She did not stand again in the 2005 general election and was succeeded by Angela Smith.
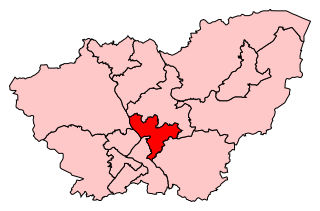
Sheffield Central is a constituency represented in the House of Commons of the UK Parliament since 2010 by Paul Blomfield, a member of the Labour Party.
Rotherham is a constituency represented in the House of Commons of the UK Parliament since 2012 by Sarah Champion, a member of the Labour Party.
The areas of Sheffield, a city and metropolitan borough in the north of England, vary widely in size and history. Some of the areas developed from villages or hamlets, that were absorbed into Sheffield as the city grew, and thus their centres are well defined, but the boundaries of many areas are ambiguous. The areas of Sheffield do not play a significant administrative role, but the city is divided into 28 electoral wards for local elections and 6 parliamentary constituencies for national elections.
Sedgefield is a constituency in County Durham represented in the House of Commons of the UK Parliament since 2019 by Paul Howell of the Conservative Party. It elects one Member of Parliament (MP) by the first past the post system of election.
Bury South is a borough constituency represented in the House of Commons of the Parliament of the United Kingdom. At the 2019 General Election it was the 10th most marginal seat in the country, with a majority of 402 for the Conservative Party candidate Christian Wakeford. Wakeford defected to the Labour Party on 19 January 2022.
Bootle is a constituency which has been represented in the House of Commons of the UK Parliament, since 2015 by Peter Dowd of the Labour Party.
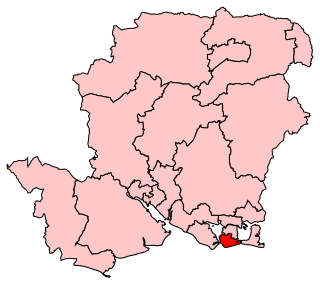
Portsmouth South is a constituency represented in the House of Commons of the UK Parliament since 2017 by Stephen Morgan of the Labour Party. Morgan is the first Labour MP to represent the seat.
Sherwood is a constituency represented in the House of Commons of the UK Parliament since 2010 by Mark Spencer, a Conservative. The constituency's name is common with Sherwood Forest which is in the area.
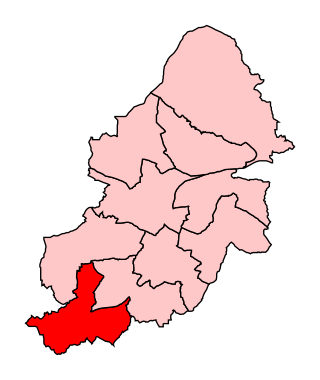
Birmingham Northfield is a constituency represented in the House of Commons of the UK Parliament since 2019 by Gary Sambrook, a Conservative. It represents the southernmost part of the city of Birmingham.
Lewisham East is a parliamentary constituency represented in the House of Commons of the UK Parliament since the by-election on 14 June 2018 by Janet Daby of the Labour Party.
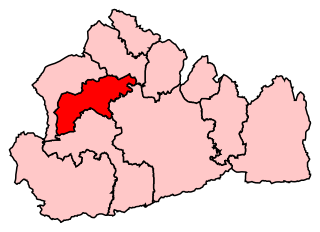
Woking is a constituency represented in the House of Commons of the UK Parliament since 2010 by Jonathan Lord, a Conservative. Since it was first created for the 1950 general election, it has only ever returned Conservative Party candidates.
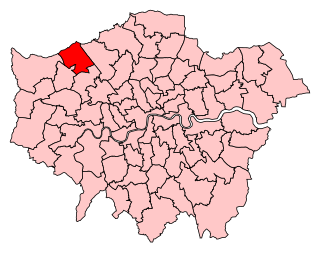
Harrow East is a constituency in Greater London created in 1945 and represented in the House of Commons of the UK Parliament since 2010 by Bob Blackman, a Conservative.
Sheffield, Brightside and Hillsborough is a constituency represented in the House of Commons of the UK Parliament by Gill Furniss, a member of the Labour Party.
Sheffield South East is a constituency represented in the House of Commons of the UK Parliament since its 2010 creation by Clive Betts, a member of the Labour Party.