Solar power in New Jersey

Last updated
Intermediate school with both rooftop and ground-mount solar panels in Delran, New Jersey Baylson 000290 171088 515945 4578 (36963957595).jpg
Intermediate school with both rooftop and ground-mount solar panels in Delran, New Jersey

New Jersey has over 4,700 MW of installed solar power capacity as of January 2024, [1] which provides more than 7% of the state's electricity consumption. [2] The's state's growth of solar power is aided by a renewable portfolio standard that requires that 22.5% of New Jersey's electricity come from renewable resources by 2021 and 50% by 2030, by incentives provided for generation of solar power, and by one of the most favorable net metering standards in the country, allowing customers of any size array to use net metering, although generation may not exceed annual demand. As of 2018, New Jersey has the sixth-largest installed solar capacity of all U.S. states and the largest installed solar capacity of the Northeastern States. [3]

Contents

New Jersey has historically been aggressive in installing solar power, at one point being the second largest solar state in the U.S. with 306.1 megawatts of installed solar power in 2011, which was a 131% increase over the 132.4 megawatts installed in 2010. In 2010, New Jersey became the second state, after California, to install over 100 MW in a single year. [4] The New Jersey Board of Public Utilities administers incentive programs that support the development of the state's solar industry. As of January 2024, over 194,000 solar photovoltaic systems have been installed, with 4,765 MW of capacity. [1] Net-metered projects make up 80% of the installed capacity, 191 grid-supply projects make up 17% of capacity, and 102 community solar projects are 3% of capacity. [1]

New Jersey has 662 schools with 194 MW of solar power installed as of 2022, the second most after California. [5]

Incentives

Rooftop installation, Baylson Baylson 000182 171110 515934 4578 (35949237994).jpg
Rooftop installation, Baylson

The former New Jersey Clean Energy Program rebates on PV equipment have been discontinued. [6] [7]

The federal Residential Energy Efficient Property Credit (income tax credit on IRS Form 5695) for residential PV and solar thermal was extended in December 2015 to remain at 30% of system cost (parts and installation) for systems put into service by the end of 2019, then 26% until the end of 2020, and then 22% until the end of 2021. It applies to a taxpayer's principal and/or second residences, but not to a property that is rented out. There is no maximum cap on the credit, and the credit can be applied toward the Alternative Minimum Tax, and any excess credit (greater than that year's tax liability) can be rolled into the following year. [8] [9]

NJ law provides new solar power installations with exemptions from the 6.625% state sales tax, and from any increase in property assessment (local property tax increases), subject to certain registration requirements. [10] [11]

Renewable Portfolio Standard

Rooftop solar panels at the New York Jets training facility in Florham Park, New Jersey Syn 5433.jpg
Rooftop solar panels at the New York Jets training facility in Florham Park, New Jersey

New Jersey's renewable portfolio standard (RPS) is one of the most aggressive in the United States and requires each electricity supplier/provider to provide 22.5% from renewable energy sources by 2021 and 50% by 2030. In addition, 2.12% must come from solar electricity, an amount estimated to be 1,500 megawatts (MW). [12] Solar Renewable Energy Certificates (SRECs) must be purchased by electricity suppliers to meet the state targets or else they face a fine known as a Solar Alternative Compliance Payment (SACP) that was $272/MWh in 2022. [13] As New Jersey was approaching the minimum requirements, the requirements were accelerated on July 23, 2012, changing the shape of the compliance curve from slowly increasing at first to rapidly increasing at first. [12]

Solar Renewable Energy Certificates

In 2004, New Jersey adopted a program promoting the use of Solar Renewable Energy Certificates (SRECs) to meet the solar energy carve-out of the state RPS. In the 2011 Energy Year, 306,000 SRECs (or MWhs of solar electricity) must be purchased by electricity suppliers in the state in order to meet the state solar requirement. That requirement grows to over 5 million in 2026. [14]

An SREC program is an alternative to the feed-in tariff model popular in Europe. The key difference between the two models is the market-based mechanism that drives the value of the SRECs, and therefore the value of the subsidy for solar. In a feed-in tariff model, the government sets the value for the electricity produced by a solar facility. If the level is too high, too much solar power is built and the program is more costly. If the feed-in tariff is set too low, not enough solar power is built and the program is ineffective.

The SREC program allows for the creation of a certificate with every megawatt-hour (MWh) of electricity produced. The certificate represents the solar aspect of the electricity that is produced and can be unbundled and sold separately from the electricity itself. Electricity companies, known as load-serving entities, are required by state RPS laws to procure a certain amount of their electricity from solar. Since it is often more costly for them to build solar farms themselves, the load-serving entities will purchase SRECs from solar generators and use the SRECs to comply with the state laws. With an SREC market, the value of an SREC is determined by supply and demand, subject to certain limitations. If solar is slow to develop, SREC values will remain high, encouraging the development of solar. If too much solar is added, SREC values will decrease, which in turn lowers the attractiveness of the investment. SRECs in New Jersey have traded as high as $680 per MWh. [14] In comparison, the average sale price for the electricity itself ranges from $50 per MWh to $180 per MWh. The value created from the benefits of selling SRECs dwarf the value created by the actual electricity produced in today's market. This means that SRECs play a major role in the return on investment for solar in New Jersey. In 2012 the program was modified in the "solar rescue bill" to increase the value of the SRECs, which have declined in value by 92% but cap them at no more than $325. [15]

The SREC program closed to new registrations in April 2020. [16] A total of 3,335 MW was installed under the SREC program. [1]

The Transition Incentive Program was open to new registrations between October 2019 and August 27, 2021. This program provided fixed incentives called TRECs with different values for different project types. There was no limit to the number of projects that could apply. [17] As of January 2024, 987 MW of projects have been completed under the TI Program. [1]

The Successor Solar Incentive Program opened its Administratively Determined Incentive component on August 28, 2021. This program provides fixes incentives called SREC-IIs to up to 450 MW of small net-metered projects and community solar each year. [18] As of January 2024, 442 MW of projects have been completed under the ADI Program. [1]

The Competitive Solar Incentive component will begin in 2023 and provide SREC-IIs priced as part of a competitive solicitation to 300 MW of grid-supply and large net-metered projects each year. [19] [20]

Net metering

In 2008, New Jersey and Colorado were the only two states to allow unlimited net metering customers, up to 2 megawatts for each customer. In 2010 the limit was removed, and in 2012 connection may be to a 69 kV or lower line voltage, raising the previous requirements. [12] New Jersey is one of three states which have no limit on an individual project's size, although generation may not exceed annual demand, and the Board of Public Utilities originally had the option of limiting participation to 2.5% of peak demand, [21] but the cap was raised to 2.9% in August 2015, which was seen as a temporary fix that would cover three years. [22] In 2018, the legislature increased the net metering cap to 5.8% of retail sales. [23]

Landfill solar

New Jersey's subsection (t) program, established in the Solar Act of 2012, has allowed for the redevelopment of numerous landfill and brownfield sites into solar arrays. The Mount Olive Solar Farm, located on a former Superfund site, is the largest solar project on a landfill in North America and was completed in November 2022. [24] [25] As of April 2023, there are 37 projects with 290 MW of capacity built on closed and repurposed landfills and brownfields. [1] Seventeen projects with 187 MW are on Superfund sites, the most of any state. [26]

Solar 4 All project

Solar panels on PSE&G utility poles in South Brunswick PSE&G Solar panels utility poles.jpg
Solar panels on PSE&G utility poles in South Brunswick

In 2009, Public Service Enterprise Group, the largest utility company in New Jersey, announced plans to install solar panels on 200,000 utility poles in its service area, the largest such project in the world. [27] [28] In addition to the 38 MW of pole-mounted power, [29] PSEG's Solar 4 All project built at least 34 solar projects with 152 MW. [30] [31] [32]

Installed capacity

Total Photovoltaics [33] [34] [35] [36] [37]
YearTotal installed solar power (MWp)
2001
0.028
2002
0.687
2003
1.81
2004
4.34
2005
13.9
2006
32.2
2007
46.5
2008
74.7
2009
131.2
2010
252.2
2011
699.5
2012
1,032.8
2013
1,253.2
2014
1,456.7
2015
1,652.8
2016
2,061.0
2017
2,411.4
2018
2,738.2
2019
2,908.2
2020
3,592.8
2021
3,854.2
2022
4,411

Generation

2017 NJ Solar Energy Generation Profile 2017 NJ Solar Energy Generation Profile.jpg
2017 NJ Solar Energy Generation Profile
Utility-scale solar generation in New Jersey (GWh) [38] [39]
YearTotal % of NJ total % of US solarJanFebMarAprMayJunJulAugSepOctNovDec
200911001111122110
201021<0.1%1.7%011233332111
2011690.1%7%134679886746
20123050.5%7%172126322733323128212215
20134380.7%4.8%222335494446443843413122
20145140.75%2.9%223143535256595849363322
20156280.8%2.5%343849637160677261533822
20168351.08%2.3%514573827494908866676144
20179241.22%1.74%346381859110810610791586040
20189921.72%1.94%5754898910411712411074695451
20191,1656375106101110126142127111807648
20201,592839812114817216918616213612610487
20211,2038993142164185179173178

Beginning with the 2014 data year, the Energy Information Administration has estimated distributed solar photovoltaic generation and distributed solar photovoltaic capacity. These non-utility scale estimates project that New Jersey generated the following additional solar energy:

Estimated Distributed Solar Electric Generation in New Jersey [40] [41]
YearSummer capacity (MW)Generation (GWh)
20141,106
20151,026.41,435
20161,058.21,385
20171,285.61,660
20181,490.91,927

Facilities

As of January 2023, New Jersey has more than 90 photovoltaic installations of over 5 MW, which have a cumulative capacity of over 850 MW, and over 510 projects of over 1 MW, with a cumulative capacity of 1,680 MW. [42] Most of these are net-metered. The largest in the state include (incomplete list; selected projects): [42]

NameLocationCapacity (MWdc)CommissionedNotes
Ben Moreell Solar Farm, Naval Weapons Station Earle [43] Tinton Falls 28.52015Superfund site [44]
Toms River Merchant Solar Toms River 27.32021Landfill/brownfield and Superfund site
Mount Olive – Combe Fill North Landfill Mount Olive Township 25.62023Landfill/brownfield and Superfund site [45] [46]
Six Flags Solar Jackson Township 23.52019Net metered, ground mount and carport
DSM Solar Belvidere 20.22019Net metered (three projects on site) [47]
Tinton Falls Solar Farm Tinton Falls19.92012Landfill/brownfield site
Pilesgrove Solar Farm Pilesgrove Township 19.92011
Fort Dix Landfill Lakehurst 16.52017Landfill/brownfield and Superfund site
Vinland Construction Co. Pennsauken Township 15.12019Landfill/brownfield site
McGraw-Hill Companies East Windsor 14.12012 [48]
Berry Plastics Phillipsburg 13.12013Net metered
SC Holdings Cinnaminson 13.02019Landfill/brownfield and Superfund site
New Jersey Oak Solar Fairfield Township 12.52012 [49]
Monroe Solar FarmMonroe Township12.02020Landfill/brownfield site
Seashore Solar Egg Harbor Township 10.62016Landfill/brownfield site
Holt Logistics Gloucester Terminal Gloucester City 10.12012Net metered, largest rooftop solar project in the US when completed (9 MW), 1.1 MW added in 2018 [50]
Frenchtown Solar III Kingwood Township 10.02013

New Jersey also has the Americas' largest floating solar array, an 8.9 MW project at New Jersey American Water's treatment plant in Millburn that was completed in 2022. [51] [52] The 4.4 MW system in Sayreville was the largest in the country when it was built in 2020. [53] A 3.3 MW project at a sand company puts the state's installed floating solar capacity at 16.6 MW, greater than the rest of North America combined. [54]

See also

Related Research Articles

Renewable Energy Certificates (RECs), also known as Green tags, Renewable Energy Credits, Renewable Electricity Certificates, or Tradable Renewable Certificates (TRCs), are tradable, non-tangible energy certificates in the United States that represent proof that 1 megawatt-hour (MWh) of electricity was generated from an eligible renewable energy resource and was fed into the shared system of power lines which transport energy. Solar renewable energy certificates (SRECs) are RECs that are specifically generated by solar energy.
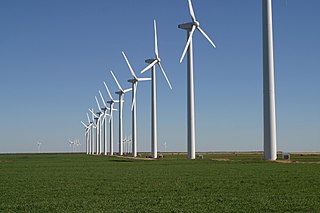
<span class="mw-page-title-main">Economy of New York (state)</span>

The economy of the State of New York is reflected in its gross state product in 2022 of $2.053 trillion, ranking third in size behind the larger states of California and Texas. If New York State were an independent nation, it would rank as the 10th largest economy in the world. However, in 2019, the multi-state, New York City-centered metropolitan statistical area produced a gross metropolitan product (GMP) of $US2.0 trillion, ranking first nationally by a wide margin and would also rank as the 10th largest GDP in the world.

<span class="mw-page-title-main">Solar power in Australia</span>

Solar power is a fast-growing industry in Australia. As of September 2023, Australia's over 3.60 million solar PV installations had a combined capacity of 32.9 GW photovoltaic (PV) solar power, of which at least 3,823 MW were installed in the preceding 12 months. In 2019, 59 solar PV projects with a combined capacity of 2,881 MW were either under construction, constructed or due to start construction having reached financial closure. Solar accounted for 12.4% of Australia's total electrical energy production in 2021.

<span class="mw-page-title-main">Renewable energy in the United States</span>

According to data from the US Energy Information Administration, renewable energy accounted for 8.4% of total primary energy production and 21% of total utility-scale electricity generation in the United States in 2022.

Financial incentives for photovoltaics are incentives offered to electricity consumers to install and operate solar-electric generating systems, also known as photovoltaics (PV).

A feed-in tariff is a policy mechanism designed to accelerate investment in renewable energy technologies by offering long-term contracts to renewable energy producers. This means promising renewable energy producers an above-market price and providing price certainty and long-term contracts that help finance renewable energy investments. Typically, FITs award different prices to different sources of renewable energy in order to encourage the development of one technology over another. For example, technologies such as wind power and solar PV are awarded a higher price per kWh than tidal power. FITs often include a "digression": a gradual decrease of the price or tariff in order to follow and encourage technological cost reductions.

<span class="mw-page-title-main">Solar power in the United States</span>

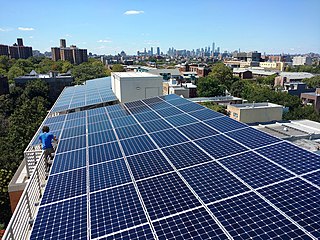
Solar power includes solar farms as well as local distributed generation, mostly on rooftops and increasingly from community solar arrays. In 2023, utility-scale solar power generated 164.5 terawatt-hours (TWh), or 3.9% of electricity in the United States. Total solar generation that year, including estimated small-scale photovoltaic generation, was 238 TWh.

<span class="mw-page-title-main">Solar power in California</span>

Solar power has been growing rapidly in the U.S. state of California because of high insolation, community support, declining solar costs, and a renewable portfolio standard which requires that 60% of California's electricity come from renewable resources by 2030, with 100% by 2045. Much of this is expected to come from solar power via photovoltaic facilities or concentrated solar power facilities.

Solar Renewable Energy Certificates (SRECs) or Solar Renewable Energy Credits, are a form of Renewable Energy Certificate or "green tag" existing in the United States of America. SRECs exist in states that have Renewable Portfolio Standard (RPS) legislation with specific requirements for solar energy, usually referred to as a "solar carve-out". The additional income received from selling SRECs increases the financial value of a solar investment and assists with the financing of solar technology. In conjunction with state and federal incentives, solar system owners can recover their investment in solar by selling their SRECs through spot market sales or long-term sales, both described below.

<span class="mw-page-title-main">Solar power in Hawaii</span> Overview of solar power in the U.S. state of Hawaii

The energy sector in Hawaii has rapidly adopted solar power due to the high costs of electricity, and good solar resources, and has one of the highest per capita rates of solar power in the United States. Hawaii's imported energy costs, mostly for imported petroleum and coal, are three to four times higher than the mainland, so Hawaii has motivation to become one of the highest users of solar energy. Hawaii was the first state in the United States to reach grid parity for photovoltaics. Its tropical location provides abundant ambient energy.

Wind power in Indiana was limited to a few small water-pumping windmills on farms until 2008 with construction of Indiana's first utility-scale wind power facility, Goodland with a nameplate capacity of 130 MW. As of March of 2024, Indiana had a total of 2,743 MW of wind power capacity installed, ranking it 12th among U.S. states. Wind power was responsible for 4.8% of in-state electricity production in 2016.
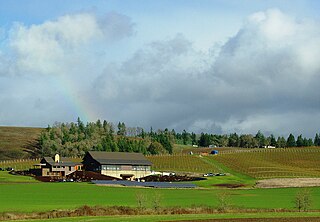
<span class="mw-page-title-main">Community solar</span> Solar power installation that accepts capital

A community solar project, farm or garden is a solar power installation that accepts capital from and provides output credit and tax benefits to multiple customers, including individuals, businesses, nonprofits, and other investors. Participants typically invest in or subscribe to a certain kW capacity or kWh generation of remote electrical production. The project's power output is credited to investors or subscribers in proportion to their investment, with adjustments to reflect ongoing changes in capacity, technology, costs and electricity rates. Community solar provides direct access to the renewable energy to customers who cannot install it themselves. Companies, cooperatives, governments or non-profits operate the systems.

<span class="mw-page-title-main">Solar power in Mexico</span> Overview of solar power in Mexico

Solar power in Mexico has the potential to produce vast amounts of energy. 70% of the country has an insolation of greater than 4.5 kWh/m2/day. Using 15% efficient photovoltaics, a square 25 km (16 mi) on each side in the state of Chihuahua or the Sonoran Desert could supply all of Mexico's electricity.

<span class="mw-page-title-main">Solar power in Massachusetts</span> Overview of solar power in the U.S. state of Massachusetts

Solar power in Massachusetts has been increasing rapidly, due to Section 1603 grants for installations that began before December 31, 2011, and the sale of SRECs for $0.30/kWh, which allows payback for the system within 5 or 6 years, and generates income for the life of the system. For systems installed after December 31, 2011, and before December 31, 2016, the 30% tax grant becomes a 30% tax credit. There has been an appeal to the Congress to extend the 1603 program, the grant program, for an additional year.

<span class="mw-page-title-main">Solar power in New York</span> Overview of solar power in the U.S. state of New York

New York has a renewable portfolio standard of 30% from renewable sources by 2015. In 2015 24% was renewable, 6% short of the goal. Wind is the predominant generating technology. In 2018, the New York State Energy Research and Development Authority awarded long-term contracts to 22 utility-scale solar farms, totaling a combined capacity of 646 MW.

<span class="mw-page-title-main">Solar power in Indiana</span> Overview of solar power in the U.S. state of Indiana

Solar power in Indiana has been growing in recent years due to new technological improvements and a variety of regulatory actions and financial incentives, particularly a 30% federal tax credit for any size project.

<span class="mw-page-title-main">Solar power in Georgia (U.S. state)</span> Overview of solar power in the U.S. state of Georgia

Solar power in Georgia on rooftops can provide 31% of all electricity used in Georgia.

<span class="mw-page-title-main">Solar power in Maryland</span> Overview of solar power in the U.S. state of Maryland

Solar power in Maryland is supported by the state's legislation regarding the Renewable Portfolio Standard and Solar Renewable Energy Credit (SREC) program. The target for renewable energy as of 2017 is 20% by 2020, including 2% from solar power.

<span class="mw-page-title-main">Solar power in Pennsylvania</span> Overview of solar power in the U.S. state of Pennsylvania

Solar power in Pennsylvania currently provides less than 1% of the state's electricity, but there are many policies in place to regulate and incentivize its use. Pennsylvania mandates the use of solar power through a renewable portfolio standard, which requires a percentage of electricity from each providers to come from solar, and net metering, which compensates small-scale solar generation through net metering. By 2021, Pennsylvania was required to have 0.5% of its electricity from solar. Their following goal is 10% by 2030. Solar power could theoretically provide over 30% of the state's electricity, but growth in solar generation has slowed due to a reduction in solar grants and the low price of solar energy credits. Efforts have also seen blowback from citizens, most notably from Mount Joy Township. Although, Pennsylvania has ruled solar as a legal use, meaning local governments can only restrict size and placement, but can't disband the projects.

References

  1. 1 2 3 4 5 6 7 "Solar Activity Reports | NJ OCE Web Site". njcleanenergy.com. Retrieved 2022-12-01.
  2. "New Jersey Solar". www.seia.org. 2022. Retrieved December 1, 2022.
  3. "Solar Industry Research Data". Solar Energy Industries Association . Retrieved 30 November 2018.
  4. Secondary U.S. Markets For Solar Power Are Continuing to Grow Archived 2011-06-23 at the Wayback Machine
  5. NJ.com, Amira Sweilem | NJ Advance Media for (2023-02-15). "N.J. schools rank 2nd in nation for solar power. See if your district has added panels". nj. Retrieved 2023-03-23.
  6. Renewable Energy Incentive Program: Customer Sited Incentives "There no longer are incentives for solar installations"
  7. "Renewable Energy". State of NJ. Retrieved April 29, 2016. "solar projects are no longer eligible for rebates"
  8. "Residential Renewable Energy Tax Credit". Energy.gov. US Department of Energy. Retrieved April 29, 2016.
  9. "Federal Income Tax Credits for Energy Efficiency". EnergyStar.gov. US EPA. Retrieved December 21, 2016.
  10. "Solar Energy Sales Tax Exemption". DSIRE. NC Clean Energy Technology Center. Retrieved April 29, 2016.
  11. "Property Tax Exemption for Renewable Energy Systems". DSIRE. NC Clean Energy Technology Center. Retrieved April 29, 2016.
  12. 1 2 3 "New Jersey Passes Legislation to Stabilize Its Solar Market - SEIA". SEIA. Retrieved 30 September 2018.
  13. "Solar Market Frequently Asked Questions (FAQs) | NJ OCE Web Site". njcleanenergy.com. Retrieved 2023-03-23.
  14. 1 2 "SREC Markets - New Jersey". SRECTrade. Retrieved 30 September 2018.
  15. Forand, Rebecca (December 18, 2012). "N.J. solar market struggling from oversaturation". South Jersey Times. Retrieved 2012-12-18.
  16. "SREC Registration Program | NJ OCE Web Site". njcleanenergy.com. Retrieved 2022-12-01.
  17. "Transition Incentive Program | NJ OCE Web Site". njcleanenergy.com. Retrieved 2022-12-01.
  18. "Administratively Determined Incentive (ADI) Program | NJ OCE Web Site". njcleanenergy.com. Retrieved 2022-12-01.
  19. "Competitive Solar Incentive (CSI) Program | NJ OCE Web Site". njcleanenergy.com. Retrieved 2022-12-01.
  20. "New Jersey launches competitive solar incentive program, aiming for 300 MW annually through 2026". Utility Dive. Retrieved 2022-12-13.
  21. New Jersey - Net Metering Archived 2012-04-18 at the Wayback Machine
  22. Johnson, Tom (August 11, 2015). "Bill Could Mean More Money to Small Businesses, Residents with Solar Panels". NJ Spotlight. Retrieved April 29, 2016.
  23. "Unpacking New Jersey's Much-Needed New Clean Energy Legislation". Solar Industry. 2018-05-31. Retrieved 2022-12-01.
  24. "Op-Ed: We'll see no more solar power developments on landfills unless lawmakers act fast". NJ Spotlight News.
  25. Misbrener, Kelsey (2021-08-17). "CEP Renewables kicks off construction on largest landfill solar project in North America". Solar Power World. Retrieved 2022-12-01.
  26. US EPA, OLEM (2015-03-25). "RE-Powering Tracking Matrix". www.epa.gov. Retrieved 2023-07-21.
  27. "PSE&G plans $773M for solar panels on 200K utility poles". The Star-Ledger . February 10, 2009. Retrieved January 19, 2011.
  28. "PSE&G To Install 105 Pole Mounted Solar Panels in the Borough of Magnolia". Borough of Magnolia. March 6, 2010. Retrieved January 19, 2011.
  29. Belson, Ken (2009-02-10). "New Jersey Utility Plans Major Solar Project". The New York Times. Retrieved 30 September 2018.
  30. "Solar 4 All® Fact Sheet" (PDF). PSE&G.
  31. Sroka-Holzmann, Pamela (July 27, 2010). "PSE&G installing solar panels in Hillsborough". Courier News . Retrieved January 19, 2011.
  32. "PSE&G's Largest Solar Farm Placed In-Service". nj.pseg.com. Retrieved 2023-06-13.
  33. Solar Installation Projects Archived 2009-03-04 at the Wayback Machine
  34. New Jersey Solar Market 2011 Overview Archived 2012-03-13 at the Wayback Machine
  35. Sherwood, Larry (July 2014). "U.S. Solar Market Trends 2013" (PDF). Interstate Renewable Energy Council (IREC). Retrieved 2014-09-26.
  36. "NJ's Clean Energy Program Installation and Project Status Reports". www.njcleanenergy.con. April 2019. Retrieved August 11, 2019.
  37. New Jersey Solar
  38. "Electric Power Monthly-Data Browser 6/17" retrieved 2019-3-19
  39. "Electricity Data Browser" retrieved 2019-3-24
  40. “Electric Power Monthly” |title=Electric Power Monthly (February 2019 with data for December 2018) - Table 6.2.B. Net Summer Capacity using Primarily Renewable Sources retrieved 2019 3 19
  41. “Electric Power Monthly” |title=Electric Power Monthly (February 2019 with data for December 2018) - Table 1.17.B. Net Generation from Solar Photovoltaic retrieved 2019 3 19
  42. 1 2 "Solar Activity Reports | NJ OCE Web Site". njcleanenergy.com. Retrieved 2021-11-10.
  43. "Ben Moreell Solar Farm 28.5 MW". CS Energy. Retrieved 2020-05-26.
  44. Lewis, Michelle (2020-05-18). "New Jersey's largest solar farm has been completed". Electrek. Retrieved 2020-05-26.
  45. Santana, Raven (2022-11-30). "Former Superfund site in Mount Olive is now a solar farm".
  46. Staff, ROI-NJ (2022-12-01). "Super solar project: NJR Clean Energy Ventures completes massive Mt. Olive project". ROI-NJ. Retrieved 2022-12-01.
  47. "DSM North America opens newly expanded 66 acre solar field in Belvidere, New Jersey | DSM". @corporate. Retrieved 2021-11-10.
  48. "Solar energy project at McGraw-Hill site recently completed". 12 January 2012. Retrieved 30 September 2018.
  49. "Lincoln Renewable Energy cuts ribbon on $50 million solar facility in Fairfield Township". 10 May 2012. Retrieved 30 September 2018.
  50. "Largest Rooftop Solar Power Plant in North America Formally Completed - CleanTechnica". cleantechnica.com. 7 April 2012. Retrieved 30 September 2018.
  51. Cooper, Melissa Rose (June 12, 2023). "Short Hills reservoir has nation's largest floating solar array". NJ Spotlight News.
  52. Engel, John (2022-05-03). "New Jersey floating solar project aims to be nation's largest". Renewable Energy World. Retrieved 2023-02-16.
  53. Ludt, Billy (2020-01-29). "The country's largest floating solar system keeps water clean". Solar Power World. Retrieved 2023-02-16.
  54. "Regulators Boost Incentive for New Jersey Floating Solar Project | RTO Insider". www.rtoinsider.com. Retrieved 2023-03-28.