In optics, the refractive index of an optical medium is a dimensionless number that gives the indication of the light bending ability of that medium.

In physics, refraction is the redirection of a wave as it passes from one medium to another. The redirection can be caused by the wave's change in speed or by a change in the medium. Refraction of light is the most commonly observed phenomenon, but other waves such as sound waves and water waves also experience refraction. How much a wave is refracted is determined by the change in wave speed and the initial direction of wave propagation relative to the direction of change in speed.
In optics, an index-matching material is a substance, usually a liquid, cement (adhesive), or gel, which has an index of refraction that closely approximates that of another object.

Convection is single or multiphase fluid flow that occurs spontaneously due to the combined effects of material property heterogeneity and body forces on a fluid, most commonly density and gravity. When the cause of the convection is unspecified, convection due to the effects of thermal expansion and buoyancy can be assumed. Convection may also take place in soft solids or mixtures where particles can flow.

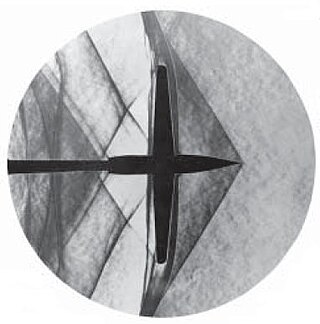
In physics, a shock wave, or shock, is a type of propagating disturbance that moves faster than the local speed of sound in the medium. Like an ordinary wave, a shock wave carries energy and can propagate through a medium but is characterized by an abrupt, nearly discontinuous, change in pressure, temperature, and density of the medium.

Schlieren photography is a process for photographing fluid flow. Invented by the German physicist August Toepler in 1864 to study supersonic motion, it is widely used in aeronautical engineering to photograph the flow of air around objects.

The cornea is the transparent front part of the eye that covers the iris, pupil, and anterior chamber. Along with the anterior chamber and lens, the cornea refracts light, accounting for approximately two-thirds of the eye's total optical power. In humans, the refractive power of the cornea is approximately 43 dioptres. The cornea can be reshaped by surgical procedures such as LASIK.

In fluid dynamics, a Mach wave, also known as a weak discontinuity, is a pressure wave traveling with the speed of sound caused by a slight change of pressure added to a compressible flow. These weak waves can combine in supersonic flow to become a shock wave if sufficient Mach waves are present at any location. Such a shock wave is called a Mach stem or Mach front. Thus, it is possible to have shockless compression or expansion in a supersonic flow by having the production of Mach waves sufficiently spaced. A Mach wave is the weak limit of an oblique shock wave where time averages of flow quantities don't change. If the size of the object moving at the speed of sound is near 0, then this domain of influence of the wave is called a Mach cone.

The Mach–Zehnder interferometer is a device used to determine the relative phase shift variations between two collimated beams derived by splitting light from a single source. The interferometer has been used, among other things, to measure phase shifts between the two beams caused by a sample or a change in length of one of the paths. The apparatus is named after the physicists Ludwig Mach and Ludwig Zehnder; Zehnder's proposal in an 1891 article was refined by Mach in an 1892 article. Mach–Zehnder interferometry with electrons as well as with light has been demonstrated. The versatility of the Mach–Zehnder configuration has led to its being used in a range of research topics efforts especially in fundamental quantum mechanics.
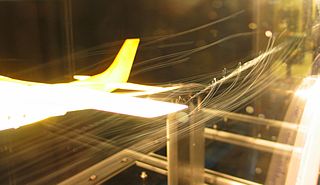
Particle image velocimetry (PIV) is an optical method of flow visualization used in education and research. It is used to obtain instantaneous velocity measurements and related properties in fluids. The fluid is seeded with tracer particles which, for sufficiently small particles, are assumed to faithfully follow the flow dynamics. The fluid with entrained particles is illuminated so that particles are visible. The motion of the seeding particles is used to calculate speed and direction of the flow being studied.

In geotechnical engineering, drilling fluid, also known as drilling mud, is used to aid the drilling of boreholes into the earth. Used while drilling oil and natural gas wells and on exploration drilling rigs, drilling fluids are also used for much simpler boreholes, such as water wells.

Schlieren are optical inhomogeneities in transparent media that are not necessarily visible to the human eye. Schlieren physics developed out of the need to produce high-quality lenses devoid of such inhomogeneities. These inhomogeneities are localized differences in optical path length that cause deviations of light rays, especially by refraction. This light deviation can produce localized brightening, darkening, or even color changes in an image, depending on the directions the rays deviate.

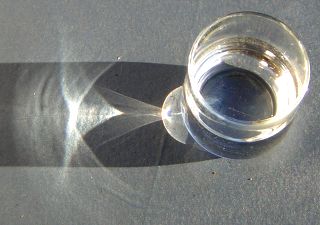
In optics, a caustic or caustic network is the envelope of light rays which have been reflected or refracted by a curved surface or object, or the projection of that envelope of rays on another surface. The caustic is a curve or surface to which each of the light rays is tangent, defining a boundary of an envelope of rays as a curve of concentrated light. In some cases caustics can be seen as patches of light or their bright edges, shapes which often have cusp singularities.
Shadowgraph is an optical method that reveals non-uniformities in transparent media like air, water, or glass. It is related to, but simpler than, the schlieren and schlieren photography methods that perform a similar function. Shadowgraph is a type of flow visualisation.

A refractometer is a laboratory or field device for the measurement of an index of refraction (refractometry). The index of refraction is calculated from the observed refraction angle using Snell's law. For mixtures, the index of refraction then allows the concentration to be determined using mixing rules such as the Gladstone–Dale relation and Lorentz–Lorenz equation.
Nanoparticle tracking analysis (NTA) is a method for visualizing and analyzing particles in liquids that relates the rate of Brownian motion to particle size. The rate of movement is related only to the viscosity and temperature of the liquid; it is not influenced by particle density or refractive index. NTA allows the determination of a size distribution profile of small particles with a diameter of approximately 10–1000 nm in liquid suspension.

Flow visualization or flow visualisation in fluid dynamics is used to make the flow patterns visible, in order to get qualitative or quantitative information on them.
A synthetic seismogram is the result of forward modelling the seismic response of an input earth model, which is defined in terms of 1D, 2D or 3D variations in physical properties. In hydrocarbon exploration this is used to provide a 'tie' between changes in rock properties in a borehole and seismic reflection data at the same location. It can also be used either to test possible interpretation models for 2D and 3D seismic data or to model the response of the predicted geology as an aid to planning a seismic reflection survey. In the processing of wide-angle reflection and refraction (WARR) data, synthetic seismograms are used to further constrain the results of seismic tomography. In earthquake seismology, synthetic seismograms are used either to match the predicted effects of a particular earthquake source fault model with observed seismometer records or to help constrain the Earth's velocity structure. Synthetic seismograms are generated using specialized geophysical software.

Schlieren imaging is a method to visualize density variations in transparent media.
Underwater computer vision is a subfield of computer vision. In recent years, with the development of underwater vehicles, the need to be able to record and process huge amounts of information has become increasingly important. Applications range from inspection of underwater structures for the offshore industry to the identification and counting of fishes for biological research. However, no matter how big the impact of this technology can be to industry and research, it still is in a very early stage of development compared to traditional computer vision. One reason for this is that, the moment the camera goes into the water, a whole new set of challenges appear. On one hand, cameras have to be made waterproof, marine corrosion deteriorates materials quickly and access and modifications to experimental setups are costly, both in time and resources. On the other hand, the physical properties of the water make light behave differently, changing the appearance of a same object with variations of depth, organic material, currents, temperature etc.


