Tropical cyclone observation

Last updated

Surface weather map of the 1935 Labor Day hurricane moving up the west coast of Florida Labor Day hurricane 1935-09-04 weather map.gif
Surface weather map of the 1935 Labor Day hurricane moving up the west coast of Florida

Tropical cyclone observation has been carried out over the past couple of centuries in various ways. The passage of typhoons, hurricanes, as well as other tropical cyclones have been detected by word of mouth from sailors recently coming to port or by radio transmissions from ships at sea, from sediment deposits in near shore estuaries, to the wiping out of cities near the coastline. Since World War II, advances in technology have included using planes to survey the ocean basins, satellites to monitor the world's oceans from outer space using a variety of methods, radars to monitor their progress near the coastline, and recently the introduction of unmanned aerial vehicles to penetrate storms. Recent studies have concentrated on studying hurricane impacts lying within rocks or near shore lake sediments, which are branches of a new field known as paleotempestology. This article details the various methods employed in the creation of the hurricane database, as well as reconstructions necessary for reanalysis of past storms used in projects such as the Atlantic hurricane reanalysis.

Contents

Geological markers of past activity

Stalagmites in caves

Recent studies of the 18O and 13C isotopes found in stalagmites in Belize show that tropical cyclone events can leave markers that can be separated out on a week-by-week basis. The error rate of this type of microanalysis was 1 error in 1,200 sampling points. [1]

Markers in coral

Rocks contain certain isotopes of elements, known as natural tracers, which describe the conditions under which they formed. By studying the calcium carbonate in coral rock, past sea surface temperature and hurricane information can be revealed. Lighter oxygen isotopes (16O) are left behind in coral during periods of very heavy rainfall. [2] Since hurricanes are the main source of extreme rainfall in the tropical oceans, past hurricane events can be dated to the days of their impact on the coral by looking at the increased 18O concentration within the coral. [3]

Sediment deposition in coastal lakes

Kam Biu-Liu, a professor at Louisiana State University, has been studying sediment lying at the bottom of coastal lakes and marshes in order to study the frequency and intensity of hurricanes over the past 5,000 years. [4] Since storm surges sweep coastal sands with them as they progress inland, a layer of sand is left behind in coastal lakes and marshes. Radiocarbon dating is then used to date the layers. [5]

Newspapers

Before the invention of the telegraph in the early to mid-19th century, news was as fast as the quickest horse, stage, or ship. Normally, there was no advance warning of a tropical cyclone impact. However, the situation changed in the 19th century as seafaring people and land-based researchers, such as Father Viñes in Cuba, came up with systematic methods of reading the sky's appearance or the sea state, which could foretell a tropical cyclone's approach up to a couple days in advance.

In China, the abundance of historical documentary records in the form of Fang Zhi (semiofficial local gazettes) offers an extraordinary opportunity for providing a high-resolution historical dataset for the frequency of typhoon strikes. Kam-biu Liu et al. (2001) reconstructed a 1,000-year time series of typhoon landfalls in the Guangdong Province of southern China since AD 975 and found that on a decadal timescale, the twenty-year interval from AD 1660 to 1680 is the most active period on record, with twenty-eight to thirty-seven typhoon landfalls per decade. The variability in typhoon landfalls in Guangdong mimics that observed in other paleoclimatic proxies (e.g., tree rings, ice cores) from China and the northern hemisphere. Remarkably, the two periods of most frequent typhoon strikes in Guangdong (AD 1660-1680, 1850–1880) coincide with two of the coldest and driest periods in northern and central China during the Little Ice Age. [6]

Surface observations

1933 Atlantic hurricane season map.png
2005 Atlantic hurricane season map.png
Maps of the 1933 and 2005 Atlantic hurricane season, two of the most active seasons on record. 28 storms formed in 2005 of which 17 made landfall, while 19 of 21 detected storms formed in 1933 hit the coast. Note that no hurricane was detected on Mid-Atlantic in 1933.

Ship reports

For centuries, people have sailed the world's oceans and seas, and for just as long, they have encountered storms. The worst of the cyclones over the open seas likely took those that observed them into the depths of the oceans. However, some did survive to report harrowing tales. Before the invention of the wireless telegraph in 1905, reports about storms at sea either coincided with their arrival at the coast as ships scrambled into port, or came weeks and months afterwards from remote ports of call. Ship and buoy reports, available since the 1970s, are used in real-time not only for their temperature, pressure, and wind measurements, but also for their sea surface temperature and wave height measurements.

Wind reports from ships at sea have become increasingly based on anemometers, and less so on the Beaufort Scale. This is important to note as the Beaufort Scale underestimates winds at higher wind speeds, indicating ship wind observations taken for older storms are likely to underrepresent their true value. [7]

As Christopher Landsea et al. point out, many tropical cyclones that formed on the open sea and did not affect any coast usually went undetected prior to satellite observation since the 1970s. They estimated an undercount bias of zero to six tropical cyclones per year between 1851 and 1885 and zero to four per year between 1886 and 1910. These undercounts roughly take into account the typical size of tropical cyclones, the density of shipping tracks over the Atlantic basin, and the amount of populated coastline. [8]

Land-based observations

In the early 20th century, forecasting the track of cyclones was still confined to areas of the greatest surface pressure falls, based upon surface weather observations, and climatology. These methods proved to be the cutting edge of tropical cyclone forecasting through the mid 20th century. Land-based surface observations remain invaluable as a source of real-time information at locations near the coastline and inland. Combined with ship observations and newspapers, they formed the total information network for hurricane detection until radiosondes were introduced in 1941 and reconnaissance aircraft began in 1944. [7] Land-based observations of pressure and wind can show how quickly a tropical cyclone is decaying as it moves inland. Their rainfall reports show where significant rainfall is occurring, and can be an alert for possible flooding. With the establishment of the ASOS network in the United States during the 1990s, more locations are reporting around the clock than ever before. [9]

Mobile platforms

Since the 1990s, academic researchers have begun to deploy mobile weather stations fortified to withstand hurricane-force winds. The two largest programs are the Florida Coastal Monitoring Program [10] and the Wind Engineering Mobile Instrumented Tower Experiment. [11] During landfall, the NOAA Hurricane Research Division compares and verifies data from reconnaissance aircraft, including wind speed data taken at flight level and from GPS dropwindsondes and stepped-frequency microwave radiometers, to wind speed data transmitted in real time from weather stations erected near or at the coast. The National Hurricane Center uses the data to evaluate conditions at landfall and to verify forecasts.

Upper air observations

Reconnaissance aircraft

The idea of aircraft reconnaissance of tropical cyclones first was put forth by Captain W. L. Farnsworth of the Galveston Commercial Association in the early 1930s. Supported by the United States Weather Bureau, it passed both the United States Senate and United States House of Representatives in 1936. [12] Since 1944, aircraft have been flying out to sea to find tropical cyclones. Before regular satellite coverage, this was a hit-or-miss affair. Thereafter, aircraft flights into tropical systems became more targeted and precise. Nowadays, a C-130 is used as a hurricane hunter by the Air Force, while the P-3 Orion is used by the National Oceanic and Atmospheric Administration for research projects used to better understand tropical cyclones and improve hurricane forecasts. [9] The implementation of synoptic observation missions by a Gulfstream jet, where dropwindsondes are used to investigate a tropical cyclone's environment, has led to a 15-20 percent reduction in track forecast errors where such missions were present. [13]

Historical aircraft used for weather and hurricane tracking include:

In Canada, the Convair 580 is used by National Research Council to track hurricanes. [14]

Unmanned aerial vehicles

The era of the aerosonde began in 1998, when the Australian Bureau of Meteorology flew an aerosonde into Tropical Cyclone Tiffany. [13] In 2005, Hurricane Ophelia became the first Atlantic tropical cyclone where an unmanned aerial vehicle, known as an aerosonde, mission was used for a tropical cyclone. The first typhoon was penetrated by an aerosonde in 2005 as well. Unlike normal reconnaissance flights, the aerosonde stayed near the surface after a 10-hour flight within the tropical cyclone. [15]

Remote sensing

Radar

Radar image of Hurricane Erika making landfall over Northeastern Mexico Hurricane Erika 2003 Radar.jpg
Radar image of Hurricane Erika making landfall over Northeastern Mexico

During World War II, radar technology was developed to detect aircraft. It soon became apparent that large areas became obscured when significant weather was in the area. In 1957, the National Weather Service established the United States' first radar network to cover the coastline and act as first warning of an impending tropical cyclone. Upgraded in the 1990s to use doppler technology, radar can provide rainfall estimates, wind estimates, possible locations of tornadoes within a system's spiral bands, as well as the center location of a tropical cyclone. [9] The United States operates with a network of 158 Doppler Radars across the country. [16]

Satellite

Beginning with the launching of TIROS-I in April 1960, satellites have been used to look for tropical cyclones. The Dvorak technique was developed from early satellite images of tropical cyclones to determine real-time a tropical cyclone's strength from characteristics seen on satellite imagery. In most tropical cyclone basins, use of the satellite-based Dvorak technique is the primary method used to determine a tropical cyclone's maximum sustained winds. The extent of banding and difference in temperature between the eye and eyewall is used within the technique to assign a maximum sustained wind and pressure. [17] Since the mid-1990s, microwave imagery has been able to determine the center of rotation when that center is obscured by mid to high level cloudiness. Cloud top temperatures are used in real-time to estimate rainfall rates within the cyclone. [9]

Satellite Images of Selected Tropical Storms and Associated T-Number using Dvorak technique
Wilma-17-1315z-T30-discussion1500z.png Dennis-06-1445z-T40-discussion1500z.png Jeanne-22-1945z-T50-discussion2100z.png Emily-14-1915z-T60-discussion15-0300z.png
Tropical Storm Wilma at T3.0 Tropical Storm Dennis at T4.0 Hurricane Jeanne at T5.0 Hurricane Emily at T6.0

See also

Related Research Articles

Storm surge Rise of water surface associated with a low-pressure weather system

A storm surge, storm flood, tidal surge, or storm tide is a coastal flood or tsunami-like phenomenon of rising water commonly associated with low-pressure weather systems, such as cyclones. It is measured as the rise in water level above the normal tidal level, and does not include waves.

1997 Atlantic hurricane season Hurricane season in the Atlantic Ocean

The 1997 Atlantic hurricane season was a below-average season and is the most recent season to feature no tropical cyclones in August – typically one of the most active months. The season officially began on June 1, and lasted until November 30. These dates conventionally delimit the period of each year when most tropical cyclones form in the Atlantic basin. The 1997 season was inactive, with only seven named storms forming, with an additional tropical depression and an unnumbered subtropical storm. It was the first time since the 1961 season that there were no active tropical cyclones in the Atlantic basin during the entire month of August. A strong El Niño is credited with reducing the number of storms in the Atlantic, while increasing the number of storms in the Eastern and Western Pacific basin to 19 and 29 storms, respectively. As is common in El Niño years, tropical cyclogenesis was suppressed in the tropical latitudes, with only two becoming tropical storms south of 25°N.

1974 Atlantic hurricane season Hurricane season in the Atlantic Ocean

The 1974 Atlantic hurricane season featured Hurricane Fifi, the deadliest Atlantic tropical cyclone since the 1900 Galveston hurricane. The season officially began on June 1 and lasted until November 30. These dates conventionally delimit the period of each year when most tropical cyclones form in the Atlantic basin. The first system, a tropical depression, developed over the Bay of Campeche on June 22 and dissipated by June 26. The season had near average activity, with eleven total storms forming, of which four became hurricanes. Two of those four became major hurricanes, which are Category 3 or higher on the Saffir–Simpson scale.

1943 Atlantic hurricane season Hurricane season in the Atlantic Ocean

The 1943 Atlantic hurricane season marked the first deliberate reconnaissance aircraft flights into tropical cyclones. The season officially lasted from June 16 to October 31, which was, at the time, considered the most likely period for tropical cyclone formation in the Atlantic Ocean. A total of ten storms from 1943 are listed in the Atlantic hurricane database, and an eleventh system that affected Florida and Georgia has been identified as a probable tropical depression. The first system of the year, dubbed the "Surprise hurricane", caused severe damage throughout Texas and Louisiana in June, partially because information about its approach was censored in the fray of World War II; the storm caused 19 deaths and $17 million in damage. A major hurricane in mid-August produced hurricane-force winds in Bermuda, and several other tropical cyclones throughout the year resulted in strong winds there. In September, a hurricane impacted the western Gulf Coast of the United States, then a tropical storm struck the Mid-Atlantic. The two storms resulted in $419,000 and $20,000 in damage, respectively; one death was attributed to the latter system. In mid-October, a strong hurricane resulted in flooding and damage to crops throughout the Caribbean; after becoming post-tropical, it contributed to moderate impacts across Nova Scotia.

1993 Pacific hurricane season Hurricane season in the Pacific Ocean

The 1993 Pacific hurricane season was a slightly above-average Pacific hurricane season with seven named storms directly impacting land. The season officially started on May 15 in the eastern Pacific, and on June 1 in the central Pacific, and ended on November 30; these dates conventionally delimit the period during which most tropical cyclones form in the northeastern Pacific Ocean. The first tropical cyclone developed on June 11, over a month after the traditional start of the season. The final named storm of the season, Tropical Storm Norma, dissipated on October 14. The Central Pacific Ocean saw very little tropical activity, with only one cyclone, Hurricane Keoni, developing in that particular region. However, many storms out of the season crossed the threshold into the Central Pacific, many as hurricanes, and even major hurricanes.

2008 Atlantic hurricane season Hurricane season in the Atlantic Ocean

The 2008 Atlantic hurricane season was the most destructive Atlantic hurricane season since 2005, causing over 1,000 deaths and nearly $50 billion in damage. The season ranked as the third costliest ever at the time, but has since fallen to eighth costliest. It was an above-average season, featuring sixteen named storms, eight of which became hurricanes, and five which further became major hurricanes. It officially started on June 1 and ended on November 30. These dates conventionally delimit the period of each year when most tropical cyclones form in the Atlantic basin. However, the formation of Tropical Storm Arthur caused the season to start one day early. It was the only year on record in which a major hurricane existed in every month from July through November in the North Atlantic. Bertha became the longest-lived July tropical cyclone on record for the basin, the first of several long-lived systems during 2008.

Pacific hurricane Mature tropical cyclone that develops within the eastern and central Pacific Ocean

A Pacific hurricane is a mature tropical cyclone that develops within the northeastern and central Pacific Ocean to the east of 180°W, north of the equator. For tropical cyclone warning purposes, the northern Pacific is divided into three regions: the eastern, central, and western, while the southern Pacific is divided into 2 sections, the Australian region and the southern Pacific basin between 160°E and 120°W. Identical phenomena in the western north Pacific are called typhoons. This separation between the two basins has a practical convenience, however, as tropical cyclones rarely form in the central north Pacific due to high vertical wind shear, and few cross the dateline.

Typhoon Type of tropical cyclone that develops in the Northern Hemisphere

A typhoon is a mature tropical cyclone that develops between 180° and 100°E in the Northern Hemisphere. This region is referred to as the Northwestern Pacific Basin, and is the most active tropical cyclone basin on Earth, accounting for almost one-third of the world's annual tropical cyclones. For organizational purposes, the northern Pacific Ocean is divided into three regions: the eastern, central, and western. The Regional Specialized Meteorological Center (RSMC) for tropical cyclone forecasts is in Japan, with other tropical cyclone warning centers for the northwest Pacific in Hawaii, the Philippines and Hong Kong. While the RSMC names each system, the main name list itself is coordinated among 18 countries that have territories threatened by typhoons each year.

1959 Pacific typhoon season

The 1959 Pacific typhoon season was regarded as one of the most devastating years for Pacific typhoons on record, with China, Japan and South Korea sustaining catastrophic losses.

Atlantic hurricane Tropical cyclone that forms in the Atlantic Ocean

An Atlantic hurricane or tropical storm is a tropical cyclone that forms in the Atlantic Ocean, primarily between the months of June and November. A hurricane differs from a cyclone or typhoon only on the basis of location. A hurricane is a storm that occurs in the Atlantic Ocean and northeastern Pacific Ocean, a typhoon occurs in the northwestern Pacific Ocean, and a cyclone occurs in the South Pacific Ocean or Indian Ocean.

Tropical cyclone Rotating storm system with a closed, low-level circulation

A tropical cyclone is a rapidly rotating storm system characterized by a low-pressure center, a closed low-level atmospheric circulation, strong winds, and a spiral arrangement of thunderstorms that produce heavy rain and/or squalls. Depending on its location and strength, a tropical cyclone is referred to by different names, including hurricane, typhoon, tropical storm, cyclonic storm, tropical depression, or simply cyclone. A hurricane is a tropical cyclone that occurs in the Atlantic Ocean and northeastern Pacific Ocean, and a typhoon occurs in the northwestern Pacific Ocean; in the south Pacific or Indian Ocean, comparable storms are referred to simply as "tropical cyclones" or "severe cyclonic storms".

Tropical cyclone rainfall forecasting

Tropical cyclone rainfall forecasting involves using scientific models and other tools to predict the precipitation expected in tropical cyclones such as hurricanes and typhoons. Knowledge of tropical cyclone rainfall climatology is helpful in the determination of a tropical cyclone rainfall forecast. More rainfall falls in advance of the center of the cyclone than in its wake. The heaviest rainfall falls within its central dense overcast and eyewall. Slow moving tropical cyclones, like Hurricane Danny and Hurricane Wilma, can lead to the highest rainfall amounts due to prolonged heavy rains over a specific location. However, vertical wind shear leads to decreased rainfall amounts, as rainfall is favored downshear and slightly left of the center and the upshear side is left devoid of rainfall. The presence of hills or mountains near the coast, as is the case across much of Mexico, Haiti, the Dominican Republic, much of Central America, Madagascar, Réunion, China, and Japan act to magnify amounts on their windward side due to forced ascent causing heavy rainfall in the mountains. A strong system moving through the mid latitudes, such as a cold front, can lead to high amounts from tropical systems, occurring well in advance of its center. Movement of a tropical cyclone over cool water will also limit its rainfall potential. A combination of factors can lead to exceptionally high rainfall amounts, as was seen during Hurricane Mitch in Central America.

Effects of tropical cyclones Events including rain, wind, storm surge and tornadoes

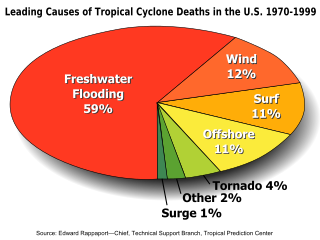
The effects of tropical cyclones include heavy rain, strong wind, large storm surges near landfall, and tornadoes. The destruction from a tropical cyclone, such as a hurricane or tropical storm, depends mainly on its intensity, its size, and its location. Tropical cyclones remove forest canopy as well as change the landscape near coastal areas, by moving and reshaping sand dunes and causing extensive erosion along the coast. Even well inland, heavy rainfall can lead to landslides in mountainous areas. Their effects can be sensed over time by studying the concentration of the Oxygen-18 isotope within caves.

Tropical cyclone forecasting is the science of forecasting where a tropical cyclone's center, and its effects, are expected to be at some point in the future. There are several elements to tropical cyclone forecasting: track forecasting, intensity forecasting, rainfall forecasting, storm surge, tornado, and seasonal forecasting. While skill is increasing in regard to track forecasting, intensity forecasting skill remains unchanged over the past several years. Seasonal forecasting began in the 1980s in the Atlantic basin and has spread into other basins in the years since.

The maximum sustained wind associated with a tropical cyclone is a common indicator of the intensity of the storm. Within a mature tropical cyclone, it is found within the eyewall at a distance defined as the radius of maximum wind, or RMW. Unlike gusts, the value of these winds are determined via their sampling and averaging the sampled results over a period of time. Wind measuring has been standardized globally to reflect the winds at 10 metres (33 ft) above the Earth's surface, and the maximum sustained wind represents the highest average wind over either a one-minute (US) or ten-minute time span, anywhere within the tropical cyclone. Surface winds are highly variable due to friction between the atmosphere and the Earth's surface, as well as near hills and mountains over land.

2009 Atlantic hurricane season Hurricane season in the Atlantic Ocean

The 2009 Atlantic hurricane season was a below-average Atlantic hurricane season that produced eleven tropical cyclones, nine named storms, three hurricanes, and two major hurricanes. It officially began on June 1 and ended on November 30, dates that conventionally delimit the period of each year when most tropical cyclones develop in the Atlantic basin. The season's first tropical cyclone, Tropical Depression One, developed on May 28, while the final storm, Hurricane Ida, dissipated on November 10. The most intense hurricane, Bill, was a powerful Cape Verde-type hurricane that affected areas from the Leeward Islands to Newfoundland. The season featured the lowest number of tropical cyclones since the 1997 season, and only one system, Claudette, made landfall in the United States. Forming from the interaction of a tropical wave and an upper-level low, Claudette made landfall on the Florida Panhandle with maximum sustained winds of 45 mph (70 km/h) before quickly dissipating over Alabama. The storm killed two people and caused $228,000 in damage.

Tropical cyclones and climate change Impact of climate change on the intensity, frequency and other factors of tropical cyclones

Due to climate change, tropical cyclones are likely to increase in intensity, cause increased rainfall, and have larger storm surges, but might also lead fewer of them globally. Tropical cyclones may also intensify more rapidly, and occur at higher latitudes. These changes are driven by rising sea temperatures and increased maximum water vapour content of the atmosphere as the air heats up. The 2018 U.S. National Climate Change Assessment reported that "increases in greenhouse gases and decrease in air pollution have contributed to increases in Atlantic hurricane activity since 1970".

Glossary of tropical cyclone terms Wikipedia glossary

The following is a glossary of tropical cyclone terms.

Cyclone Ann Category 2 South Pacific and Australian region cyclone in 2019

Tropical Cyclone Ann was a small off-season tropical cyclone that brought minor impacts to the Solomon Islands, Far North Queensland and coastal regions of the Northern Territory's Top End during May 2019. Ann was the twenty-fifth tropical low, eleventh tropical cyclone, ninth Category 2 tropical cyclone and second off-season tropical cyclone of the 2018–19 Australian region cyclone season. The system developed from a tropical low that formed on 7 May in the South Pacific cyclone region. The low gradually intensified while moving southwards, and strengthened into a tropical cyclone on 11 May. The storm then turned to the west-northwest and continued to strengthen over the Coral Sea. Ann reached peak intensity on 12 May as a Category 2 tropical cyclone on the Australian scale, with ten-minute sustained winds of 95 kilometres per hour (59 mph) and a central barometric pressure of 993 hPa (29.32 inHg). One-minute sustained winds of 110 kilometres per hour (68 mph) made Ann equivalent to a strong tropical storm on the Saffir–Simpson hurricane wind scale. The storm began to decay soon afterwards, and weakened to a gale-force tropical low on 14 May. Ann made landfall near Lockhart River on Cape York Peninsula on 15 May, before re-emerging over water a few hours later. Ann maintained a steady west-northwestwards track for several days before dissipating as a tropical low near East Timor on 18 May.

References

  1. Frappier, Amy Benoit; Sahagian, Dork; Carpenter, Scott J.; González, Luis A.; Frappier Brian R. (2007). "Stalagmite stable isotope record of recent tropical cyclone events". Geology. 35 (2): 111–114. Bibcode:2007Geo....35..111B. doi:10.1130/G23145A.1.
  2. Nobu Shimizu. If Rocks Could Talk... Retrieved on 2006-12-09.
  3. Anne L. Cohen and Graham D. Layne. Seeking a hurricane signature in coral skeleton. Retrieved on 2006-12-09.
  4. Liu, Kam-biu; Fearn, Miriam L. (2000). "Reconstruction of Prehistoric Landfall Frequencies of Catastrophic Hurricanes in Northwestern Florida from Lake Sediment Records". Quaternary Research. 54 (2): 238–245. Bibcode:2000QuRes..54..238L. doi:10.1006/qres.2000.2166. S2CID   140723229.
  5. Louisiana State University. LSU Professor looks for link between hurricanes and coastal fires: Evidence suggests risk for fire may be higher after catastrophic storms. Archived 2007-09-27 at the Wayback Machine Retrieved on 2006-12-09.
  6. Kam-biu Liu; Caiming Shen; Kin-sheun Louie (2001). "A 1,000-Year History of Typhoon Landfalls in Guangdong, Southern China, Reconstructed from Chinese Historical Documentary Records". Annals of the Association of American Geographers. 91 (3): 453–464. doi:10.1111/0004-5608.00253. S2CID   53066209.
  7. 1 2 Brian R. Jarvinen, Charles J. Neumann, and Mary A. S. Davis. A Tropical Cyclone Data Tape For the North Atlantic Basin, 1886-1983: Contents, Limitations, and Uses. Retrieved on 2006-12-09.
  8. Landsea, C. W. (2004). "The Atlantic hurricane database re-analysis project: Documentation for the 1851–1910 alterations and additions to the HURDAT database". In Murname, R. J.; Liu, K.-B. (eds.). Hurricanes and Typhoons: Past, Present and Future. New York: Columbia University Press. pp. 177–221. ISBN   0-231-12388-4.
  9. 1 2 3 4 Central Pacific Hurricane Center. Observations. Retrieved on 2006-12-09.
  10. Florida Coastal Monitoring Program. "Project Overview". University of Florida. Archived from the original on January 17, 2006. Retrieved 2006-03-30.
  11. Hurricane Research Team. "Texas Tech Hurricane Research Team Project History and Information". Texas Tech University. Archived from the original on September 1, 2006. Retrieved 2006-03-30.
  12. Associated Press. STORM PATROL BILL PASSED TO PRESIDENT. [ permanent dead link ] Retrieved on 2008-06-06.
  13. 1 2 B. Geerts. Tropical cyclone track forecasting. Retrieved on 2007-04-10.
  14. "Convair 580 takes on hurricane tracking role". National Research Council. 2005-03-03. Archived from the original on 2005-12-19. Retrieved 2008-09-03.
  15. Aerosonde. Aerosonde first UAV to Recce a Tropical Cyclone. Retrieved on 2006-12-09.
  16. "Organization | National Oceanic and Atmospheric Administration". Noaa.gov. 2016-03-30. Retrieved 2016-04-03.
  17. Atlantic Oceanographic and Meteorological Laboratory. Subject: H1) What is the Dvorak technique and how is it used? Retrieved on 2006-12-08.