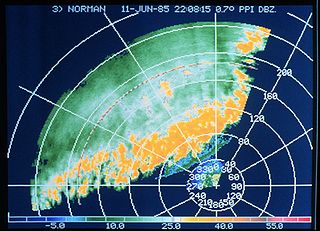
A rainband is a cloud and precipitation structure associated with an area of rainfall which is significantly elongated. Rainbands in tropical cyclones can be either stratiform or convective and are curved in shape. They consist of showers and thunderstorms, and along with the eyewall and the eye, they make up a tropical cyclone. The extent of rainbands around a tropical cyclone can help determine the cyclone's intensity.

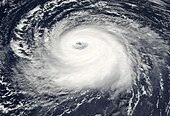
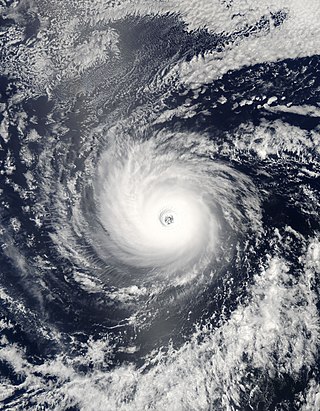
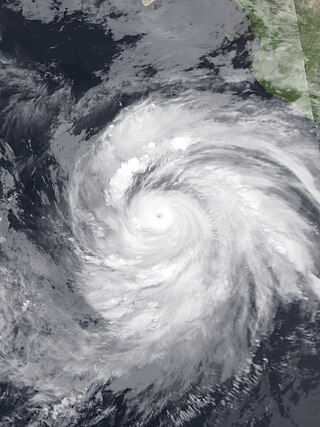
An annular tropical cyclone is a tropical cyclone that features a normal to large, symmetric eye surrounded by a thick and uniform ring of intense convection, often having a relative lack of discrete rainbands, and bearing a symmetric appearance in general. As a result, the appearance of an annular tropical cyclone can be referred to as akin to a tire or doughnut. Annular characteristics can be attained as tropical cyclones intensify; however, outside the processes that drive the transition from asymmetric systems to annular systems and the abnormal resistance to negative environmental factors found in storms with annular features, annular tropical cyclones behave similarly to asymmetric storms. Most research related to annular tropical cyclones is limited to satellite imagery and aircraft reconnaissance as the conditions thought to give rise to annular characteristics normally occur over open water, well removed from landmasses where surface observations are possible.

The eye is a region of mostly calm weather at the center of a tropical cyclone. The eye of a storm is a roughly circular area, typically 30–65 kilometers in diameter. It is surrounded by the eyewall, a ring of towering thunderstorms where the most severe weather and highest winds of the cyclone occur. The cyclone's lowest barometric pressure occurs in the eye and can be as much as 15 percent lower than the pressure outside the storm.

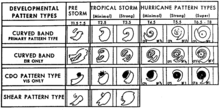
The Dvorak technique is a widely used system to estimate tropical cyclone intensity based solely on visible and infrared satellite images. Within the Dvorak satellite strength estimate for tropical cyclones, there are several visual patterns that a cyclone may take on which define the upper and lower bounds on its intensity. The primary patterns used are curved band pattern (T1.0-T4.5), shear pattern (T1.5–T3.5), central dense overcast (CDO) pattern (T2.5–T5.0), central cold cover (CCC) pattern, banding eye pattern (T4.0–T4.5), and eye pattern (T4.5–T8.0).

A tropical cyclone is a rapidly rotating storm system with a low-pressure center, a closed low-level atmospheric circulation, strong winds, and a spiral arrangement of thunderstorms that produce heavy rain and squalls. Depending on its location and strength, a tropical cyclone is called a hurricane, typhoon, tropical storm, cyclonic storm, tropical depression, or simply cyclone. A hurricane is a strong tropical cyclone that occurs in the Atlantic Ocean or northeastern Pacific Ocean. A typhoon occurs in the northwestern Pacific Ocean. In the Indian Ocean and South Pacific, comparable storms are referred to as "tropical cyclones". In modern times, on average around 80 to 90 named tropical cyclones form each year around the world, over half of which develop hurricane-force winds of 65 kn or more.

Hurricane Dora was one of few tropical cyclones to track across all three north Pacific basins and the first since Hurricane John in 1994. The fourth named storm, third hurricane, and second major hurricane of the 1999 Pacific hurricane season, Dora developed on August 6 from a tropical wave to the south of Mexico. Forming as a tropical depression, the system gradually strengthened and was upgraded to Tropical Storm Dora later that day. Thereafter Dora began heading in a steadily westward direction, before becoming a hurricane on August 8. Amid warm sea surface temperatures and low wind shear, the storm continued to intensify, eventually peaking as a 140 mph (220 km/h) Category 4 hurricane on August 12.

Hurricane Adolph was the first and one of only two East Pacific hurricanes in May to reach Category 4 strength on the Saffir-Simpson Hurricane Scale since record keeping began in the East Pacific, with the other being Amanda of 2014. Adolph was the first depression of the season, forming on May 25; it became a hurricane two days later. After rapidly intensifying, Adolph became the most powerful storm in terms of maximum sustained winds this season, along with Hurricane Juliette. The storm briefly threatened land before dissipating on June 1, after moving over colder waters.

Hurricane Guillermo was the ninth-most intense Pacific hurricane on record, attaining peak winds of 160 mph (260 km/h) and a barometric pressure of 919 hPa (27.14 inHg). Forming out of a tropical wave on July 30, 1997, roughly 345 mi (555 km) south of Salina Cruz, Mexico, Guillermo tracked in a steady west-northwestward direction while intensifying. The system reached hurricane status by August 1 before undergoing rapid intensification the following day. At the end of this phase, the storm attained its peak intensity as a powerful Category 5 hurricane. The storm began to weaken during the afternoon of August 5 and was downgraded to a tropical storm on August 8. Once entering the Central Pacific Hurricane Center's area of responsibility, Guillermo briefly weakened to a tropical depression before re-attaining tropical storm status. On August 15, the storm reached an unusually high latitude of 41.8°N before transitioning into an extratropical cyclone. The remnants persisted for more than a week as they tracked towards the northeast and later south and east before being absorbed by a larger extratropical system off the coast of California on August 24.

The radius of maximum wind (RMW) is the distance between the center of a cyclone and its band of strongest winds. It is a parameter in atmospheric dynamics and tropical cyclone forecasting. The highest rainfall rates occur near the RMW of tropical cyclones. The extent of a cyclone's storm surge and its maximum potential intensity can be determined using the RMW. As maximum sustained winds increase, the RMW decreases. Recently, RMW has been used in descriptions of tornadoes. When designing buildings to prevent against failure from atmospheric pressure change, RMW can be used in the calculations.
Hurricane Daniel was the second strongest hurricane of the 2006 Pacific hurricane season. The storm affected Hawaii late in its lifetime, causing moderate rainfall and minor damage. The fourth named storm, third hurricane, and second major hurricane of the season, Daniel originated on July 16 from a tropical wave off the coast of Mexico. It tracked westward, intensifying steadily to reach peak winds of 150 mph (240 km/h) on July 22. At the time, the characteristics of the cyclone resembled those of an annular hurricane. Daniel gradually weakened as it entered an area of cooler water temperatures and increased wind shear, and after crossing into the Central Pacific Ocean, it quickly degenerated into a remnant low on July 26, before dissipating two days later.
The maximum sustained wind associated with a tropical cyclone is a common indicator of the intensity of the storm. Within a mature tropical cyclone, it is found within the eyewall at a distance defined as the radius of maximum wind, or RMW. Unlike gusts, the value of these winds are determined via their sampling and averaging the sampled results over a period of time. Wind measuring has been standardized globally to reflect the winds at 10 metres (33 ft) above mean sea level, and the maximum sustained wind represents the highest average wind over either a one-minute (US) or ten-minute time span, anywhere within the tropical cyclone. Surface winds are highly variable due to friction between the atmosphere and the Earth's surface, as well as near hills and mountains over land.
Hurricane Elida was the first of three tropical cyclones of the 2002 Pacific hurricane season to reach Category 5 strength on the Saffir-Simpson Hurricane Scale. Elida was one of only sixteen known Category 5 hurricanes in the eastern north Pacific tropical cyclone basin, east of the International Date Line and north of the Equator. Although heavy waves affected the Mexican coastline due to Elida, no damages or casualties were reported in relation to the hurricane.
A mesovortex is a small-scale rotational feature found in a convective storm, such as a quasi-linear convective system, a supercell, or the eyewall of a tropical cyclone. Mesovortices range in diameter from tens of miles to a mile or less and can be immensely intense.

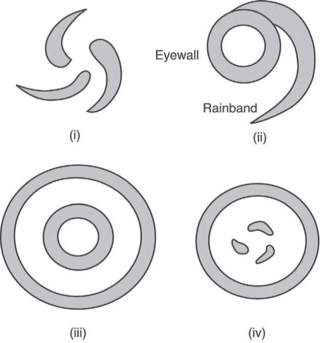
In meteorology, eyewall replacement cycles, also called concentric eyewall cycles, naturally occur in intense tropical cyclones, generally with winds greater than 185 km/h (115 mph), or major hurricanes. When tropical cyclones reach this intensity, and the eyewall contracts are already small, some of the outer rainbands may strengthen and organize into a ring of thunderstorms—a new, outer eyewall—that slowly moves inward and robs the original, inner eyewall of its needed moisture and angular momentum. Since the strongest winds are in a tropical cyclone's eyewall, the storm usually weakens during this phase, as the inner wall is "choked" by the outer wall. Eventually the outer eyewall replaces the inner one completely, and the storm may re-intensify.

The following is a glossary of tropical cyclone terms.
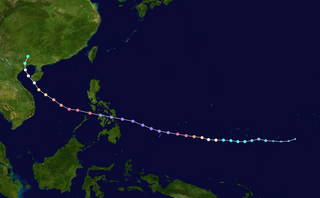
Typhoon Haiyan's meteorological history began with its origins as a tropical disturbance east-southeast of Pohnpei and lasted until its degeneration as a tropical cyclone over southern China. The thirteenth typhoon of the 2013 Pacific typhoon season, Haiyan originated from an area of low pressure several hundred kilometers east-southeast of Pohnpei in the Federated States of Micronesia on November 2. Tracking generally westward, environmental conditions favored tropical cyclogenesis and the system developed into a tropical depression the following day. After becoming a tropical storm and attaining the name Haiyan at 0000 UTC on November 4, the system began a period of rapid intensification that brought it to typhoon intensity by 1800 UTC on November 5. By November 6, the Joint Typhoon Warning Center (JTWC) assessed the system as a Category 5-equivalent super typhoon on the Saffir–Simpson hurricane wind scale; the storm passed over the island of Kayangel in Palau shortly after attaining this strength.

Hurricane Patricia was the most intense tropical cyclone ever recorded in the Western Hemisphere and the second-most intense worldwide in terms of barometric pressure. It also featured the highest one-minute maximum sustained winds ever recorded in a tropical cyclone. Originating from a sprawling disturbance near the Gulf of Tehuantepec in mid-October 2015, Patricia was first classified a tropical depression on October 20. Initial development was slow, with only modest strengthening within the first day of its classification. The system later became a tropical storm and was named Patricia, the twenty-fourth named storm of the annual hurricane season. Exceptionally favorable environmental conditions fueled explosive intensification on October 22. A well-defined eye developed within an intense central dense overcast and Patricia grew from a tropical storm to a Category 5 hurricane in just 24 hours—a near-record pace. The magnitude of intensification was poorly forecast and both forecast models and meteorologists suffered from record-high prediction errors.
The Hurricane Rainband and Intensity Change Experiment (RAINEX) is a project to improve hurricane intensity forecasting via measuring interactions between rainbands and the eyewalls of tropical cyclones. The experiment was planned for the 2005 Atlantic hurricane season. This coincidence of RAINEX with the 2005 Atlantic hurricane season led to the study and exploration of infamous hurricanes Katrina, Ophelia, and Rita. Where Hurricane Katrina and Hurricane Rita would go on to cause major damage to the US Gulf coast, Hurricane Ophelia provided an interesting contrast to these powerful cyclones as it never developed greater than a Category 1.
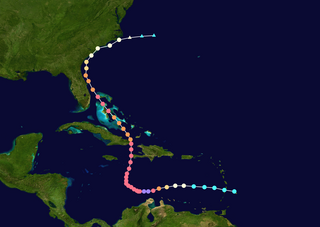
Hurricane Matthew was the first Category 5 Atlantic hurricane since Felix in 2007 and the southernmost Category 5 Atlantic hurricane on record. The system originated from a tropical wave that emerged off the west coast of Africa on September 22, and ultimately dissipated as an extratropical cyclone near Atlantic Canada on October 10. Late on September 29, it began a period of explosive intensification that brought it to Category 5 strength early on October 1. It weakened slightly and remained a Category 4 until its landfalls in Haiti and Cuba, afterwards it traversed through the Bahamas and paralleled the coast of Florida until making landfall in South Carolina as a Category 1 hurricane. Matthew later transitioned into a post-tropical cyclone on October 10.

Hurricane Hector was a powerful and long-lasting tropical cyclone that traversed the Pacific Ocean during late July and August 2018. Hector was the eighth named storm, fourth hurricane, and third major hurricane of the 2018 Pacific hurricane season. It originated from a disturbance that was located north of South America on July 22. The disturbance tracked westward and entered the eastern Pacific around July 25. It gradually organized over the next several days, becoming a tropical depression at 12:00 UTC on July 31. The system was upgraded into a tropical storm about 12 hours later and received the name Hector. Throughout most of its existence, the cyclone traveled due west or slightly north of west. A favorable environment allowed the fledgling tropical storm to rapidly intensify to its initial peak as a Category 2 hurricane by 18:00 UTC on August 2. Wind shear caused Hector to weaken for a brief period before the storm began to strengthen again. Hector reached Category 3 status by 00:00 UTC on August 4 and went through an eyewall replacement cycle soon after, which caused the intensification to halt. After the replacement cycle, the cyclone continued to organize, developing a well-defined eye surrounded by cold cloud tops.