Polar vortex

Last updated
The Arctic tropospheric polar vortex
November2013 polar vortex geopotentialheight mean Large.jpg
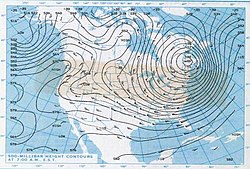
A strong tropospheric polar vortex configuration in November 2013
Jan52014 polar vortex geopotentialheight mean Large.jpg
A more typical weak tropospheric polar vortex on January 5, 2014

A circumpolar vortex, or simply polar vortex, is a large region of cold, rotating air; polar vortices encircle both of Earth's polar regions. Polar vortices also exist on other rotating, low-obliquity planetary bodies. [1] The term polar vortex can be used to describe two distinct phenomena; the stratospheric polar vortex, and the tropospheric polar vortex. The stratospheric and tropospheric polar vortices both rotate in the direction of the Earth's spin, but they are distinct phenomena that have different sizes, structures, seasonal cycles, and impacts on weather.

Contents

The stratospheric polar vortex is an area of high-speed, cyclonically rotating winds around 15 km to 50 km high, poleward of 50°, and is strongest in winter. It forms in Autumn when Arctic or Antarctic temperatures cool rapidly as the polar night begins. The increased temperature difference between the pole and the tropics causes strong winds, and the Coriolis effect causes the vortex to spin up. The stratospheric polar vortex breaks down in Spring as the polar night ends. A sudden stratospheric warming (SSW) is an event that occurs when the stratospheric vortex breaks down during winter, and can have significant impacts on surface weather.[ citation needed ]

The tropospheric polar vortex is often defined as the area poleward of the tropospheric jet stream. The equatorward edge is around 40° to 50°, and it extends from the surface up to around 10 km to 15 km. Its yearly cycle differs from the stratospheric vortex because the tropospheric vortex exists all year, but is similar to the stratospheric vortex since it is also strongest in winter when the polar regions are coldest.

The tropospheric polar vortex was first described as early as 1853. [2] The stratospheric vortex's SSWs were discovered in 1952 with radiosonde observations at altitudes higher than 20 km. [3] The tropospheric polar vortex was mentioned frequently in the news and weather media in the cold North American winter of 2013–2014, popularizing the term as an explanation of very cold temperatures. The tropospheric vortex increased in public visibility in 2021 as a result of extreme frigid temperatures in the central United States, with experts linking its effects to climate change. [4]

Ozone depletion occurs most heavily within the polar vortices – particularly over the Southern Hemisphere – reaching a maximum depletion in the spring.

Arctic and Antarctic vortices

Northern Hemisphere

When the tropospheric vortex of the Arctic is strong, it has a well defined and nearly circular shape. There is a single vortex with a jet stream that is well constrained near the polar front, and the Arctic air is well contained. When this northern tropospheric vortex weakens, it breaks into two or more smaller vortices, the strongest of which are near Baffin Island, Nunavut, and the others over northeast Siberia. When it is very weak, the flow of Arctic air becomes more disorganized, and masses of cold Arctic air can push equatorward, bringing with them a rapid and sharp temperature drop. [5]

A deep freeze that gripped much of the United States and Canada in late January 2019 has been blamed on a "polar vortex". This is not the scientifically correct use of the term polar vortex, but instead is referring to outbreaks of cold Arctic air caused by a weakened polar vortex. The US National Weather Service warned that frostbite is possible within just 10 minutes of being outside in such extreme temperatures, and hundreds of schools, colleges, and universities in the affected areas were closed. Around 21 people died in US due to severe frostbite. [6] [7] States within the midwest region of the United States had windchills just above -50 °F (-45 °C). The Polar vortex is also thought to have had effects in Europe. For example, the 2013–14 United Kingdom winter floods were blamed on the Polar vortex bringing severe cold in the United States and Canada. [8] Similarly, the severe cold in the United Kingdom in the winters of 2009–10 and 2010–11 were also blamed on the Polar vortex. [9]

Southern Hemisphere

The Antarctic vortex of the Southern Hemisphere is a single low-pressure zone that is found near the edge of the Ross ice shelf, near 160 west longitude. When the polar vortex is strong, the mid-latitude Westerlies (winds at the surface level between 30° and 60° latitude from the west) increase in strength and are persistent. When the polar vortex is weak, high-pressure zones of the mid-latitudes may push poleward, moving the polar vortex, jet stream, and polar front equatorward. The jet stream is seen to "buckle" and deviate south. This rapidly brings cold dry air into contact with the warm, moist air of the mid-latitudes, resulting in a rapid and dramatic change of weather known as a "cold snap". [10]

In Australia, the polar vortex, known there as a "polar blast" or "polar plunge", is a cold front that drags air from Antarctica which brings rain showers, snow (typically inland, with blizzards occurring in the highlands), gusty icy winds, and hail in the south-eastern parts of the country, such as in Victoria, Tasmania, the southeast coast of South Australia and the southern half of New South Wales (but only on the windward side of the Great Dividing Range, whereas the leeward side will be affected by foehn winds). [11] [12]

Identification

The bases of the two polar vortices are located in the middle and upper troposphere and extend into the stratosphere. Beneath that lies a large mass of cold, dense Arctic air. The interface between the cold dry air mass of the pole and the warm moist air mass farther south defines the location of the polar front. The polar front is centered roughly at 60° latitude. A polar vortex strengthens in the winter and weakens in the summer because of its dependence on the temperature difference between the equator and the poles. [13] [ self-published source? ]

Polar cyclones are low-pressure zones embedded within the polar air masses, and exist year-round. The stratospheric polar vortex develops at latitudes above the subtropical jet stream. [14] Horizontally, most polar vortices have a radius of less than 1,000 kilometres (620 mi). [15] Since polar vortices exist from the stratosphere downward into the mid-troposphere, [5] a variety of heights/pressure levels are used to mark its position. The 50 hPa pressure surface is most often used to identify its stratospheric location. [16] At the level of the tropopause, the extent of closed contours of potential temperature can be used to determine its strength. Others have used levels down to the 500 hPa pressure level (about 5,460 metres (17,910 ft) above sea level during the winter) to identify the polar vortex. [17]

Duration and strength

Polar vortex and weather impacts due to stratospheric warming Polarvortexwinter.jpg
Polar vortex and weather impacts due to stratospheric warming

Polar vortices are weakest during summer and strongest during winter. Extratropical cyclones that migrate into higher latitudes when the polar vortex is weak can disrupt the single vortex creating smaller vortices (cold-core lows) within the polar air mass. [18] Those individual vortices can persist for more than a month. [15]

Volcanic eruptions in the tropics can lead to a stronger polar vortex during winter for as long as two years afterwards. [19] The strength and position of the polar vortex shapes the flow pattern in a broad area about it. An index which is used in the northern hemisphere to gauge its magnitude is the Arctic oscillation. [20]

When the Arctic vortex is at its strongest, there is a single vortex, but normally, the Arctic vortex is elongated in shape, with two cyclone centers, one over Baffin Island in Canada and the other over northeast Siberia. When the Arctic pattern is at its weakest, subtropic air masses can intrude poleward causing the Arctic air masses to move equatorward, as during the Winter 1985 Arctic outbreak. [21] The Antarctic polar vortex is more pronounced and persistent than the Arctic one. In the Arctic the distribution of land masses at high latitudes in the Northern Hemisphere gives rise to Rossby waves which contribute to the breakdown of the polar vortex, whereas in the Southern Hemisphere the vortex is less disturbed. The breakdown of the polar vortex is an extreme event known as a sudden stratospheric warming, here the vortex completely breaks down and an associated warming of 30–50 °C (54–90 °F)[ clarification needed ] over a few days can occur.

The waxing and waning of the polar vortex is driven by the movement of mass and the transfer of heat in the polar region. In the autumn, the circumpolar winds increase in speed and the polar vortex rises into the stratosphere. The result is that the polar air forms a coherent rotating air mass: the polar vortex. As winter approaches, the vortex core cools, the winds decrease, and the vortex energy declines. Once late winter and early spring approach the vortex is at its weakest. As a result, during late winter, large fragments of the vortex air can be diverted into lower latitudes by stronger weather systems intruding from those latitudes. In the lowest level of the stratosphere, strong potential vorticity gradients remain, and the majority of that air remains confined within the polar air mass into December in the Southern Hemisphere and April in the Northern Hemisphere, well after the breakup of the vortex in the mid-stratosphere. [22]

The breakup of the northern polar vortex occurs between mid March to mid May. This event signifies the transition from winter to spring, and has impacts on the hydrological cycle, growing seasons of vegetation, and overall ecosystem productivity. The timing of the transition also influences changes in sea ice, ozone, air temperature, and cloudiness. Early and late polar breakup episodes have occurred, due to variations in the stratospheric flow structure and upward spreading of planetary waves from the troposphere.[ clarification needed ] As a result of increased waves into the vortex, the vortex experiences more rapid warming than normal, resulting in an earlier breakup and spring. When the breakup comes early, it is characterized by[ clarification needed ] with persistent of remnants of the vortex. When the breakup is late, the remnants dissipate rapidly. When the breakup is early, there is one warming period from late February to middle March. When the breakup is late, there are two warming periods, one January, and one in March. Zonal mean temperature, wind, and geopotential height exert varying deviations from their normal values before and after early breakups, while the deviations remain constant before and after late breakups. Scientists are connecting a delay in the Arctic vortex breakup with a reduction of planetary wave activities, few stratospheric sudden warming events, and depletion of ozone. [23] [24] [ clarification needed ]

Low pressure area over Quebec, Maine, and New Brunswick, part of the northern polar vortex weakening, on the record-setting cold morning of January 21, 1985 Polarvortexjan211985.jpg
Low pressure area over Quebec, Maine, and New Brunswick, part of the northern polar vortex weakening, on the record-setting cold morning of January 21, 1985

Sudden stratospheric warming events are associated with weaker polar vortices. This warming of stratospheric air can reverse the circulation in the Arctic Polar Vortex from counter-clockwise to clockwise. [25] These changes aloft force changes in the troposphere below. [26] An example of an effect on the troposphere is the change in speed of the Atlantic Ocean circulation pattern. A soft spot just south of Greenland is where the initial step of downwelling occurs, nicknamed the "Achilles Heel of the North Atlantic". Small amounts of heating or cooling traveling from the polar vortex can trigger or delay downwelling, altering the Gulf Stream Current of the Atlantic, and the speed of other ocean currents. Since all other oceans depend on the Atlantic Ocean's movement of heat energy, climates across the planet can be dramatically affected. The weakening or strengthening of the polar vortex can alter the sea circulation more than a mile beneath the waves. [27] Strengthening storm systems within the troposphere that cool the poles, intensify the polar vortex. La Niña–related climate anomalies significantly strengthen the polar vortex. [28] Intensification of the polar vortex produces changes in relative humidity as downward intrusions of dry, stratospheric air enter the vortex core. With a strengthening of the vortex comes a longwave cooling due to a decrease in water vapor concentration near the vortex. The decreased water content is a result of a lower tropopause within the vortex, which places dry stratospheric air above moist tropospheric air. [29] Instability is caused when the vortex tube, the line of concentrated vorticity, is displaced. When this occurs, the vortex rings become more unstable and prone to shifting by planetary waves. The planetary wave activity in both hemispheres varies year-to-year, producing a corresponding response in the strength and temperature of the polar vortex. [30] The number of waves around the perimeter of the vortex are related to the core size; as the vortex core decreases, the number of waves increase. [31]

The degree of the mixing of polar and mid-latitude air depends on the evolution and position of the polar night jet. In general, the mixing is less inside the vortex than outside. Mixing occurs with unstable planetary waves that are characteristic of the middle and upper stratosphere in winter. Prior to vortex breakdown, there is little transport of air out of the Arctic Polar Vortex due to strong barriers above 420 km (261 miles). The polar night jet which exists below this, is weak in the early winter. As a result, it does not deviate any descending polar air, which then mixes with air in the mid-latitudes. In the late winter, air parcels do not descend as much, reducing mixing. [32] After the vortex is broken up, the ex-vortex air is dispersed into the middle latitudes within a month. [33]

Sometimes, a mass of the polar vortex breaks off before the end of the final warming period. If large enough, the piece can move into Canada and the Midwestern, Central, Southern, and Northeastern United States. This diversion of the polar vortex can occur due to the displacement of the polar jet stream; for example, the significant northwestward direction of the polar jet stream in the western part of the United States during the winters of 2013–2014, and 2014–2015. This caused warm, dry conditions in the west, and cold, snowy conditions in the north-central and northeast. [34] Occasionally, the high-pressure air mass, called the Greenland Block, can cause the polar vortex to divert to the south, rather than follow its normal path over the North Atlantic. [35]

Extreme weather

A study in 2001 found that stratospheric circulation can have anomalous effects on weather regimes. [36] In the same year, researchers found a statistical correlation between weak polar vortex and outbreaks of severe cold in the Northern Hemisphere. [37] [38] In later years, scientists identified interactions with Arctic sea ice decline, reduced snow cover, evapotranspiration patterns, NAO anomalies or weather anomalies which are linked to the polar vortex and jet stream configuration. [36] [38]

Climate change

Since the early 2000s, climate models have consistently identified that global warming will gradually push jet streams poleward. In 2008, this was confirmed by observational evidence, which proved that from 1979 to 2001, the northern jet stream moved northward at an average rate of 2.01 kilometres (1.25 mi) per year, with a similar trend in the Southern Hemisphere jet stream. [39] [40] Climate scientists have hypothesized that the jet stream will also gradually weaken as a result of global warming. Trends such as Arctic sea ice decline, reduced snow cover, evapotranspiration patterns, and other weather anomalies have caused the Arctic to heat up faster than other parts of the globe, in what is known as the Arctic amplification. In 2021-2022, it was found that since 1979, the warming within the Arctic Circle has been nearly four times faster than the global average, [41] [42] and some hotspots in the Barents Sea area warmed up to seven times faster than the global average. [43] [44] While the Arctic remains one of the coldest places on Earth today, the temperature gradient between it and the warmer parts of the globe will continue to diminish with every decade of global warming as the result of this amplification. If this gradient has a strong influence on the jet stream, then it will eventually become weaker and more variable in its course, which would allow more cold air from the polar vortex to leak mid-latitudes and slow the progression of Rossby Waves, leading to more persistent and more extreme weather.

The hypothesis above is closely associated with Jennifer Francis, who had first proposed it in a 2012 paper co-authored by Stephen J. Vavrus. [45] While some paleoclimate reconstructions have suggested that the polar vortex becomes more variable and causes more unstable weather during periods of warming back in 1997, [46] this was contradicted by climate modelling, with PMIP2 simulations finding in 2010 that the Arctic oscillation was much weaker and more negative during the Last Glacial Maximum, and suggesting that warmer periods have stronger positive phase AO, and thus less frequent leaks of the polar vortex air. [47] However, a 2012 review in the Journal of the Atmospheric Sciences noted that "there [has been] a significant change in the vortex mean state over the twenty-first century, resulting in a weaker, more disturbed vortex.", [48] which contradicted the modelling results but fit the Francis-Vavrus hypothesis. Additionally, a 2013 study noted that the then-current CMIP5 tended to strongly underestimate winter blocking trends, [49] and other 2012 research had suggested a connection between declining Arctic sea ice and heavy snowfall during midlatitude winters. [50]

In 2013, further research from Francis connected reductions in the Arctic sea ice to extreme summer weather in the northern mid-latitudes, [51] while other research from that year identified potential linkages between Arctic sea ice trends and more extreme rainfall in the European summer. [52] At the time, it was also suggested that this connection between Arctic amplification and jet stream patterns was involved in the formation of Hurricane Sandy [53] and played a role in the Early 2014 North American cold wave. [54] [55] In 2015, Francis' next study concluded that highly amplified jet-stream patterns are occurring more frequently in the past two decades. Hence, continued heat-trapping emissions favour increased formation of extreme events caused by prolonged weather conditions. [56]

Studies published in 2017 and 2018 identified stalling patterns of Rossby waves in the northern hemisphere jet stream as the culprit behind other almost stationary extreme weather events, such as the 2018 European heatwave, the 2003 European heat wave, 2010 Russian heat wave or the 2010 Pakistan floods, and suggested that these patterns were all connected to Arctic amplification. [57] [58] Further work from Francis and Vavrus that year suggested that amplified Arctic warming is observed as stronger in lower atmospheric areas because the expanding process of warmer air increases pressure levels which decreases poleward geopotential height gradients. As these gradients are the reason that cause west to east winds through the thermal wind relationship, declining speeds are usually found south of the areas with geopotential increases. [59] In 2017, Francis explained her findings to the Scientific American : "A lot more water vapor is being transported northward by big swings in the jet stream. That's important because water vapor is a greenhouse gas just like carbon dioxide and methane. It traps heat in the atmosphere. That vapor also condenses as droplets we know as clouds, which themselves trap more heat. The vapor is a big part of the amplification story—a big reason the Arctic is warming faster than anywhere else." [60]

In a 2017 study conducted by climatologist Dr. Judah Cohen and several of his research associates, Cohen wrote that "[the] shift in polar vortex states can account for most of the recent winter cooling trends over Eurasian midlatitudes". [61] A 2018 paper from Vavrus and others linked Arctic amplification to more persistent hot-dry extremes during the midlatitude summers, as well as the midlatitude winter continental cooling. [62] Another 2017 paper estimated that when the Arctic experiences anomalous warming, primary production in North America goes down by between 1% and 4% on average, with some states suffering up to 20% losses. [63] A 2021 study found that a stratospheric polar vortex disruption is linked with extreme cold winter weather across parts of Asia and North America, including the February 2021 North American cold wave. [64] [65] Another 2021 study identified a connection between the Arctic sea ice loss and the increased size of wildfires in the Western United States. [66]

However, because the specific observations are considered short-term observations, there is considerable uncertainty in the conclusions. Climatology observations require several decades to definitively distinguish various forms of natural variability from climate trends. [67] This point was stressed by reviews in 2013 [68] and in 2017. [69] A study in 2014 concluded that Arctic amplification significantly decreased cold-season temperature variability over the Northern Hemisphere in recent decades. Cold Arctic air intrudes into the warmer lower latitudes more rapidly today during autumn and winter, a trend projected to continue in the future except during summer, thus calling into question whether winters will bring more cold extremes. [70] A 2019 analysis of a data set collected from 35 182 weather stations worldwide, including 9116 whose records go beyond 50 years, found a sharp decrease in northern midlatitude cold waves since the 1980s. [71]

Moreover, a range of long-term observational data collected during 2010s and published in 2020s now suggests that the intensification of Arctic amplification since the early 2010s was not linked to significant changes on midlatitude atmospheric patterns. [72] [73] State-of-the-art modelling research of PAMIP (Polar Amplification Model Intercomparison Project) improved upon the 2010 findings of PMIP2 - it did find that sea ice decline would weaken the jet stream and increase the probability of atmospheric blocking, but the connection was very minor, and typically insignificant next to interannual variability. [74] [75] In 2022, a follow-up study found that while the PAMIP average had likely underestimated the weakening caused by sea ice decline by 1.2 to 3 times, even the corrected connection still amounts to only 10% of the jet stream's natural variability. [76]

Additionally, a 2021 study found that while jet streams had indeed slowly moved polewards since 1960 as was predicted by models, they did not weaken, in spite of a small increase in waviness. [77] A 2022 re-analysis of the aircraft observational data collected over 2002–2020 suggested that the North Atlantic jet stream had actually strengthened. [78] Finally, a 2021 study was able to reconstruct jet stream patterns over the past 1,250 years based on Greenland ice cores, and found that all of the recently observed changes remain within range of natural variability: the earliest likely time of divergence is in 2060, under the Representative Concentration Pathway 8.5 which implies continually accelerating greenhouse gas emissions. [79]

Ozone depletion

Southern Hemisphere Ozone Concentration, February 22, 2012 Srnhemozoneconcentration.gif
Southern Hemisphere Ozone Concentration, February 22, 2012

The chemistry of the Antarctic polar vortex has created severe ozone depletion, although the effect has been weakening since the 2000s. It is expected to return to 1980 levels in about 2075. [80] The nitric acid in polar stratospheric clouds reacts with chlorofluorocarbons to form chlorine, which catalyzes the photochemical destruction of ozone. [81] Chlorine concentrations build up during the polar winter, and the consequent ozone destruction is greatest when the sunlight returns in spring. [82] These clouds can only form at temperatures below about −80 °C (−112 °F).

Since there is greater air exchange between the Arctic and the mid-latitudes, ozone depletion at the north pole is much less severe than at the south. [83] Accordingly, the seasonal reduction of ozone levels over the Arctic is usually characterized as an "ozone dent", whereas the more severe ozone depletion over the Antarctic is considered an "ozone hole". That said, chemical ozone destruction in the 2011 Arctic polar vortex attained, for the first time, a level clearly identifiable as an Arctic "ozone hole". [84]

Outside Earth

Hubble view of the colossal polar cloud on Mars Mars cyclone.jpg
Hubble view of the colossal polar cloud on Mars

Other astronomical bodies are also known to have polar vortices, including Venus (double vortex – that is, two polar vortices at a pole), [85] Mars, Jupiter, Saturn, and Saturn's moon Titan.

Saturn's south pole is the only known hot polar vortex in the solar system. [86]

See also

Related Research Articles

<span class="mw-page-title-main">Jet stream</span> Fast-flowing atmospheric air current

Jet streams are fast flowing, narrow, meandering air currents in the atmospheres of the Earth, Venus, Jupiter, Saturn, Uranus, and Neptune. On Earth, the main jet streams are located near the altitude of the tropopause and are westerly winds. Jet streams may start, stop, split into two or more parts, combine into one stream, or flow in various directions including opposite to the direction of the remainder of the jet.

<span class="mw-page-title-main">Cyclone</span> Large scale air mass that rotates around a strong center of low pressure

In meteorology, a cyclone is a large air mass that rotates around a strong center of low atmospheric pressure, counterclockwise in the Northern Hemisphere and clockwise in the Southern Hemisphere as viewed from above. Cyclones are characterized by inward-spiraling winds that rotate about a zone of low pressure. The largest low-pressure systems are polar vortices and extratropical cyclones of the largest scale. Warm-core cyclones such as tropical cyclones and subtropical cyclones also lie within the synoptic scale. Mesocyclones, tornadoes, and dust devils lie within the smaller mesoscale.

<span class="mw-page-title-main">Ozone depletion</span> Atmospheric phenomenon

Ozone depletion consists of two related events observed since the late 1970s: a steady lowering of about four percent in the total amount of ozone in Earth's atmosphere, and a much larger springtime decrease in stratospheric ozone around Earth's polar regions. The latter phenomenon is referred to as the ozone hole. There are also springtime polar tropospheric ozone depletion events in addition to these stratospheric events.

<span class="mw-page-title-main">Stratosphere</span> Layer of the atmosphere above the troposphere

The stratosphere is the second layer of the atmosphere of Earth, located above the troposphere and below the mesosphere. The stratosphere is an atmospheric layer composed of stratified temperature layers, with the warm layers of air high in the sky and the cool layers of air in the low sky, close to the planetary surface of the Earth. The increase of temperature with altitude is a result of the absorption of the Sun's ultraviolet (UV) radiation by the ozone layer. The temperature inversion is in contrast to the troposphere, and near the Earth's surface, where temperature decreases with altitude.

<span class="mw-page-title-main">Tropopause</span> The boundary of the atmosphere between the troposphere and stratosphere

The tropopause is the atmospheric boundary that demarcates the troposphere from the stratosphere, which are the lowest two of the five layers of the atmosphere of Earth. The tropopause is a thermodynamic gradient-stratification layer that marks the end of the troposphere, and is approximately 17 kilometres (11 mi) above the equatorial regions, and approximately 9 kilometres (5.6 mi) above the polar regions.

A sudden stratospheric warming (SSW) is an event in which polar stratospheric temperatures rise by several tens of kelvins over the course of a few days. The warming is preceded by a slowing then reversal of the westerly winds in the stratospheric polar vortex. SSWs occur about six times per decade in the northern hemisphere, and about once every 20-30 years in the southern hemisphere. Only two southern SSWs have been observed.

<span class="mw-page-title-main">Anticyclone</span> Weather phenomenon of high pressure, as opposed to a cyclone

An anticyclone is a weather phenomenon defined as a large-scale circulation of winds around a central region of high atmospheric pressure, clockwise in the Northern Hemisphere and counterclockwise in the Southern Hemisphere as viewed from above. Effects of surface-based anticyclones include clearing skies as well as cooler, drier air. Fog can also form overnight within a region of higher pressure.

Rossby waves, also known as planetary waves, are a type of inertial wave naturally occurring in rotating fluids. They were first identified by Sweden-born American meteorologist Carl-Gustaf Arvid Rossby in the Earth's atmosphere in 1939. They are observed in the atmospheres and oceans of Earth and other planets, owing to the rotation of Earth or of the planet involved. Atmospheric Rossby waves on Earth are giant meanders in high-altitude winds that have a major influence on weather. These waves are associated with pressure systems and the jet stream. Oceanic Rossby waves move along the thermocline: the boundary between the warm upper layer and the cold deeper part of the ocean.

<span class="mw-page-title-main">Polar low</span>

A polar low is a mesoscale, short-lived atmospheric low pressure system (depression) that is found over the ocean areas poleward of the main polar front in both the Northern and Southern Hemispheres, as well as the Sea of Japan. The systems usually have a horizontal length scale of less than 1,000 kilometres (620 mi) and exist for no more than a couple of days. They are part of the larger class of mesoscale weather systems. Polar lows can be difficult to detect using conventional weather reports and are a hazard to high-latitude operations, such as shipping and gas and oil platforms. Polar lows have been referred to by many other terms, such as polar mesoscale vortex, Arctic hurricane, Arctic low, and cold air depression. Today the term is usually reserved for the more vigorous systems that have near-surface winds of at least 17 m/s (38 mph).

<span class="mw-page-title-main">Arctic oscillation</span> Climatic cycle over Earths North Pole

The Arctic oscillation (AO) or Northern Annular Mode/Northern Hemisphere Annular Mode (NAM) is a weather phenomenon at the Arctic pole north of 20 degrees latitude. It is an important mode of climate variability for the Northern Hemisphere. The southern hemisphere analogue is called the Antarctic oscillation or Southern Annular Mode (SAM). The index varies over time with no particular periodicity, and is characterized by non-seasonal sea-level pressure anomalies of one sign in the Arctic, balanced by anomalies of opposite sign centered at about 37–45° N.

This is a list of meteorology topics. The terms relate to meteorology, the interdisciplinary scientific study of the atmosphere that focuses on weather processes and forecasting.

<span class="mw-page-title-main">Block (meteorology)</span> Large-scale patterns in the atmospheric pressure field that are nearly stationary,

Blocks in meteorology are large-scale patterns in the atmospheric pressure field that are nearly stationary, effectively "blocking" or redirecting migratory cyclones. They are also known as blocking highs or blocking anticyclones. These blocks can remain in place for several days or even weeks, causing the areas affected by them to have the same kind of weather for an extended period of time. In the Northern Hemisphere, extended blocking occurs most frequently in the spring over the eastern Pacific and Atlantic Oceans. Whilst these events are linked to the occurrence of extreme weather events such as heat waves, particularly the onset and decay of these events is still not well captured in numerical weather forecasts and remains an open area of research.

<span class="mw-page-title-main">Hadley cell</span> Tropical atmospheric circulation feature

The Hadley cell, also known as the Hadley circulation, is a global-scale tropical atmospheric circulation that features air rising near the equator, flowing poleward near the tropopause at a height of 12–15 km (7.5–9.3 mi) above the Earth's surface, cooling and descending in the subtropics at around 25 degrees latitude, and then returning equatorward near the surface. It is a thermally direct circulation within the troposphere that emerges due to differences in insolation and heating between the tropics and the subtropics. On a yearly average, the circulation is characterized by a circulation cell on each side of the equator. The Southern Hemisphere Hadley cell is slightly stronger on average than its northern counterpart, extending slightly beyond the equator into the Northern Hemisphere. During the summer and winter months, the Hadley circulation is dominated by a single, cross-equatorial cell with air rising in the summer hemisphere and sinking in the winter hemisphere. Analogous circulations may occur in extraterrestrial atmospheres, such as on Venus and Mars.

<span class="mw-page-title-main">Climate change in the Arctic</span> Impacts of climate change on the Arctic

Major environmental issues caused by contemporary climate change in the Arctic region range from the well-known, such as the loss of sea ice or melting of the Greenland ice sheet, to more obscure, but deeply significant issues, such as permafrost thaw, as well as related social consequences for locals and the geopolitical ramifications of these changes. The Arctic is likely to be especially affected by climate change because of the high projected rate of regional warming and associated impacts. Temperature projections for the Arctic region were assessed in 2007: These suggested already averaged warming of about 2 °C to 9 °C by the year 2100. The range reflects different projections made by different climate models, run with different forcing scenarios. Radiative forcing is a measure of the effect of natural and human activities on the climate. Different forcing scenarios reflect things such as different projections of future human greenhouse gas emissions.

<span class="mw-page-title-main">Polar amplification</span>

Polar amplification is the phenomenon that any change in the net radiation balance tends to produce a larger change in temperature near the poles than in the planetary average. This is commonly referred to as the ratio of polar warming to tropical warming. On a planet with an atmosphere that can restrict emission of longwave radiation to space, surface temperatures will be warmer than a simple planetary equilibrium temperature calculation would predict. Where the atmosphere or an extensive ocean is able to transport heat polewards, the poles will be warmer and equatorial regions cooler than their local net radiation balances would predict. The poles will experience the most cooling when the global-mean temperature is lower relative to a reference climate; alternatively, the poles will experience the greatest warming when the global-mean temperature is higher.

<span class="mw-page-title-main">Upper tropospheric cyclonic vortex</span>

An upper tropospheric cyclonic vortex is a vortex, or a circulation with a definable center, that usually moves slowly from east-northeast to west-southwest and is prevalent across Northern Hemisphere's warm season. Its circulations generally do not extend below 6,080 metres (19,950 ft) in altitude, as it is an example of a cold-core low. A weak inverted wave in the easterlies is generally found beneath it, and it may also be associated with broad areas of high-level clouds. Downward development results in an increase of cumulus clouds and the appearance of circulation at ground level. In rare cases, a warm-core cyclone can develop in its associated convective activity, resulting in a tropical cyclone and a weakening and southwest movement of the nearby upper tropospheric cyclonic vortex. Symbiotic relationships can exist between tropical cyclones and the upper level lows in their wake, with the two systems occasionally leading to their mutual strengthening. When they move over land during the warm season, an increase in monsoon rains occurs.

<span class="mw-page-title-main">Cold-core low</span> Cyclone with an associated cold pool of air at high altitude

A cold-core low, also known as an upper level low or cold-core cyclone, is a cyclone aloft which has an associated cold pool of air residing at high altitude within the Earth's troposphere, without a frontal structure. It is a low pressure system that strengthens with height in accordance with the thermal wind relationship. If a weak surface circulation forms in response to such a feature at subtropical latitudes of the eastern north Pacific or north Indian oceans, it is called a subtropical cyclone. Cloud cover and rainfall mainly occurs with these systems during the day.

<span class="mw-page-title-main">Arctic sea ice decline</span> Sea ice loss observed in recent decades in the Arctic Ocean

Sea ice in the Arctic region has declined in recent decades in area and volume due to climate change. It has been melting more in summer than it refreezes in winter. Global warming, caused by greenhouse gas forcing is responsible for the decline in Arctic sea ice. The decline of sea ice in the Arctic has been accelerating during the early twenty‐first century, with a decline rate of 4.7% per decade. It is also thought that summertime sea ice will cease to exist sometime during the 21st century.

<span class="mw-page-title-main">Costas Varotsos</span> Greek physicist

Costas Varotsos is a Greek physicist known from his contribution to the global climate-dynamics research and remote sensing.

<span class="mw-page-title-main">January–March 2014 North American cold wave</span> Extreme weather event affecting parts of Canada and the United States

The January–March 2014 North American cold wave was an extreme weather event that extended through the late winter months of the 2013–2014 winter season, and was also part of an unusually cold winter affecting parts of Canada and parts of the north-central and northeastern United States. The event occurred in early 2014 and was caused by a southward shift of the North Polar Vortex. Record-low temperatures also extended well into March.

References

  1. Read, P.L. (August 2011). "Dynamics and circulation regimes of terrestrial planets". Planetary and Space Science. 59 (10): 900–914. Bibcode:2011P&SS...59..900R. doi:10.1016/j.pss.2010.04.024.
  2. "Air Maps", Littell's Living Age No. 495, 12 November 1853, p. 430.
  3. "GEOS-5 Analyses and Forecasts of the Major Stratospheric Sudden Warming of January 2013" (Press release). Goddard Space Flight Center . Retrieved January 8, 2014.
  4. Plumer, Brad (16 February 2021). "A Glimpse of America's Future: Climate Change Means Trouble for Power Grids". The New York Times.
  5. 1 2 "Polar vortex". Glossary of Meteorology. American Meteorological Society. June 2000. Retrieved 15 June 2008.
  6. "Casualty". BBC News. 1 Feb 2019. Retrieved 12 Feb 2019.
  7. "Polar vortex: What is it and how does it happen?". BBC video. 30 Jan 2019. Retrieved 31 Jan 2019.
  8. "UK Flooding and the Science of Climate Change". 9 February 2014. Archived from the original on 7 June 2019. Retrieved 19 April 2019.
  9. "Britain is about to get very, very cold". Independent.co.uk . 7 November 2016.
  10. "Stratospheric Polar Vortex Influences Winter Cold, Researchers Say" (Press release). American Association for the Advancement of Science. December 3, 2001. Retrieved May 23, 2015.
  11. "Polar Blast Set To Hit Australia This Weekend, First in 15 Years". Science Times. 21 Aug 2020. Retrieved 25 September 2020.
  12. "'Twin peaks': Sydney prepares for double burst of polar chill". Sydney Morning Herald . 9 May 2018. Retrieved 25 September 2020.
  13. Halldór Björnsson. "Global circulation". Archived from the original on March 24, 2010. Retrieved September 2, 2016.. Veðurstofa Íslands. Retrieved on 2008-06-15.
  14. Hartmann, D; Schoeberl, M (1991). "Mixing of polar vortex air into middle latitudes as revealed by tracer-tracer scatterplots". Journal of Geophysical Research. 102 (D11): 13119. Bibcode:1997JGR...10213119W. doi: 10.1029/96JD03715 .
  15. 1 2 Cavallo, Steven M.; Hakim, Gregory J. (April 2009). "Potential Vorticity Diagnosis of a Tropopause Polar Cyclone". Monthly Weather Review. 137 (4): 1358–1371. Bibcode:2009MWRv..137.1358C. doi: 10.1175/2008MWR2670.1 . S2CID   16226331.
  16. Kolstad, Erik W.; Breiteig, Tarjei; Scaife, Adam A. (April 2010). "The association between stratospheric weak polar vortex events and cold air outbreaks in the Northern Hemisphere". Quarterly Journal of the Royal Meteorological Society. 136 (649): 887. arXiv: 0906.0027 . Bibcode:2010EGUGA..12.5739K. doi:10.1002/qj.620. S2CID   119249497. Archived from the original on 2020-02-24. Retrieved 2017-12-02.
  17. Abdolreza Kashki & Javad Khoshhal (2013-11-22). "Investigation of the Role of Polar Vortex in Iranian First and Last Snowfalls". Journal of Geology and Geography. 5 (4). ISSN   1916-9779. Archived from the original on 2016-03-04. Retrieved 2014-01-30.
  18. Erik A. Rasmussen and John Turner (2003). Polar lows: mesoscale weather systems in the polar regions. Cambridge University Press. p. 174. ISBN   978-0-521-62430-5.
  19. Robock, Alan (2000). "Volcanic eruptions and climate" (PDF). Reviews of Geophysics. 38 (2): 191–219. Bibcode:2000RvGeo..38..191R. doi:10.1029/1998RG000054. S2CID   1299888. Archived from the original (PDF) on 2020-02-19.
  20. Todd Mitchell (2004). Arctic Oscillation (AO) time series, 1899 – June 2002 Archived 2003-12-12 at the Wayback Machine . University of Washington. Retrieved on 2009-03-02.
  21. Kevin Myatt (2005-01-17). Cold enough for snow, and more's on the way Archived 2013-02-01 at archive.today . Roanoke Times . Retrieved on 2012-02-24.
  22. Nash, E; Newman, P; Rosenfield, J; Schoeberl, M (2012). "An objective determination of the polar vortex using Ertel's potential vorticity". Journal of Geophysical Research. 101 (D5): 9471–9478. Bibcode:1996JGR...101.9471N. doi:10.1029/96JD00066.
  23. Li, L; Li, C; Pan, Y (2012). "On the differences and climate impacts of early and late stratospheric polar vortex breakup". Advances in Atmospheric Sciences. 29 (5): 1119–1128. Bibcode:2012AdAtS..29.1119L. doi:10.1007/s00376-012-1012-4. S2CID   123846176.
  24. Wei, K; Chen, W; Huang, R (2007). "Dynamical diagnosis of the breakup of the stratospheric polar vortex in the northern hemisphere". Science in China Series D: Earth Sciences. 50 (9): 1369–1379. Bibcode:2007ScChD..50.1369W. doi:10.1007/s11430-007-0100-2. S2CID   195309667.
  25. Reichler, Tom; Kim, J; Manzini, E; Kroger, J (2012). "A stratospheric connection to Atlantic climate variability". Nature Geoscience. 5 (11): 783–787. Bibcode:2012NatGe...5..783R. doi:10.1038/ngeo1586.
  26. Ripesi, Patrizio; et al. (2012). "The February 2010 Artcic Oscillation Index and its stratospheric connection" (PDF). Quarterly Journal of the Royal Meteorological Society. 138 (669): 1961–1969. Bibcode:2012QJRMS.138.1961R. doi:10.1002/qj.1935. S2CID   122729063.
  27. Reichler, Tom; Kim, J; Manzini, E; Kroger, J (2012). "A stratospheric connection to Atlantic climate variability". Nature Geoscience. 5 (11): 783–787. Bibcode:2012NatGe...5..783R. doi:10.1038/ngeo1586.
  28. Limpasuvan, Varavut; Hartmann, Dennis L.; Thompson, David W.J.; Jeev, Kumar; Yung, Yuk L. (2005). "Stratosphere-troposphere evolution during polar vortex intensification" (PDF). Journal of Geophysical Research. 110 (D24): 27. Bibcode:2005JGRD..11024101L. CiteSeerX   10.1.1.526.9159 . doi:10.1029/2005JD006302. Archived from the original (PDF) on 2017-08-12. Retrieved 2014-01-06.
  29. Cavallo, S; Hakim, G.J. (2013). "Physical mechanisms of tropopause polar vortex intensity change". Journal of the Atmospheric Sciences. 70 (11): 3359–3373. Bibcode:2013JAtS...70.3359C. doi: 10.1175/JAS-D-13-088.1 .
  30. Hartmann, D; Schoeberl, M (1991). "The dynamics of the stratospheric polar vortex and its relation to springtime ozone depletions" (PDF). Science. 251 (4989): 46–52. Bibcode:1991Sci...251...46S. doi:10.1126/science.251.4989.46. PMID   17778602. S2CID   24664477. Archived from the original (PDF) on 2019-03-02.
  31. Widnall, S; Sullivan, J (1973). "On the stability of vortex rings". Proceedings of the Royal Society of London. Series A, Mathematical and Physical Sciences. 332 (1590): 335–353. Bibcode:1973RSPSA.332..335W. doi:10.1098/rspa.1973.0029. S2CID   119959924.
  32. Manney, G; Zurek, R; O'Neill, A; Swinbank, R (1994). "On the motion of air through the stratospheric polar vortex". Journal of the Atmospheric Sciences. 51 (20): 2973–2994. Bibcode:1994JAtS...51.2973M. doi: 10.1175/1520-0469(1994)051<2973:otmoat>2.0.co;2 .
  33. Waugh, D; Plumb, R; Elkins, J; Fahey, D; Boering, K; Dutton, G; Lait, L (2012). "Mixing of polar vortex air into middle latitudes as revealed by tracer-tracer scatterplots". Journal of Geophysical Research: Atmospheres. 102 (D11): 13119–13134. Bibcode:1997JGR...10213119W. doi: 10.1029/96JD03715 .
  34. "The Warm West, Cool East U.S. Temperature Divide | Climate Nexus". Archived from the original on 2015-12-07. Retrieved 2015-11-26.
  35. Erdman, Jon (2014). "What's a Polar Vortex?: The Science Behind Arctic Outbreaks". wunderground. Retrieved 25 February 2014.
  36. 1 2 Baldwin, M.P.; Dunkerton, TJ (2001). "Stratospheric Harbingers of Anomalous Weather Regimes". Science. 294 (5542): 581–584. Bibcode:2001Sci...294..581B. doi:10.1126/science.1063315. PMID   11641495. S2CID   34595603.
  37. NASA (December 21, 2001). "Stratospheric Polar Vortex Influences Winter Cold". Earth Observatory. Archived from the original on March 16, 2010. Retrieved January 7, 2014.
  38. 1 2 Song, Yucheng; Robinson, Walter A. (2004). "Dynamical Mechanisms for Stratospheric Influences on the Troposphere". Journal of the Atmospheric Sciences. 61 (14): 1711–1725. Bibcode:2004JAtS...61.1711S. doi: 10.1175/1520-0469(2004)061<1711:DMFSIO>2.0.CO;2 .
  39. Archer, Cristina L.; Caldeira, Ken (18 April 2008). "Historical trends in the jet streams". Geophysical Research Letters. 35 (8). Bibcode:2008GeoRL..35.8803A. doi: 10.1029/2008GL033614 . S2CID   59377392.
  40. "Jet stream found to be permanently drifting north". Associated Press. 2008-04-18. Archived from the original on 17 August 2016. Retrieved 7 October 2022.
  41. Rantanen, Mika; Karpechko, Alexey Yu; Lipponen, Antti; Nordling, Kalle; Hyvärinen, Otto; Ruosteenoja, Kimmo; Vihma, Timo; Laaksonen, Ari (11 August 2022). "The Arctic has warmed nearly four times faster than the globe since 1979". Communications Earth & Environment. 3 (1): 168. Bibcode:2022ComEE...3..168R. doi: 10.1038/s43247-022-00498-3 . hdl: 11250/3115996 . ISSN   2662-4435. S2CID   251498876.
  42. "The Arctic is warming four times faster than the rest of the world". Science Magazine . 2021-12-14. Retrieved 6 October 2022.
  43. Isaksen, Ketil; Nordli, Øyvind; et al. (15 June 2022). "Exceptional warming over the Barents area". Scientific Reports. 12 (1): 9371. Bibcode:2022NatSR..12.9371I. doi:10.1038/s41598-022-13568-5. PMC   9200822 . PMID   35705593.
  44. Damian Carrington (2022-06-15). "New data reveals extraordinary global heating in the Arctic". The Guardian . Retrieved 7 October 2022.
  45. Francis, Jennifer A.; Vavrus, Stephen J. (2012). "Evidence linking Arctic amplification to extreme weather in mid-latitudes". Geophysical Research Letters. 39 (6): L06801. Bibcode:2012GeoRL..39.6801F. CiteSeerX   10.1.1.419.8599 . doi:10.1029/2012GL051000. S2CID   15383119.
  46. Zielinski, G.; Mershon, G. (1997). "Paleoenvironmental implications of the insoluble microparticle record in the GISP2 (Greenland) ice core during the rapidly changing climate of the Pleistocene-Holocene transition". Bulletin of the Geological Society of America. 109 (5): 547–559. Bibcode:1997GSAB..109..547Z. doi:10.1130/0016-7606(1997)109<0547:piotim>2.3.co;2.
  47. Lue, J.-M.; Kim, S.-J.; Abe-Ouchi, A.; Yu, Y.; Ohgaito, R. (2010). "Arctic Oscillation during the Mid-Holocene and Last Glacial Maximum from PMIP2 Coupled Model Simulations". Journal of Climate. 23 (14): 3792–3813. Bibcode:2010JCli...23.3792L. doi: 10.1175/2010JCLI3331.1 . S2CID   129156297.
  48. Mitchell, Daniel M.; Osprey, Scott M.; Gray, Lesley J.; Butchart, Neal; Hardiman, Steven C.; Charlton-Perez, Andrew J.; Watson, Peter (August 2012). "The Effect of Climate Change on the Variability of the Northern Hemisphere Stratospheric Polar Vortex". Journal of the Atmospheric Sciences. 69 (8): 2608–2618. Bibcode:2012JAtS...69.2608M. doi: 10.1175/jas-d-12-021.1 . ISSN   0022-4928. S2CID   122783377.
  49. Masato, Giacomo; Hoskins, Brian J.; Woollings, Tim (2013). "Winter and Summer Northern Hemisphere Blocking in CMIP5 Models". Journal of Climate. 26 (18): 7044–7059. Bibcode:2013JCli...26.7044M. doi: 10.1175/JCLI-D-12-00466.1 .
  50. Liu, Jiping; Curry, Judith A.; Wang, Huijun; Song, Mirong; Horton, Radley M. (27 February 2012). "Impact of declining Arctic sea ice on winter snowfall". PNAS. 109 (11): 4074–4079. Bibcode:2012PNAS..109.4074L. doi: 10.1073/pnas.1114910109 . PMC   3306672 . PMID   22371563.
  51. Qiuhong Tang; Xuejun Zhang; Francis, J. A. (December 2013). "Extreme summer weather in northern mid-latitudes linked to a vanishing cryosphere". Nature Climate Change. 4 (1): 45–50. Bibcode:2014NatCC...4...45T. doi:10.1038/nclimate2065.
  52. Screen, J A (November 2013). "Influence of Arctic sea ice on European summer precipitation". Environmental Research Letters. 8 (4): 044015. Bibcode:2013ERL.....8d4015S. doi: 10.1088/1748-9326/8/4/044015 . hdl: 10871/14835 .
  53. Friedlander, Blaine (4 March 2013). "Arctic ice loss amplified Superstorm Sandy violence". Cornell Chronicle. Retrieved 7 January 2014.
  54. Walsh, Bryan (6 January 2014). "Polar Vortex: Climate Change Might Just Be Driving the Historic Cold Snap". Time. Retrieved 7 January 2014.
  55. Spotts, Pete (6 January 2014). "How frigid 'polar vortex' could be result of global warming (+video)". The Christian Science Monitor. Retrieved 8 January 2014.
  56. Jennifer Francis; Natasa Skific (1 June 2015). "Evidence linking rapid Arctic warming to mid-latitude weather patterns". Philosophical Transactions. 373 (2045): 20140170. Bibcode:2015RSPTA.37340170F. doi:10.1098/rsta.2014.0170. PMC   4455715 . PMID   26032322.
  57. Mann, Michael E.; Rahmstorf, Stefan (27 March 2017). "Influence of Anthropogenic Climate Change on Planetary Wave Resonance and Extreme Weather Events". Scientific Reports. 7: 45242. Bibcode:2017NatSR...745242M. doi:10.1038/srep45242. PMC   5366916 . PMID   28345645.
  58. "Extreme global weather is 'the face of climate change' says leading scientist". The Guardian. 2018.
  59. Francis J; Vavrus S; Cohen J. (2017). "Amplified Arctic warming and mid latitude weather: new perspectives on emerging connections" (PDF). Wiley Interdisciplinary Reviews: Climate Change. 8 (5). 2017 Wiley Periodicals,Inc: e474. Bibcode:2017WIRCC...8E.474F. doi: 10.1002/wcc.474 .
  60. Fischetti, Mark (2017). "The Arctic Is Getting Crazy". Scientific American.
  61. Kretschmer, Marlene; Coumou, Dim; Agel, Laurie; Barlow, Mathew; Tziperman, Eli; Cohen, Judah (January 2018). "More-Persistent Weak Stratospheric Polar Vortex States Linked to Cold Extremes" (PDF). Bulletin of the American Meteorological Society. 99 (1): 49–60. Bibcode:2018BAMS...99...49K. doi:10.1175/bams-d-16-0259.1. ISSN   0003-0007. S2CID   51847061.
  62. Coumou, D.; Di Capua, G.; Vavrus, S.; Wang, L.; Wang, S. (2018-08-20). "The influence of Arctic amplification on mid-latitude summer circulation". Nature Communications. 9 (1): 2959. Bibcode:2018NatCo...9.2959C. doi:10.1038/s41467-018-05256-8. ISSN   2041-1723. PMC   6102303 . PMID   30127423.
  63. Kim, Jin-Soo; Kug, Jong-Seong; Jeong, Su-Jong; Huntzinger, Deborah N.; Michalak, Anna M.; Schwalm, Christopher R.; Wei, Yaxing; Schaefer, Kevin (26 October 2021). "Reduced North American terrestrial primary productivity linked to anomalous Arctic warming". Nature Geoscience. 10 (8): 572–576. doi:10.1038/ngeo2986. OSTI   1394479.
  64. "Climate change: Arctic warming linked to colder winters". BBC News. 2 September 2021. Retrieved 20 October 2021.
  65. Cohen, Judah; Agel, Laurie; Barlow, Mathew; Garfinkel, Chaim I.; White, Ian (3 September 2021). "Linking Arctic variability and change with extreme winter weather in the United States" . Science. 373 (6559): 1116–1121. Bibcode:2021Sci...373.1116C. doi:10.1126/science.abi9167. PMID   34516838. S2CID   237402139.
  66. Zou, Yofei; Rasch, Philip J.; Wang, Hailong; Xie, Zuowei; Zhang, Rudong (26 October 2021). "Increasing large wildfires over the western United States linked to diminishing sea ice in the Arctic". Nature Communications. 12 (1): 6048. Bibcode:2021NatCo..12.6048Z. doi:10.1038/s41467-021-26232-9. PMC   8548308 . PMID   34702824. S2CID   233618492.
  67. Weng, H. (2012). "Impacts of multi-scale solar activity on climate. Part I: Atmospheric circulation patterns and climate extremes". Advances in Atmospheric Sciences. 29 (4): 867–886. Bibcode:2012AdAtS..29..867W. doi:10.1007/s00376-012-1238-1. S2CID   123066849.
  68. James E. Overland (December 8, 2013). "Atmospheric science: Long-range linkage". Nature Climate Change. 4 (1): 11–12. Bibcode:2014NatCC...4...11O. doi:10.1038/nclimate2079.
  69. Seviour, William J.M. (14 April 2017). "Weakening and shift of the Arctic stratospheric polar vortex: Internal variability or forced response?". Geophysical Research Letters. 44 (7): 3365–3373. Bibcode:2017GeoRL..44.3365S. doi:10.1002/2017GL073071. hdl: 1983/caf74781-222b-4735-b171-8842cead4086 . S2CID   131938684.
  70. Screen, James A. (15 June 2014). "Arctic amplification decreases temperature variance in northern mid- to high-latitudes". Nature Climate Change. 4 (7): 577–582. Bibcode:2014NatCC...4..577S. doi:10.1038/nclimate2268. hdl: 10871/15095 .
  71. van Oldenborgh, Geert Jan; Mitchell-Larson, Eli; Vecchi, Gabriel A.; de Vries, Hylke; Vautar, Robert; Otto, Friederike (22 November 2019). "Cold waves are getting milder in the northern midlatitudes". Environmental Research Letters. 14 (11): 114004. Bibcode:2019ERL....14k4004V. doi: 10.1088/1748-9326/ab4867 . S2CID   204420462.
  72. Blackport, Russell; Screen, James A.; van der Wiel, Karin; Bintanja, Richard (September 2019). "Minimal influence of reduced Arctic sea ice on coincident cold winters in mid-latitudes". Nature Climate Change. 9 (9): 697–704. Bibcode:2019NatCC...9..697B. doi:10.1038/s41558-019-0551-4. hdl: 10871/39784 . S2CID   199542188.
  73. Blackport, Russell; Screen, James A. (February 2020). "Insignificant effect of Arctic amplification on the amplitude of midlatitude atmospheric waves". Science Advances. 6 (8): eaay2880. Bibcode:2020SciA....6.2880B. doi: 10.1126/sciadv.aay2880 . PMC   7030927 . PMID   32128402.
  74. Streffing, Jan; Semmler, Tido; Zampieri, Lorenzo; Jung, Thomas (24 September 2021). "Response of Northern Hemisphere Weather and Climate to Arctic Sea Ice Decline: Resolution Independence in Polar Amplification Model Intercomparison Project (PAMIP) Simulations". Journal of Climate. 34 (20): 8445–8457. Bibcode:2021JCli...34.8445S. doi: 10.1175/JCLI-D-19-1005.1 . S2CID   239631549.
  75. Paul Voosen (2021-05-12). "Landmark study casts doubt on controversial theory linking melting Arctic to severe winter weather". Science Magazine . Retrieved 7 October 2022.
  76. Smith, D.M.; Eade, R.; Andrews, M.B.; et al. (7 February 2022). "Robust but weak winter atmospheric circulation response to future Arctic sea ice loss". Nature Communications. 13 (1): 727. Bibcode:2022NatCo..13..727S. doi:10.1038/s41467-022-28283-y. PMC   8821642 . PMID   35132058. S2CID   246637132.
  77. Martin, Jonathan E. (14 April 2021). "Recent Trends in the Waviness of the Northern Hemisphere Wintertime Polar and Subtropical Jets". Journal of Geophysical Research: Atmospheres. 126 (9). Bibcode:2021JGRD..12633668M. doi:10.1029/2020JD033668. S2CID   222246122.
  78. Tenenbaum, Joel; Williams, Paul D.; Turp, Debi; Buchanan, Piers; Coulson, Robert; Gill, Philip G.; Lunnon, Robert W.; Oztunali, Marguerite G.; Rankin, John; Rukhovets, Leonid (July 2022). "Aircraft observations and reanalysis depictions of trends in the North Atlantic winter jet stream wind speeds and turbulence". Quarterly Journal of the Royal Meteorological Society. 148 (747): 2927–2941. Bibcode:2022QJRMS.148.2927T. doi:10.1002/qj.4342. ISSN   0035-9009. S2CID   250029057.
  79. Osman, Matthew B.; Coats, Sloan; Das, Sarah B.; McConnell, Joseph R.; Chellman, Nathan (13 September 2021). "North Atlantic jet stream projections in the context of the past 1,250 years". PNAS. 118 (38). Bibcode:2021PNAS..11804105O. doi: 10.1073/pnas.2104105118 . PMC   8463874 . PMID   34518222.
  80. "The Antarctic Ozone Hole Will Recover". NASA. June 4, 2015. Retrieved 2017-08-05.
  81. J.A. Pyle (1997). The Arctic and environmental change. CRC Press. pp. 42–44. ISBN   978-90-5699-020-6.
  82. Rolf Müller (2010). Tracer-tracer Relations as a Tool for Research on Polar Ozone Loss. Forschungszentrum Jülich. p. 47. ISBN   978-3-89336-614-9.
  83. K. Mohanakuma (2008). Stratosphere troposphere interactions: an introduction. Springer. p. 34. ISBN   978-1-4020-8216-0.
  84. "Arctic ozone loss at record level". BBC News Online. October 2, 2011. Archived from the original on October 3, 2011. Retrieved October 3, 2011.
  85. "Double vortex at Venus South Pole unveiled!". European Space Agency. Retrieved 2018-09-11.
  86. "Saturn's Bull's-Eye Marks Its Hot Spot". NASA. 2005. Archived from the original on November 25, 2013. Retrieved January 8, 2014.

Further reading