Plurality voting refers to electoral systems in which a candidate who polls more than any other is elected. In systems based on single-member districts, it elects just one member per district and may also be referred to as first-past-the-post (FPTP), single-member plurality (SMP/SMDP), single-choice voting, simple plurality or relative majority. A system that elects multiple winners elected at once with the plurality rule and where each voter casts multiple X votes in a multi-seat district is referred to as plurality block voting. A semi-proportional system that elects multiple winners elected at once with the plurality rule and where each voter casts just one vote in a multi-seat district is known as single non-transferable voting.

Suffrage, political franchise, or simply franchise is the right to vote in public, political elections and referendums. In some languages, and occasionally in English, the right to vote is called active suffrage, as distinct from passive suffrage, which is the right to stand for election. The combination of active and passive suffrage is sometimes called full suffrage.
National referendums are seldom used in Canada. The first two referendums in 1898 and 1942 saw voters in Quebec and the remainder of Canada take dramatically-opposing stands, and the third in 1992 saw most of the voters take a stand dramatically opposed to that of the politicians in power.
Mixed-member proportional representation is a mixed electoral system in which votes are cast for both local elections and also for overall party vote tallies, which are used to allocate additional members to produce or deepen overall proportional representation.
The electoral system of Australia comprises the laws and processes used for the election of members of the Australian Parliament and is governed primarily by the Commonwealth Electoral Act 1918. The system presently has a number of distinctive features including compulsory enrolment; compulsory voting; majority-preferential instant-runoff voting in single-member seats to elect the lower house, the House of Representatives; and the use of the single transferable vote proportional representation system to elect the upper house, the Senate.
Compulsory voting, also called universal civic duty voting or mandatory voting, is the requirement that registered voters participate in an election. As of January 2023, 21 countries have compulsory voting laws. Enforcement of the law in those countries varies considerably and the penalty for not casting a ballot without a proper justification ranges from severe to non-existent.

Electoral reform in New Zealand has been a political issue in the past as major changes have been made to both parliamentary and local government electoral systems.
Norway elects its legislature on a national level. The parliament, the Storting, has 169 members elected for a four-year term by a form of proportional representation in multi-seat constituencies.

The 1867 Canadian federal election was held from August 7 to September 20, 1867, and was the first election for the new country of Canada. It was held to elect members representing electoral districts in the provinces of Nova Scotia, New Brunswick, Ontario and Quebec to the House of Commons of the 1st Canadian Parliament. The provinces of Manitoba (1870) and British Columbia (1871) were created during the term of the 1st Parliament of Canada and were not part of this election.

In political science, voter turnout is the participation rate of a given election. This is typically either the percentage of registered voters, eligible voters, or all voting-age people. According to Stanford University political scientists Adam Bonica and Michael McFaul, there is a consensus among political scientists that "democracies perform better when more people vote."
At a national level, Greece holds elections for its legislature, the Hellenic Parliament.

Voter suppression is a strategy used to influence the outcome of an election by discouraging or preventing specific groups of people from voting. It is distinguished from political campaigning in that campaigning attempts to change likely voting behavior by changing the opinions of potential voters through persuasion and organization, activating otherwise inactive voters, or registering new supporters. Voter suppression, instead, attempts to gain an advantage by reducing the turnout of certain voters. Suppression is an anti-democratic tactic associated with authoritarianism.
Elections in Hungary are held at two levels: general elections to elect the members of the National Assembly and local elections to elect local authorities. European Parliament elections are also held every 5 years.

Elections in Lithuania are held to select members of the parliament, the president, members of the municipal councils and mayors, as well as delegates to the European Parliament. Lithuanian citizens can also vote in mandatory or consultative referendums.
Apportionment is the process by which seats in a legislative body are distributed among administrative divisions, such as states or parties, entitled to representation. This page presents the general principles and issues related to apportionment. The page Apportionment by country describes specific practices used around the world. The page Mathematics of apportionment describes mathematical formulations and properties of apportionment rules.
Voting in Switzerland is the process by which Swiss citizens make decisions about governance and elect officials. The history of voting rights in Switzerland mirrors the complexity of the nation itself. The polling stations are opened on Saturdays and Sunday mornings but most people vote by post in advance. At noon on Sunday, voting ends and the results are usually known during the afternoon.

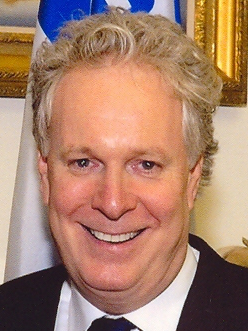
The 2007 Quebec general election was held in the Canadian province of Quebec on March 26, 2007 to elect members of the 38th National Assembly of Quebec. The Quebec Liberal Party led by Premier Jean Charest managed to win a plurality of seats, but were reduced to a minority government, Quebec's first in 129 years, since the 1878 general election. The Action démocratique du Québec, in a major breakthrough, became the official opposition. The Parti Québécois was relegated to third-party status for the first time since the 1973 election. The Liberals won their lowest share of the popular vote since Confederation, and the PQ with their 28.35% of the votes cast won their lowest share since 1973 and their second lowest ever. Each of the three major parties won nearly one-third of the popular vote, the closest three-way split in Quebec electoral history until the 2012 election. This was however, the closest three-way race in terms of seat count. Voter turnout among those eligible was 71.23%, a marginal difference from the previous general election in 2003.

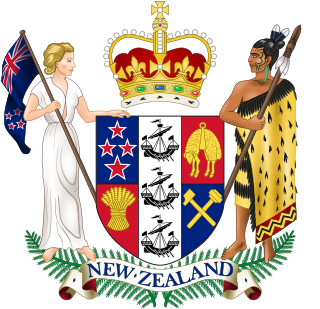
Voting in New Zealand was introduced after colonisation by British settlers. The first New Zealand Constitution Act was passed in 1852, and the first parliamentary elections were held the following year.
In political science, political apathy is a lack of interest or apathy towards politics. This includes voter apathy, information apathy and lack of interest in elections, political events, public meetings, and voting.

The historical trends in voter turnout in the United States presidential elections have been determined by the gradual expansion of voting rights from the initial restriction to white male property owners aged 21 or older in the early years of the country's independence to all citizens aged 18 or older in the mid-20th century. Voter turnout in United States presidential elections has historically been higher than the turnout for midterm elections.


