Absolute threshold of hearing

Last updated

The absolute threshold of hearing (ATH), also known as the absolute hearing threshold or auditory threshold, is the minimum sound level of a pure tone that an average human ear with normal hearing can hear with no other sound present. The absolute threshold relates to the sound that can just be heard by the organism. [1] [2] The absolute threshold is not a discrete point and is therefore classed as the point at which a sound elicits a response a specified percentage of the time. [1]

Contents

The threshold of hearing is generally reported in reference to the RMS sound pressure of 20 micropascals, i.e. 0 dB SPL, corresponding to a sound intensity of 0.98 pW/m2 at 1 atmosphere and 25 °C. [3] It is approximately the quietest sound a young human with undamaged hearing can detect at 1,000  Hz. [4] The threshold of hearing is frequency-dependent and it has been shown that the ear's sensitivity is best at frequencies between 2 kHz and 5 kHz, [5] where the threshold reaches as low as −9 dB SPL. [6] [7] [8]

Average hearing thresholds in decibels (SPL) (the unit of 'dB(HL)' shown on the vertical axis is incorrect) are plotted from 125 to 8000 Hz for younger (18-30 year olds, red circles) and older adults (60-67 year olds, black diamonds). The hearing of older adults is shown to be significantly less sensitive than that of younger adults at frequencies of 4000 and 8000 Hz, corresponding approximately to the piano keys and tones of b'''' (B7) and b''''' (B8), respectively. B8 is near the high end of the piano frequency range. Average click-evoked waveforms and Average hearing thresholds for younger and older adults.jpg
Average hearing thresholds in decibels  (SPL) (the unit of 'dB(HL)' shown on the vertical axis is incorrect) are plotted from 125 to 8000 Hz for younger (18-30 year olds, red circles) and older adults (60-67 year olds, black diamonds). The hearing of older adults is shown to be significantly less sensitive than that of younger adults at frequencies of 4000 and 8000 Hz, corresponding approximately to the piano keys and tones of b′′′′ (B7) and b′′′′′ (B8), respectively. B8 is near the high end of the piano frequency range.

Psychophysical methods for measuring thresholds

Measurement of the absolute hearing threshold provides some basic information about our auditory system. [4] The tools used to collect such information are called psychophysical methods. Through these, the perception of a physical stimulus (sound) and our psychological response to the sound is measured. [9]

Several psychophysical methods can measure absolute threshold. These vary, but certain aspects are identical. Firstly, the test defines the stimulus and specifies the manner in which the subject should respond. The test presents the sound to the listener and manipulates the stimulus level in a predetermined pattern. The absolute threshold is defined statistically, often as an average of all obtained hearing thresholds. [4]

Some procedures use a series of trials, with each trial using the 'single-interval "yes"/"no" paradigm'. This means that sound may be present or absent in the single interval, and the listener has to say whether he thought the stimulus was there. When the interval does not contain a stimulus, it is called a "catch trial". [4]

Classical methods

Classical methods date back to the 19th century and were first described by Gustav Theodor Fechner in his work Elements of Psychophysics. [9] Three methods are traditionally used for testing a subject's perception of a stimulus: the method of limits, the method of constant stimuli, and the method of adjustment. [4]

Method of limits
In the method of limits, the tester controls the level of the stimuli. Single-interval yes/no paradigm' is used, but there are no catch trials.
The trial uses several series of descending and ascending runs.
The trial starts with the descending run, where a stimulus is presented at a level well above the expected threshold. When the subject responds correctly to the stimulus, the level of intensity of the sound is decreased by a specific amount and presented again. The same pattern is repeated until the subject stops responding to the stimuli, at which point the descending run is finished.
In the ascending run, which comes after, the stimulus is first presented well below the threshold and then gradually increased in two decibel (dB) steps until the subject responds.
Series of descending and ascending runs in Method of Limits Method of limits.png
Series of descending and ascending runs in Method of Limits
As there are no clear margins to 'hearing' and 'not hearing', the threshold for each run is determined as the midpoint between the last audible and first inaudible level.
The subject's absolute hearing threshold is calculated as the mean of all obtained thresholds in both ascending and descending runs.
There are several issues related to the method of limits. First is anticipation, which is caused by the subject's awareness that the turn-points determine a change in response. Anticipation produces better ascending thresholds and worse descending thresholds.
Habituation creates completely opposite effect, and occurs when the subject becomes accustomed to responding either "yes" in the descending runs and/or "no" in the ascending runs. For this reason, thresholds are raised in ascending runs and improved in descending runs.
Another problem may be related to step size. Too large a step compromises accuracy of the measurement as the actual threshold may be just between two stimulus levels.
Finally, since the tone is always present, "yes" is always the correct answer. [4]
Method of constant stimuli
In the method of constant stimuli, the tester sets the level of stimuli and presents them at completely random order.
Subject responding "yes"/"no" after each presentation Method of Constant Stimuli.png
Subject responding "yes"/"no" after each presentation
Thus, there are no ascending or descending trials.
The subject responds "yes"/"no" after each presentation.
The stimuli are presented many times at each level and the threshold is defined as the stimulus level at which the subject scored 50% correct. "Catch" trials may be included in this method.
Method of constant stimuli has several advantages over the method of limits. Firstly, the random order of stimuli means that the correct answer cannot be predicted by the listener. Secondarily, as the tone may be absent (catch trial), "yes" is not always the correct answer. Finally, catch trials help to detect the amount of a listener's guessing.
The main disadvantage lies in the large number of trials needed to obtain the data, and therefore time required to complete the test. [4]
Method of adjustment
Method of adjustment shares some features with the method of limits, but differs in others. There are descending and ascending runs and the listener knows that the stimulus is always present.
The subject reduces or increase the level of the tone Method of Adjustment.png
The subject reduces or increase the level of the tone
However, unlike in the method of limits, here the stimulus is controlled by the listener. The subject reduces the level of the tone until it cannot be detected anymore, or increases until it can be heard again.
The stimulus level is varied continuously via a dial and the stimulus level is measured by the tester at the end. The threshold is the mean of the just audible and just inaudible levels.
Also this method can produce several biases. To avoid giving cues about the actual stimulus level, the dial must be unlabeled. Apart from the already mentioned anticipation and habituation, stimulus persistence (preservation) could influence the result from the method of adjustment.
In the descending runs, the subject may continue to reduce the level of the sound as if the sound was still audible, even though the stimulus is already well below the actual hearing threshold.
In contrast, in the ascending runs, the subject may have persistence of the absence of the stimulus until the hearing threshold is passed by certain amount. [10]

Modified classical methods

Forced-choice methods

Two intervals are presented to a listener, one with a tone and one without a tone. The listener must decide which interval had the tone in it. The number of intervals can be increased, but this may cause problems for the listener who has to remember which interval contained the tone. [4] [11]

Adaptive methods

Unlike the classical methods, where the pattern for changing the stimuli is preset, in adaptive methods the subject's response to the previous stimuli determines the level at which a subsequent stimulus is presented. [12]

Staircase (up-down) methods

Series of descending and ascending trials runs and turning points Simple Up-Down Method.png
Series of descending and ascending trials runs and turning points

The simple 1-down-1-up method consists of a series of descending and ascending trial runs and turning points (reversals). The stimulus level is increased if the subject does not respond and decreased when a response occurs. Similar to the method of limits, the stimuli are adjusted in predetermined steps. After obtaining from six to eight reversals, the first one is discarded and the threshold is defined as the average of the midpoints of the remaining runs. Experiments have shown that this method provides only 50% accuracy. [12] To produce more accurate results, this simple method can be further modified by increasing the size of steps in the descending runs, e.g. 2-down-1-up method, 3-down-1-up methods. [4]

Bekesy's tracking method

The threshold being tracked by the listener Bekesy's Tracking Method.png
The threshold being tracked by the listener

Bekesy's method contains some aspects of classical methods and staircase methods. The level of the stimulus is automatically varied at a fixed rate. The subject is asked to press a button when the stimulus is detectable. Once the button is pressed, the level is automatically decreased by the motor-driven attenuator and increased when the button is not pushed. The threshold is thus tracked by the listeners, and calculated as the mean of the midpoints of the runs as recorded by the automat. [4]

Hysteresis effect

Hysteresis can be defined roughly as 'the lagging of an effect behind its cause'. When measuring hearing thresholds it is always easier for the subject to follow a tone that is audible and decreasing in amplitude than to detect a tone that was previously inaudible.

This is because 'top-down' influences mean that the subject expects to hear the sound and is, therefore, more motivated with higher levels of concentration.

The 'bottom-up' theory explains that unwanted external (from the environment) and internal (e.g., heartbeat) noise results in the subject only responding to the sound if the signal-to-noise ratio is above a certain point.

In practice this means that when measuring threshold with sounds decreasing in amplitude, the point at which the sound becomes inaudible is always lower than the point at which it returns to audibility. This phenomenon is known as the 'hysteresis effect'.

Descending runs give better hearing thresholds than ascending runs Hysteresis.png
Descending runs give better hearing thresholds than ascending runs

Psychometric function of absolute hearing threshold

Psychometric function 'represents the probability of a certain listener's response as a function of the magnitude of the particular sound characteristic being studied'. [13]

To give an example, this could be the probability curve of the subject detecting a sound being presented as a function of the sound level. When the stimulus is presented to the listener one would expect that the sound would either be audible or inaudible, resulting in a 'doorstep' function. In reality a grey area exists where the listener is uncertain as to whether they have actually heard the sound or not, so their responses are inconsistent, resulting in a psychometric function.

The psychometric function is a sigmoid function characterised by being 's' shaped in its graphical representation.

Minimal audible field vs minimal audible pressure

Two methods can be used to measure the minimal audible stimulus [2] and therefore the absolute threshold of hearing. Minimal audible field involves the subject sitting in a sound field and stimulus being presented via a loudspeaker. [2] [14] The sound level is then measured at the position of the subjects head with the subject not in the sound field. [2] Minimal audible pressure involves presenting stimuli via headphones [2] or earphones [1] [14] and measuring sound pressure in the subject's ear canal using a very small probe microphone. [2] The two different methods produce different thresholds [1] [2] and minimal audible field thresholds are often 6 to 10 dB better than minimal audible pressure thresholds. [2] It is thought that this difference is due to:

Minimal audible field and minimal audible pressure are important when considering calibration issues and they also illustrate that the human hearing is most sensitive in the 2–5 kHz range. [2]

Temporal summation

Temporal summation is the relationship between stimulus duration and intensity when the presentation time is less than 1 second. Auditory sensitivity changes when the duration of a sound becomes less than 1 second. The threshold intensity decreases by about 10 dB when the duration of a tone burst is increased from 20 to 200 ms.

For example, suppose that the quietest sound a subject can hear is 16 dB SPL if the sound is presented at a duration of 200 ms. If the same sound is then presented for a duration of only 20 ms, the quietest sound that can now be heard by the subject goes up to 26 dB SPL. In other words, if a signal is shortened by a factor of 10 then the level of that signal must be increased by as much as 10 dB to be heard by the subject.

The ear operates as an energy detector that samples the amount of energy present within a certain time frame. A certain amount of energy is needed within a time frame to reach the threshold. This can be done by using a higher intensity for less time or by using a lower intensity for more time. Sensitivity to sound improves as the signal duration increases up to about 200 to 300 ms, after that the threshold remains constant. [2]

The timpani of the ear operates more as a sound pressure sensor. Also a microphone works the same way and is not sensitive to sound intensity.

See also

Related Research Articles

<span class="mw-page-title-main">Pitch (music)</span> Perceptual property in music ordering sounds from low to high

Pitch is a perceptual property of sounds that allows their ordering on a frequency-related scale, or more commonly, pitch is the quality that makes it possible to judge sounds as "higher" and "lower" in the sense associated with musical melodies. Pitch is a major auditory attribute of musical tones, along with duration, loudness, and timbre.

<span class="mw-page-title-main">Phon</span> Logarithmic unit of loudness level

The phon is a logarithmic unit of loudness level for tones and complex sounds. Loudness is measured in sones, a linear unit. Human sensitivity to sound is variable across different frequencies; therefore, although two different tones may present an identical sound pressure to a human ear, they may be psychoacoustically perceived as differing in loudness. The purpose of the phon is to provide a logarithmic measurement for perceived sound magnitude, while the primary loudness standard methods result in a linear representation. A sound with a loudness of 1 sone is judged equally loud as a 1 kHz tone with a sound pressure level of 40 decibels above 20 micropascal. The phon is psychophysically matched to a reference frequency of 1 kHz. In other words, the phon matches the sound pressure level (SPL) in decibels of a similarly perceived 1 kHz pure tone. For instance, if a sound is perceived to be equal in intensity to a 1 kHz tone with an SPL of 50 dB, then it has a loudness of 50 phons, regardless of its physical properties. The phon was proposed in DIN 45631 and ISO 532 B by Stanley Smith Stevens.

<span class="mw-page-title-main">Psychophysics</span> Branch of knowledge relating physical stimuli and psychological perception

Psychophysics quantitatively investigates the relationship between physical stimuli and the sensations and perceptions they produce. Psychophysics has been described as "the scientific study of the relation between stimulus and sensation" or, more completely, as "the analysis of perceptual processes by studying the effect on a subject's experience or behaviour of systematically varying the properties of a stimulus along one or more physical dimensions".

<span class="mw-page-title-main">Loudness</span> Subjective perception of sound pressure

In acoustics, loudness is the subjective perception of sound pressure. More formally, it is defined as the "attribute of auditory sensation in terms of which sounds can be ordered on a scale extending from quiet to loud". The relation of physical attributes of sound to perceived loudness consists of physical, physiological and psychological components. The study of apparent loudness is included in the topic of psychoacoustics and employs methods of psychophysics.

In the branch of experimental psychology focused on sense, sensation, and perception, which is called psychophysics, a just-noticeable difference or JND is the amount something must be changed in order for a difference to be noticeable, detectable at least half the time. This limen is also known as the difference limen, difference threshold, or least perceptible difference.

<span class="mw-page-title-main">Acoustic reflex</span> Small muscle contraction in the middle ear in response to loud sound

The acoustic reflex is an involuntary muscle contraction that occurs in the middle ear in response to loud sound stimuli or when the person starts to vocalize.

An otoacoustic emission (OAE) is a sound that is generated from within the inner ear. Having been predicted by Austrian astrophysicist Thomas Gold in 1948, its existence was first demonstrated experimentally by British physicist David Kemp in 1978, and otoacoustic emissions have since been shown to arise through a number of different cellular and mechanical causes within the inner ear. Studies have shown that OAEs disappear after the inner ear has been damaged, so OAEs are often used in the laboratory and the clinic as a measure of inner ear health.

<span class="mw-page-title-main">Audiometry</span> Branch of audiology and the science of measuring hearing acuity

Audiometry is a branch of audiology and the science of measuring hearing acuity for variations in sound intensity and pitch and for tonal purity, involving thresholds and differing frequencies. Typically, audiometric tests determine a subject's hearing levels with the help of an audiometer, but may also measure ability to discriminate between different sound intensities, recognize pitch, or distinguish speech from background noise. Acoustic reflex and otoacoustic emissions may also be measured. Results of audiometric tests are used to diagnose hearing loss or diseases of the ear, and often make use of an audiogram.

In neuroscience and psychophysics, an absolute threshold was originally defined as the lowest level of a stimulus – light, sound, touch, etc. – that an organism could detect. Under the influence of signal detection theory, absolute threshold has been redefined as the level at which a stimulus will be detected a specified percentage of the time. The absolute threshold can be influenced by several different factors, such as the subject's motivations and expectations, cognitive processes, and whether the subject is adapted to the stimulus.
The absolute threshold can be compared to the difference threshold, which is the measure of how different two stimuli must be for the subject to notice that they are not the same.

In audiology and psychoacoustics the concept of critical bands, introduced by Harvey Fletcher in 1933 and refined in 1940, describes the frequency bandwidth of the "auditory filter" created by the cochlea, the sense organ of hearing within the inner ear. Roughly, the critical band is the band of audio frequencies within which a second tone will interfere with the perception of the first tone by auditory masking.

<span class="mw-page-title-main">Audiogram</span> Graph showing audible frequencies

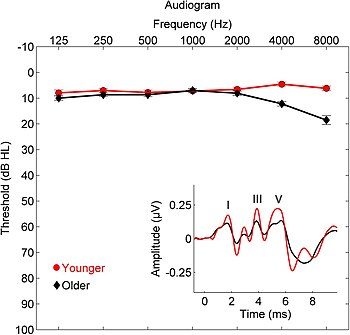
An audiogram is a graph that shows the audible threshold for standardized frequencies as measured by an audiometer. The Y axis represents intensity measured in decibels (dB) and the X axis represents frequency measured in hertz (Hz). The threshold of hearing is plotted relative to a standardised curve that represents 'normal' hearing, in dB(HL). They are not the same as equal-loudness contours, which are a set of curves representing equal loudness at different levels, as well as at the threshold of hearing, in absolute terms measured in dB SPL.

In psychophysics, sensory threshold is the weakest stimulus that an organism can sense. Unless otherwise indicated, it is usually defined as the weakest stimulus that can be detected half the time, for example, as indicated by a point on a probability curve. Methods have been developed to measure thresholds in any of the senses.

<span class="mw-page-title-main">Hearing range</span> Range of frequencies that can be heard by humans or other animals

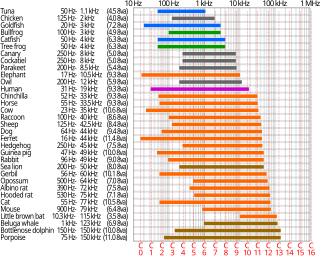
Hearing range describes the range of frequencies that can be heard by humans or other animals, though it can also refer to the range of levels. The human range is commonly given as 20 to 20,000 Hz, although there is considerable variation between individuals, especially at high frequencies, and a gradual loss of sensitivity to higher frequencies with age is considered normal. Sensitivity also varies with frequency, as shown by equal-loudness contours. Routine investigation for hearing loss usually involves an audiogram which shows threshold levels relative to a normal.

<span class="mw-page-title-main">Pure-tone audiometry</span>

Pure-tone audiometry is the main hearing test used to identify hearing threshold levels of an individual, enabling determination of the degree, type and configuration of a hearing loss and thus providing a basis for diagnosis and management. Pure-tone audiometry is a subjective, behavioural measurement of a hearing threshold, as it relies on patient responses to pure tone stimuli. Therefore, pure-tone audiometry is only used on adults and children old enough to cooperate with the test procedure. As with most clinical tests, standardized calibration of the test environment, the equipment and the stimuli is needed before testing proceeds. Pure-tone audiometry only measures audibility thresholds, rather than other aspects of hearing such as sound localization and speech recognition. However, there are benefits to using pure-tone audiometry over other forms of hearing test, such as click auditory brainstem response (ABR). Pure-tone audiometry provides ear specific thresholds, and uses frequency specific pure tones to give place specific responses, so that the configuration of a hearing loss can be identified. As pure-tone audiometry uses both air and bone conduction audiometry, the type of loss can also be identified via the air-bone gap. Although pure-tone audiometry has many clinical benefits, it is not perfect at identifying all losses, such as ‘dead regions’ of the cochlea and neuropathies such as auditory processing disorder (APD). This raises the question of whether or not audiograms accurately predict someone's perceived degree of disability.

In audio signal processing, auditory masking occurs when the perception of one sound is affected by the presence of another sound.

The hypersonic effect is a phenomenon reported in a controversial scientific study by Tsutomu Oohashi et al., which claims that, although humans cannot consciously hear ultrasound, the presence or absence of those frequencies has a measurable effect on their physiological and psychological reactions.

Dichotic pitch is a pitch heard due to binaural processing, when the brain combines two noises presented simultaneously to the ears. In other words, it cannot be heard when the sound stimulus is presented monaurally but, when it is presented binaurally a sensation of a pitch can be heard. The binaural stimulus is presented to both ears through headphones simultaneously, and is the same in several respects except for a narrow frequency band that is manipulated. The most common variation is the Huggins Pitch, which presents white-noise that only differ in the interaural phase relation over a narrow range of frequencies. For humans, this phenomenon is restricted to fundamental frequencies lower than 330 Hz and extremely low sound pressure levels. Experts investigate the effects of the dichotic pitch on the brain. For instance, there are studies that suggested it evokes activation at the lateral end of Heschl's gyrus.

Minimum audibility curve is a standardized graph of the threshold of hearing frequency for an average human, and is used as the reference level when measuring hearing loss with an audiometer as shown on an audiogram.

Psychoacoustics is the branch of psychophysics involving the scientific study of sound perception and audiology—how human auditory system perceives various sounds. More specifically, it is the branch of science studying the psychological responses associated with sound. Psychoacoustics is an interdisciplinary field of many areas, including psychology, acoustics, electronic engineering, physics, biology, physiology, and computer science.

Infrasound is sound at frequencies lower than the low frequency end of human hearing threshold at 20 Hz. It is known, however, that humans can perceive sounds below this frequency at very high pressure levels. Infrasound can come from many natural as well as man-made sources, including weather patterns, topographic features, ocean wave activity, thunderstorms, geomagnetic storms, earthquakes, jet streams, mountain ranges, and rocket launchings. Infrasounds are also present in the vocalizations of some animals. Low frequency sounds can travel for long distances with very little attenuation and can be detected hundreds of miles away from their sources.

References

  1. 1 2 3 4 5 Durrant J D., Lovrinic J H. 1984. Bases of Hearing Sciences. Second Edition. United States of America: Williams & Wilkins
  2. 1 2 3 4 5 6 7 8 9 10 11 Gelfand S A., 2004. Hearing an Introduction to Psychological and Physiological Acoustics. Fourth edition. United States of America: Marcel Dekker
  3. RMS sound pressure can be converted to plane wave sound intensity using , where ρ is the density of air and is the speed of sound
  4. 1 2 3 4 5 6 7 8 9 10 Gelfand, S A., 1990. Hearing: An introduction to psychological and physiological acoustics. 2nd edition. New York and Basel: Marcel Dekker, Inc.
  5. Johnson, Keith (2015). Acoustic and Auditory Phonetics (third ed.). Wiley-Blackwell.
  6. Jones, Pete R (November 20, 2014). "What's the quietest sound a human can hear?" (PDF). University College London. Archived from the original (PDF) on 2016-03-24. Retrieved 2016-03-16. On the other hand, you can also see in Figure 1 that our hearing is slightly more sensitive to frequencies just above 1 kHz, where thresholds can be as low as −9 dBSPL!
  7. Feilding, Charles. "Lecture 007 Hearing II". College of Santa Fe Auditory Theory. Archived from the original on 2016-05-07. Retrieved 2016-03-17. The peak sensitivities shown in this figure are equivalent to a sound pressure amplitude in the sound wave of 10 μPa or: about -6 dB(SPL). Note that this is for monaural listening to a sound presented at the front of the listener. For sounds presented on the listening side of the head there is a rise in peak sensitivity of about 6 dB [−12 dB SPL] due to the increase in pressure caused by reflection from the head.
  8. Montgomery, Christopher. "24/192 Music Downloads ...and why they make no sense". xiph.org. Archived from the original on 2016-03-14. Retrieved 2016-03-17. The very quietest perceptible sound is about -8dbSPL
  9. 1 2 Hirsh I J.,1952. "The Measurement of Hearing". United States of America: McGraw-Hill.
  10. Hirsh I J.,Watson C S., 1996. Auditory Psychophysics and Perception. Annu. Rev. Psychol. 47: 461–84. Available to download from: http://arjournals.annualreviews.org/doi/pdf/10.1146/annurev.psych.47.1.461 . Accessed 1 March 2007.
  11. Miller et al., 2002. "Nonparametric relationships between single-interval and two-interval forced-choice tasks in the theory of signal detectability". Journal of Mathematical Psychology archive. 46:4;383–417. Available from: http://portal.acm.org/citation.cfm?id=634580. Accessed 1 March 2007.
  12. 1 2 Levitt H. (1971). "Transformed up-down methods in psychoacoustics". J. Acoust. Soc. Am. 49 (2): 467–477. doi:10.1121/1.1912375. PMID   5541744 . Retrieved 1 March 2007.
  13. Arlinger, S. 1991. Manual of Practical Audiometry: Volume 2 (Practical Aspects of Audiology). Chichester: Whurr Publishers.
  14. 1 2 Kidd G. 2002. Psychoacoustics IN Handbook of Clinical Audiology. Fifth Edition.