Demographics of Uruguay

Last updated

Demographics of Uruguay
Uruguay single age population pyramid 2020.png
Uruguay population pyramid in 2020
PopulationIncrease2.svg 3.444.263 (2023 census) [1]
DensityIncrease2.svg 19.43/km2
Growth rateDecrease2.svg 0.27% (2023 est.) [2]
Birth rateDecrease2.svg 12.65 births/1,000 population (2023 est.) [2]
Death rateDecrease Positive.svg 9.12 deaths/1,000 population (2023 est.) [2]
Life expectancyIncrease2.svg 78.66 years
  maleIncrease2.svg 75.58 years
  femaleIncrease2.svg 81.86 years (2023 est.) [2]
Fertility rateDecrease2.svg 1.75 children born/woman (2023 est.) [2]
Infant mortality rateDecrease Positive.svg 8.14 deaths/1,000 live births (2023 est.) [2]
Net migration rateIncrease2.svg -0.88 migrant(s)/1,000 population (2024 est.) [2]
Age structure
0–14 yearsDecrease2.svg 18.9% (male 329,268/ female 317,925)
15–64 yearsIncrease2.svg 65.4% (male 1,112,622/ female 1,128,418)
65 and overIncrease Negative.svg 15.7% (male 218,242/ female 318,855) (2023 est.) [2]
Sex ratio
Total0.94 male(s)/female (2023 est.) [2]
At birth1.04 male(s)/female
Under 151.04 male(s)/female
15–64 years0.98 male(s)/female
65 and over0.68 male(s)/female
Nationality
Nationality Uruguayan
Major ethnic
Minor ethnic
Language
Official Spanish
Spoken Italian  · Galician  · Basque

This is a demography of the population of Uruguay including population density, ethnicity, education level, health of the populace, economic status, religious affiliations and other aspects of the population.

Contents

Population

Census population in thousands
YearPop.±% p.a.
1852132    
1860229.5+7.16%
19081,042.7+3.20%
19632,595.5+1.67%
19752,788.4+0.60%
19852,955.2+0.58%
19963,163.8+0.62%
20043,241+0.30%
20113,286.3+0.20%
20233,444.3+0.39%

According to the 2022 revision of the World Population Prospects [4] [5] the total population was 3,426,260 in 2021, compared to only 2,239,000 in 1950. The proportion of children below the age of 15 in 2015 was 21.4%, 64.2% was between 15 and 65 years of age, while 14.4% was 65 years or older. [6]

Total populationProportion
aged 0–14
(%)
Proportion
aged 15–64
(%)
Proportion
aged 65+
(%)
19502 239 00027.963.98.2
19552 373 00027.664.38.1
19602 539 00027.864.18.1
19652 695 00028.163.68.3
19702 810 00027.963.38.8
19752 830 00027.762.79.6
19802 916 00026.962.710.4
19853 012 00026.862.310.9
19903 110 00026.062.411.6
19953 225 00025.062.612.4
20003 321 00024.562.413.0
20053 326 00023.862.813.5
20103 374 00022.563.713.8
20153 432 00021.464.214.4

Structure of the population

Population by Sex and Age Group (Census 04.X.2011) (Excluding 437 homeless persons.): [7]
Age groupMaleFemaleTotal%
Total1 577 4161 708 4613 285 877100
0-4112 704107 641220 3456.71
5-9121 820116 248238 0687.25
10-14131 022125 530256 5527.81
15-19133 042128 649261 6917.96
20-24119 928121 078241 0067.33
25-29112 852115 533228 3856.95
30-34113 884119 481233 3657.10
35-39108 704113 817222 5216.77
40-4498 612104 486203 0986.18
45-4995 812102 961198 7736.05
50-5493 175101 390194 5655.92
55-5981 82891 179173 0075.27
60-6469 86480 911150 7754.59
65-6958 76972 794131 5634.00
70-7447 70564 690112 3953.42
75-7936 80656 85393 6592.85
80-8424 91245 59370 5052.15
85-8911 53525 89137 4261.14
90-943 63610 47714 1130.43
95-997332 8133 5460.11
100+734465190.02
Age groupMaleFemaleTotalPercent
0-14365 546349 419714 96521.76
15-641 027 7011 079 4852 107 18664.13
65+184 169279 557464 02614.12
Population Estimates by Sex and Age Group (01.VII.2021) (Data refer to national projections.): [7]
Age GroupMaleFemaleTotal%
Total1 718 0891 824 9363 543 026100
0–4115 596110 257225 8536.37
5–9117 523112 140229 6636.48
10–14120 433115 127235 5606.65
15–19127 596122 265249 8617.05
20–24135 201130 480265 6827.50
25–29134 040131 180265 2207.49
30–34125 736124 495250 2317.06
35–39118 584119 068237 6526.71
40–44118 608122 445241 0536.80
45–49111 148115 632226 7806.40
50–5499 048106 336205 3845.80
55–5994 956104 859199 8165.64
60–6486 97499 168186 1425.25
65-6971 45386 108157 5604.45
70-7454 56871 791126 3603.57
75-7939 69558 86098 5552.78
80-8425 48744 66270 1491.98
85-8914 09830 17944 2771.25
90+7 34319 88527 2270.77
Age groupMaleFemaleTotalPercent
0–14353 552337 524691 07619.51
15–641 151 8931 175 9272 327 82065.70
65+212 644311 485524 12914.79

Vital statistics

UN estimates

The Population Department of the United Nations prepared the following estimates for Uruguay. [8]

PeriodLive births
per year
Deaths
per year
Natural change
per year
CBR*CDR*NC*TFR*IMR*Life expectancy
total
Life expectancy
males
Life expectancy
females
1950–195549,00024,00025,00021.210.510.72.735766.063.369.3
1955–196054,00025,00029,00021.910.011.92.835367.064.270.3
1960–196557,00025,00032,00021.99.512.42.904868.365.371.5
1965–197056,00026,00030,00020.59.610.82.804768.565.571.8
1970–197560,00028,00032,00021.110.011.13.004668.765.672.1
1975–198058,00029,00029,00020.210.110.12.894269.566.373.1
1980–198554,00029,00025,00018.39.88.52.573470.967.674.5
1985–199056,00030,00026,00018.29.88.42.532372.168.675.7
1990–199558,00031,00027,00018.29.78.52.492073.069.276.8
1995–200055,00031,00024,00016.99.57.42.301674.270.477.9
2000–200553,00031,00022,00015.99.56.52.201475.371.678.9
2005–201051,00031,00020,00015.19.35.82.121376.472.779.9
2010–201549,00032,00017,00014.59.45.12.051177.173.680.5
2015–202049,00032,00017,00014.19.34.82.001077.974.581.1
* CBR = crude birth rate (per 1000); CDR = crude death rate (per 1000); NC = natural change (per 1000); IMR = infant mortality rate per 1000 births; TFR = total fertility rate (number of children per woman)

Total fertility rate (1880–1899)

The total fertility rate is the number of children born per woman. It is based on fairly good data for the entire period. Sources: Our World In Data and Gapminder Foundation. [9]

Years18801881188218831884188518861887188818891890 [9]
Total Fertility Rate in Uruguay5.765.765.765.715.215.455.565.645.635.575.45
Years189118921893189418951896189718981899 [9]
Total Fertility Rate in Uruguay5.445.315.045.115.255.074.34.54.6

Births and deaths

Average population [10] [11] Live birthsDeathsNatural changeCrude birth rate (per 1000)Crude death rate (per 1000)Natural change (per 1000) Total fertility rate [fn 1] [9]
1900926,00030,58012,87817,70233.013.919.14.5
1901951,00031,70312,50419,19933.313.120.24.41
1902976,00031,52613,43918,08732.313.818.54.31
19031,004,00032,60013,67318,92732.513.618.94.34
19041,023,00026,98411,51515,46926.411.315.14.37
19051,056,00033,70913,61220,09731.912.919.04.4
19061,087,00032,57815,08317,49530.013.916.14.42
19071,124,00033,65715,56118,09629.913.816.14.45
19081,043,00035,52014,42121,09934.113.820.24.43
19091,079,00035,66315,24920,41433.114.118.94.41
19101,116,00035,92716,51519,41232.214.817.44.38
19111,160,00037,53016,55220,97832.414.318.14.36
19121,208,00039,17116,74522,42632.413.918.64.34
19131,261,00040,31515,37424,94132.012.219.84.22
19141,297,00038,57115,35023,22129.711.817.94.1
19151,327,00038,04616,60221,44428.712.516.23.98
19161,359,00036,98320,33816,64527.215.012.23.86
19171,387,00036,75217,34819,40426.512.514.03.74
19181,409,00038,91420,00918,90527.614.213.43.69
19191,442,00039,30718,90420,40327.313.114.13.64
19201,473,00039,33519,04120,29426.712.913.83.59
19211,505,00039,61118,44921,16226.312.314.13.53
19221,542,00040,26116,41523,84626.110.615.53.48
19231,579,00040,23118,11022,12125.511.514.03.45
19241,616,00041,88019,13222,74825.911.814.13.43
19251,653,00042,16719,33222,83525.511.713.83.4
19261,695,00043,09117,82825,26325.410.514.93.37
19271,737,00042,84519,93922,90624.711.513.23.34
19281,782,00044,63219,07025,56225.010.714.33.27
19291,823,00044,23619,66024,57624.310.813.53.2
19301,875,00045,71820,04925,66924.410.713.73.13
19311,922,00044,85421,16323,69123.311.012.33.06
19321,956,00044,03619,82524,21122.510.112.42.99
19331,982,00041,65020,35821,29221.010.310.72.93
19342,007,00041,33720,06521,27220.610.010.62.86
19352,030,00041,42621,51419,91220.410.69.82.8
19362,053,00040,70519,84320,86219.89.710.22.74
19372,080,00041,33721,56119,77619.910.49.52.68
19382,108,00041,70121,65820,04319.810.39.5
19392,132,00042,86219,34123,52120.19.111.0
19402,155,00042,89320,69522,19819.99.610.3
19412,175,00044,28720,38123,90620.49.411.0
19422,194,00042,67020,64622,02419.49.410.0
19432,211,00043,50020,73822,76219.79.410.3
19442,216,00046,44319,99026,45321.09.011.9
19452,266,00049,02119,62729,39421.68.713.0
19462,290,00048,97818,41530,56321.48.013.3
19472,317,00046,79620,13926,65720.28.711.5
19482,343,00049,03319,32629,70720.98.212.7
19492,383,00054,83818,35136,48723.07.715.3
19502,239,00056,85819,19937,65925.48.616.8
19512,261,00045,28119,19026,09120.08.511.5
19522,286,00046,71019,08327,62720.48.412.1
19532,313,00047,46419,40828,05620.58.412.1
19542,342,00049,88819,15330,73521.38.213.1
19552,373,00056,11120,61135,50023.78.715.0
19562,405,00056,38919,89536,49423.58.315.2
19572,438,00056,33721,72234,61523.18.914.2
19582,471,00057,10020,93736,16323.18.514.6
19592,505,00056,58923,52333,06622.69.413.2
19602,539,00056,30222,10438,50722.28.715.2
19612,572,00054,95021,95442,50321.48.516.5
19622,604,00056,12022,56343,54121.68.716.7
19632,635,00057,14123,52439,54221.78.915.0
19642,666,00055,10024,11838,70720.79.014.5
19652,695,00053,83024,77435,44020.09.213.2
19662,723,00051,12024,86233,96618.89.112.5
19672,750,00052,01026,48434,02418.99.612.4
19682,775,00053,33025,99135,27719.29.412.7
19692,795,00056,75027,54428,45620.39.910.2
19702,810,00054,87026,44128,42919.59.410.1
19712,818,00055,99028,52727,46319.910.19.7
19722,822,00056,47028,32728,14320.010.010.0
19732,822,00056,64028,43828,20220.110.110.0
19742,824,00058,28028,28929,99120.710.010.6
19752,830,00059,14027,43731,70320.99.711.2
19762,842,00059,19028,84530,34520.810.210.7
19772,857,00057,97628,92729,04920.310.110.2
19782,876,00057,27628,04129,23519.99.810.2
19792,896,00055,77028,32127,44919.39.89.5
19802,916,00053,85429,84424,01019.110.68.5
19812,935,00053,92327,64426,27918.49.49.0
19822,954,00053,71327,18626,52718.29.29.0
19832,973,00053,40528,47524,93018.09.68.4
19842,993,00053,34830,01123,33717.810.07.8
19853,012,00053,76628,56625,20017.99.58.4
19863,031,00054,08028,79125,28917.99.58.4
19873,050,00053,36829,88523,48317.59.87.7
19883,069,00055,79830,91224,88618.210.18.1
19893,089,00055,32429,62125,70317.99.68.3
19903,110,00056,01330,21026,27718.09.78.5
19913,132,00054,75429,77424,98017.59.58.02.51
19923,155,00054,19030,00824,18217.29.57.72.49
19933,178,00055,95331,61624,33717.69.97.72.46
19943,201,00055,99030,12225,86817.59.48.12.43
19953,224,00056,69531,52525,17017.69.87.82.40
19963,248,00058,86231,10827,75418.19.68.52.40
19973,271,00058,03230,45127,58117.79.38.42.24
19983,292,00054,76031,91722,84316.69.76.92.29
19993,309,00054,00432,43021,57416.39.86.52.24
20003,321,00052,77030,45622,31415.99.26.72.21
20013,327,00051,95931,22820,73115.69.46.22.16
20023,328,00051,95331,62820,32515.69.56.12.18
20033,325,00050,63132,58718,04415.29.85.42.14
20043,324,00050,05232,22017,83215.19.75.42.13
20053,325,00046,94432,31914,62514.19.74.41.99
20063,330,00047,41031,05616,35414.29.34.92.01
20073,338,00047,37333,70613,66714.210.14.11.98
20083,349,00047,48431,36316,12114.29.44.81.97
20093,360,00047,15232,17914,97314.19.64.51.93
20103,372,00047,42033,47413,94614.110.04.21.92
20113,383,00046,69932,80713,89213.99.74.11.90
20123,426,00048,20033,00215,19814.39.84.51.94
20133,440,00048,68132,79515,88614.29.54.71.96
20143,453,00048,36832,12016,24814.09.44.61.96
20153,467,00048,92632,96715,95914.19.54.61.94
20163,479,00047,04934,27412,77513.59.83.71.88
20173,493,00043,03633,1739,86312.39.52.81.71
20183,506,00040,13934,2695,87011.49.81.61.60
20193,518,00037,46834,8072,66110.69.90.71.49
20203,530,91235,86632,6403,22610.29.21.01.42
20213,543,02634,59741,729-7,1329.811.8-2.01.35
20223,554,91532,30139,376-7,0759.111.1-2.01.28
20233,444,30031,38134,677-3,2969.110.1-1.01.25

Current vital statistics

[12]

PeriodLive birthsDeathsNatural increase
January - May 202216,657
January - May 202313,750
DifferenceDecrease Positive.svg -2,907 (-17.45%)

Origins and ethnicity

Ethnic groups in Uruguay [13] [3]

   White (87.7%)
   Black (4.6%)
   Indigenous (2.4%)
   Asian (0.2%)
  Other/none (5.1%)

Most Uruguayans are descended from colonial-era settlers and immigrants from Europe with almost 88% of the population being of either sole or partial European descent, [14] with a majority of these being Spaniards, followed closely by Italians, and smaller numbers of French, Germans, Portuguese, British (English or Scots), Irish, Swiss, Russians, Poles, Bulgarians, Hungarians, Ukrainians, Lithuanians, Estonians, Latvians, Swedes, Danes, Dutch, Belgians, Austrians, Croats, Serbs, Greeks and others.

There are also smaller numbers of Western Asian (Turks, Israelis, and Lebanese) and South Caucasus ethnic groups (Armenians, Georgians, and Azeris).

Many Swiss settlements (colonias or "colonies"), such as Colonia Suiza, Colonia Valdense and Nueva Helvecia, were founded in the department of Colonia. Also, there are towns founded by early British settlers, such as Conchillas and Barker. A Russian colony called San Javier was founded in the 1910s in the department of Río Negro. There are also Mennonite colonies in the department of Río Negro and in the department of Canelones.

Many of the European immigrants arrived in the late 19th century and have heavily influenced the architecture and culture of Montevideo and other major cities. For this reason, Montevideo and life within the city are very reminiscent of Western Europe.

The rest of the Uruguayan population is Black/Afro-Uruguayan of African descent and about 1 or 2% are of Asian descent, mostly are Lebanese/Syrian Arab, and Chinese or Japanese ancestry.

Amerindians descendants make up a small population in the Rural North region, with Mestizos making up 6% of the population.

Uruguay has the highest percentage of self-identified White Latin Americans of any country in Latin America, however genetic studies have found that over a third of Uruguayans in the samples studied had Amerindian admixture. [15] [16]

Demographic distribution

Metropolitan Montevideo, with about one and a half million inhabitants, is the capital and largest city. The rest of the urban population lives in about 20 towns. Montevideo is about 200 kilometers (120 mi) away from Buenos Aires in neighboring Argentina.

Uruguay is distinguished by its high literacy rate (97.3%) and a large urban middle class.

As a result of the low birth rate, high life expectancy, and relatively high rate of emigration of younger people, Uruguay's population is quite mature. In 2006, the country had a birth rate of 13.91 births per thousand population, lower than neighboring countries Argentina (16.73 births/1000 population)[3] and Brazil (16.56 births/1,000 population).

Emigration

During the past four decades, an estimated 500,000 Uruguayans had emigrated, principally to Brazil, Argentina and Europe. (Argentina is the main destination for Uruguayans, but they are also drawn to Spain, the United Kingdom, Italy, France and Germany.) [17] Other Uruguayans went to various countries in Europe, Australia and the USA.

Neighboring ties and short distances between Uruguayan cities and Argentine capital Buenos Aires, have drawn a path of success for very talented Uruguayans who settled in the neighbor country and became famous and locally accepted. Some famous Uruguayans who excelled in Argentina are entrepreneur and financier Juan Navarro, sports journalist Victor Hugo Morales, singer and actress Natalia Oreiro, soccer players Antonio Alzamendi, Enzo Francescoli and Carlos Goyen, actor Daniel Hendler, actress China Zorrilla, entertainer Carlos Perciavalle and former playboy and journalist Luis César Avilés.

Emigration to the United States also rose at the beginning of the century, but remains a small part of the US population. The majority of Uruguayans in the US live in New York City, New Jersey, Washington, D.C., Florida, and urban areas of California.

Religion

Religion in Uruguay [18]
ReligionPercent
Roman Catholic
47.1%
Nondenominational
23.2%
Agnostic or Atheist
17.2%
Non-Catholic Christian
11.1%
Other
1.1%
Jewish
0.3%

Uruguay has no official religion, church and state are officially separated, and religious freedom is guaranteed. A 2008 survey by the Instituto Nacional de Estadística of Uruguay gave Catholicism as the main religion, with 45.7% of the population, 9.0% are non-Catholic Christians, 0.6% are Animists or Umbandists (an Afro-Brazilian religion) and 0.4% Jewish. 30.1% reported believing in a god, but not belonging to any religion, while 14% were Atheist or Agnostic. [19] Among the sizeable Armenian community in Montevideo the dominant religion is Christianity, specifically Armenian Apostolic. [20]

Political observers consider Uruguay the most secular country in the Americas. [21] Uruguay's secularization began with the relatively minor role of the church in the colonial era, compared with other parts of the Spanish Empire. The small numbers of Uruguay's Indians and their fierce resistance to proselytism reduced the influence of the ecclesiastical authorities. [22]

After independence, anticlerical ideas spread to Uruguay, particularly from France, further eroding the influence of the church. [23] In 1837, civil marriage was recognized and in 1861 the state took over the running of public cemeteries. In 1907, divorce was legalized and in 1909, all religious instruction was banned from state schools. [22] Under the influence of the Colorado reformer José Batlle y Ordóñez (1903–1911) complete separation of church and state was introduced with the new constitution of 1917. [22]

Demographic statistics

Demographic statistics according to the World Population Review in 2019. [24]

Demographic statistics according to the CIA World Factbook, unless otherwise indicated. [25]

Population

3,369,299 (July 2014 est.)
3,400,425 (July 2018 est.)
3,416,264 (2023 est.)

Note: The 2011 Census of the National Statistics Institute of Uruguay began in September 2011 and the preliminary results, stating population of departments, were announced in December 2011. Final results with numbers for localities were still pending as of 26 June 2012.

Age structure

Population pyramid of the Uruguay in 2017 Uruguaypop.svg
Population pyramid of the Uruguay in 2017
0-14 years: 19.91% (male 341,402 /female 329,474)
15-24 years: 15.56% (male 265,486 /female 258,611)
25-54 years: 39.48% (male 658,871 /female 671,172)
55-64 years: 10.68% (male 169,385 /female 190,392)
65 years and over: 14.38% (male 194,269 /female 290,237) (2018 est.)

Median age

total: 35.5 years. Country comparison to the world: 82nd
male: 33.8 years
female: 37.3 years (2020 est.)
total: 33.6 years
male: 32 years
female: 35.2 years (2011 est.)

Life expectancy at birth

Life expectancy in Uruguay since 1900 Life expectancy in Uruguay.svg
Life expectancy in Uruguay since 1900
Life expectancy in Uruguay since 1960 by gender Life expectancy by WBG -Uruguay -diff.png
Life expectancy in Uruguay since 1960 by gender
total population: 78.66 years. Country comparison to the world: 71st
male: 75.58 years
female: 81.86 years (2023 est.)

Urbanization

urban population: 95.8% of total population (2023)
rate of urbanization: 0.4% annual rate of change (2020-25 est.)

Sex ratio

HIV/AIDS – adult prevalence rate

0.5% (2009 est.)

HIV/AIDS – people living with HIV/AIDS

9,900 (2009 est.)

HIV/AIDS – deaths

fewer than 500 (2007 est.)

Racial groups

Racial groups in Uruguay (2011 est.) [18]
Racial groupsPercent
White
87.7%
Black
4.6%
Indigenous
2.4%
Other
0.3%
None or unespecified
5%

Languages

Spanish, Portuguese, Uruguayan Sign Language.

There are other ethnic minorities speaking their original languages: Italian, Catalan, German, etc.

Literacy

definition: age 15 and over can read and write

total population: 98.6%
male: 98.2%
female: 99% (2017 est.)
total population: 98%
male: 97.6%
female: 98.4% (2003 est.)

School life expectancy (primary to tertiary education)

total: 16 years
male: 14 years
female: 17 years (2008)

Unemployment, youth ages 15-24

total: 23.8%. Country comparison to the world: 52nd
male: 20.2%
female: 28.7% (2016 est.)

Education expenditures

4.5% of GDP (2008)

See also

Notes

  1. In fertility rates, 2.1 and above is a stable population and has been marked blue, 2 and below leads to an aging population and the result is that the population decreases.

Related Research Articles

<span class="mw-page-title-main">Demographics of Botswana</span>

Demographic features of the population of Botswana include population density, ethnicity, education level, health of the populace, economic status, religious affiliations and other aspects.

<span class="mw-page-title-main">Demographics of Cameroon</span>

The demographic profile of Cameroon is complex for a country of its population. Cameroon comprises an estimated 250 distinct ethnic groups, which may be formed into five large regional-cultural divisions:

<span class="mw-page-title-main">Demographics of Cape Verde</span>

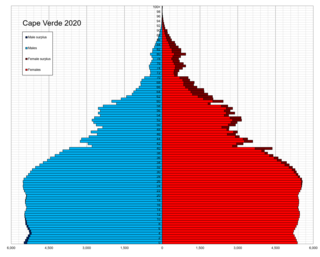
Demographic features of the population of Cape Verde include population density, ethnicity, education level, health of the populace, economic status, religious affiliations and other aspects of the population.

<span class="mw-page-title-main">Demographics of Costa Rica</span>

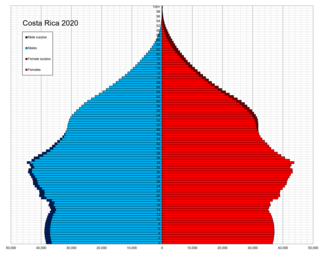
This is a demographic article about Costa Rica's population, including population density, ethnicity, education level, health of the populace, economic status, religious affiliations, and other aspects of the population.

<span class="mw-page-title-main">Demographics of Ivory Coast</span>

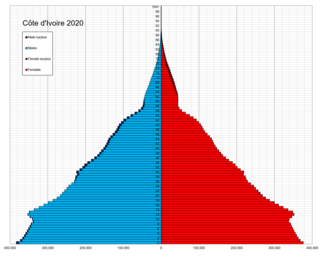
Demographic features of the population of Ivory Coast include population density, ethnicity, education level, health of the populace, economic status, religious affiliations and other aspects of the population.

<span class="mw-page-title-main">Demographics of the Dominican Republic</span>

This is a demography of the population of the Dominican Republic including population density, ethnicity, education level, health of the populace, economic status, religious affiliations and other aspects of the population.

<span class="mw-page-title-main">Demographics of Gabon</span>

The Demographics of Gabon is the makeup of the population of Gabon. As of 2020, Gabon has a population of 2,225,287. Gabon's population is relatively young with 35.5% of its population under 15 years of age and only 4.3% of its population over 65 years old. Gabon has a nearly even split between males and females with 0.99 males for every female in the population. In the age range of 15–65, the ration is exactly 1 male to 1 female. The life expectancy of Gabon is lower than the world average. Gabon's population's life expectancy at birth is 53.11 years while the world average is 67.2 years as of 2010. Ethnically, the biggest group in Gabon are the Fang people with over 500,000 people, or about a third of Gabon's population, belonging to this ethnic group. The biggest religion in Gabon is Christianity, with between 55–75% of the population of Gabon being Christian.

<span class="mw-page-title-main">Demographics of Guatemala</span>

This is a demography of the population of Guatemala including population density, ethnicity, education level, health of the populace, economic status, religious affiliations and other aspects of the population.

<span class="mw-page-title-main">Demographics of Guinea</span>

Demographics of Guinea describes the condition and overview of Guinea's peoples. Demographic topics include basic education, health, and population statistics as well as identified racial and religious affiliations.

<span class="mw-page-title-main">Demographics of Honduras</span>

This article is about the ethnic groups and population of Honduras.

<span class="mw-page-title-main">Demographics of Jamaica</span>

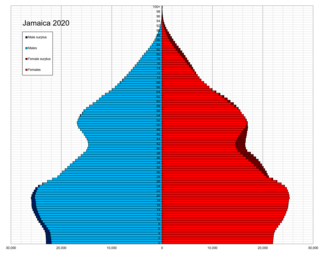
Jamaica is an island country in the Caribbean. The country had a population of 2,825,352 in 2023, the fourth largest in the region.

<span class="mw-page-title-main">Demographics of Laos</span>

Laos is a country in Southeast Asia. The country's population was estimated at 7.43 million in 2021, dispersed unevenly across the country. Most people live in valleys of the Mekong River and its tributaries. Vientiane Prefecture, which includes Vientiane, the capital and largest city of the country, had 820,924 residents as of the 2015 census. The country's population density is 26.7/km2.

<span class="mw-page-title-main">Demographics of Mali</span>

Demographic features of the population of Mali include population density, ethnicity, education level, health of the populace, economic status, religious affiliations and other aspects of the population.

<span class="mw-page-title-main">Demographics of Nicaragua</span>

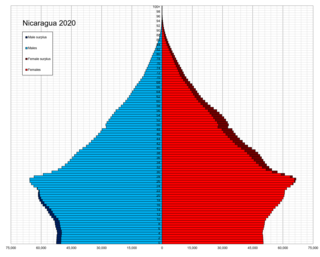
According to the 2022 revision of the World Population Prospects, Nicaragua has a population of 6,850,540..According to a 2014 research published in the journal Genetics and Molecular Biology, European ancestry predominates in 69% of Nicaraguans, followed by African ancestry in 20%, and lastly indigenous ancestry in 11%. A Japanese research of "Genomic Components in America's demography" demonstrated that, on average, the ancestry of Nicaraguans is 58–62% European, 28% Native American, and 14% African, with a very small Near Eastern contribution. Non-genetic data from the CIA World Factbook establish that from Nicaragua's 2016 population of 5,966,798, around 69% are mestizo, 17% white, 5% Native American, and 9% black and other races. This fluctuates with changes in migration patterns. The population is 58% urban as of 2013.

<span class="mw-page-title-main">Demographics of Paraguay</span>

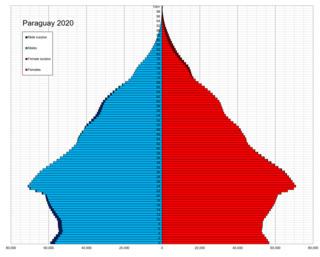
Demographic features of the population of Paraguay include population density, ethnicity, education level, health of the populace, economic status, religious affiliations and other aspects of the population.

<span class="mw-page-title-main">Demographics of Venezuela</span>

Venezuela is a country in South America. The Venezuelan people comprise a combination of heritages, primarily Native American and European. The historically present Native American, Spanish colonists, and African slaves have all contributed to varying degrees. Later, waves of European groups migrated to Venezuela in the 20th century, influencing many aspects of Venezuelan life, including its culture, language, food, and music though small in number.

<span class="mw-page-title-main">Demographics of Argentina</span>

This is a demography of Argentina including population density, ethnicity, economic status and other aspects of the population.

<span class="mw-page-title-main">Demographics of Azerbaijan</span>

This is a demography of the population of Azerbaijan including population density, ethnicity, education level, health of the populace, economic status, religious affiliations and other aspects of the population.

<span class="mw-page-title-main">Demographics of Benin</span>

The demographics of Benin include population density, ethnicity, education level, health of the populace, economic status, religious affiliations and other aspects of the population.

<span class="mw-page-title-main">Demographics of the Gambia</span>

The demographic characteristics of the population of The Gambia are known through national censuses, conducted in ten-year intervals and analyzed by The Gambian Bureau of Statistics (GBOS) since 1963. The latest census was conducted in 2013. The population of The Gambia at the 2013 census was 1.8 million. The population density is 176.1 per square kilometer, and the overall life expectancy in The Gambia is 64.1 years. Since the first census of 1963, the population of The Gambia has increased every ten years by an average of 43.2 percent. Since 1950s, the birth rate has constantly exceeded the death rate; the natural growth rate is positive. The Gambia is in the second stage of demographic transition. In terms of age structure, The Gambia is dominated by 15- to 24-year-old segment (57.6%). The median age of the population is 19.9 years, and the gender ratio of the total population is 0.98 males per female.

References

  1. Proyecto Censal Censo de Población, Hogares y Viviendas 2023 (PDF). Instituto Nacional de Estadística. Departamento de Difusión y Comunicación. May 2021. p. 1.
  2. 1 2 3 4 5 6 7 8 9 "Uruguay". 10 May 2022.
  3. 1 2 Central Intelligence Agency (2016). "Uruguay". The World Factbook. Langley, Virginia: Central Intelligence Agency. Retrieved 1 January 2017.
  4. "World Population Prospects 2022". United Nations Department of Economic and Social Affairs, Population Division. Retrieved 17 July 2022.
  5. "World Population Prospects 2022: Demographic indicators by region, subregion and country, annually for 1950-2100" (XSLX) ("Total Population, as of 1 July (thousands)"). United Nations Department of Economic and Social Affairs, Population Division. Retrieved 17 July 2022.
  6. "World Population Prospects - Population Division - United Nations". esa.un.org.
  7. 1 2 "UNSD — Demographic and Social Statistics". unstats.un.org. Retrieved 10 May 2023.
  8. "World Population Prospects - Population Division - United Nations". population.un.org. Archived from the original on 6 May 2011.
  9. 1 2 3 4 Max Roser (2014), "Total Fertility Rate around the world over the last centuries", Our World In Data, Gapminder Foundation
  10. "United nations. Demographic Yearbooks". Unstats.un.org. Retrieved 15 January 2018.
  11. "Instituto Nacional de Estadistica: Estadisticas vitales". Ine.gub.uy. Archived from the original on 18 September 2013. Retrieved 15 January 2018.
  12. Mathieu, Edouard; Ritchie, Hannah; Rodés-Guirao, Lucas; Appel, Cameron; Giattino, Charlie; Hasell, Joe; MacDonald, Bobbie; Dattani, Saloni; Beltekian, Diana; Ortiz-Ospina, Esteban; Roser, Max (5 March 2020). "Excess mortality using raw death counts". Our World in Data. Retrieved 22 October 2022.
  13. "Atlas Sociodemografico y de la Desigualdad en Uruguay, 2011: Ancestry" (PDF) (in Spanish). National Institute of Statistics. p. 15. Archived from the original (PDF) on 9 February 2014.
  14. "Constituciones hispanoamericanas". Cervantesvirtual.com. Retrieved 15 January 2018.
  15. "En Uruguay hay 115.118 descendientes de indígenas". 14 July 2011.
  16. "En Uruguay un 34% de la población tiene ascendencia indígena".
  17. "Main countries of origin immigrants in Uruguay 2020". Statista. Retrieved 30 January 2022.
  18. 1 2 "South America :: URUGUAY". CIA The World Factbook. 10 May 2022.
  19. "Encuesta Continua de Hogares 2008 – Religion". Instituto Nacional de Estadística. Archived from the original on 14 November 2010. Retrieved 2010-12-02.
  20. 1/0 Technology Corp. – Paul R. Williams, John BUDDAY Running. "Armenian General Benevolent Union – Publications". Agbu.org. Archived from the original on 16 November 2010. Retrieved 2010-12-02.{{cite web}}: CS1 maint: numeric names: authors list (link)
  21. "UMM | Latin American Area Studies – Countries". Morris.umn.edu. 27 August 2009. Archived from the original on 14 July 2010. Retrieved 26 June 2010.
  22. 1 2 3 "Religion – Uruguay". Library of Congress Country Studies. Retrieved 23 February 2011.
  23. "Explore Uruguay – About Uruguay Government". Explore Uruguay. Retrieved 23 March 2011.
  24. "Uruguay Population 2019", World Population Review
  25. "World Factbook EUROPE : United Kingdom", The World Factbook , 12 July 2018