Demographics of Guyana

Last updated

Demographics of Guyana
Guyana single age population pyramid 2020.png
Population pyramid of Guyana in 2020
Population789,683 (2022 est.)
Growth rate0.24% (2022 est.)
Birth rate16.72 births/1,000 population (2022 est.)
Death rate6.91 deaths/1,000 population (2022 est.)
Fertility rate2.35 children
Net migration rate-7.42 migrant(s)/1,000 population (2022 est.)
Age structure
0–14 years23.91%
65 and over7.01%
Nationality
NationalityGuyanese
Historical population
YearPop.±%
1831 98,000    
1911 296,041+202.1%
1931 310,933+5.0%
1946 375,701+20.8%
1960 560,330+49.1%
1970 701,718+25.2%
1980 759,567+8.2%
1991 723,673−4.7%
2002 751,223+3.8%
2012 746,955−0.6%
2015 741,962−0.7%
Source: [1]

This is a demography of Guyana including population density, ethnicity, education level, health of the populace, economic status, religious affiliations and other aspects of the population.

Contents

Guyana's population (Guyanese people) is made up of five main ethnic groups: Indians, Africans, Amerindians, Europeans (mainly Portuguese), and Chinese. Ninety percent of the inhabitants live on the narrow coastal plain, where population density is more than 115 inhabitants per square kilometre (300/sq mi). The population density for Guyana as a whole is low: less than four inhabitants per square kilometre (10.4/sq mi).

Guyana continues to be influenced by British and Indian culture as well as the cultures of the United States, Europe, Africa, the Islamic world, East and South Asian countries, and Latin America, especially the neighbouring countries of Venezuela and Brazil. It is one of two countries and three territories to form the Guianas, such as Suriname and territories like the French Guiana and parts of neighbouring countries named for Guayana (Venezuela) and Amapá of Brazil.

Population

According to the 2022 revision of the World Population Prospects [2] [3] , the total population was 804,567 in 2021. The proportion of children below the age of 15 in 2010 was 33.6%, 62.1% was between 15 and 65 years of age, while 4.3% was 65 years or older. [4]

YearTotal population
( × 1000)
Popluation percentage in age bracket
aged 0–14aged 15–64aged 65+
1950407
39.9%
56.0%
4.1%
1955483
43.6%
52.8%
3.6%
1960560
46.3%
50.4%
3.3%
1965640
47.7%
49.0%
3.4%
1970721
48.7%
47.9%
3.4%
1975749
45.5%
50.9%
3.6%
1980777
42.5%
53.7%
3.8%
1985752
38.6%
57.0%
4.4%
1990725
34.4%
60.6%
5.0%
1995728
34.6%
60.4%
5.0%
2000733
35.5%
60.0%
4.5%
2005746
36.9%
59.3%
3.8%
2010754
33.6%
62.1%
4.3%
2020750
23.9%
69.1%
7.0%

Structure of the population

Population by Sex and Age Group (Census 15.IX.2012): [5]
Age GroupMaleFemaleTotal%
Total371 805375 150746 955100
0–435 87634 56470 4409.43
5–935 95435 31471 2689.54
10–1442 30240 83783 13911.13
15–1942 74942 04984 79811.35
20–2431 35031 93263 2828.47
25–2925 48726 57452 0616.97
30–3426 10326 99653 0997.11
35–3925 45726 02251 4796.89
40–4424 21223 74347 9556.42
45–4921 57321 54243 1155.77
50–5418 87818 56637 4445.01
55–5914 04514 99829 0433.89
60–6410 47911 03421 5132.88
65-696 6387 19713 8351.85
70-744 8175 52210 3391.38
75-793 0373 8716 9080.92
80-841 7142 3654 0790.55
85+1 1342 0243 1580.42
Age groupMaleFemaleTotalPercent
0–14114 132110 715224 84730.10
15–64240 333243 456483 78964.77
65+17 34020 97938 3195.13

Age structure


0–14 years: 35.6% (male 135,629; female 131,518; total 267,146)
15–64 years: 60.2% (male 226,058; female 226,551; total 452,609)
65 years and over: 4.2% (male 14,347; female 17,120; total 31,467) (2002 census) [6] [7]

Vital statistics

The Population Department of the United Nations prepared the following estimates of vital statistics of Guyana. [4]

PeriodLive births
per year
Deaths
per year
Natural change
per year
CBR*CDR*NC*TFR*IMR*Life expectancy
totalmalesfemales
1950–195520,0008,00012,00049.418.131.46.6811849.246.552.0
1955–196023,0008,00015,00047.515.831.76.7710751.749.454.1
1960–196525,0008,00017,00041.513.627.96.159853.751.855.6
1965–197027,0008,00019,00040.012.527.56.119255.153.856.4
1970–197525,0007,00018,00034.111.023.24.908357.255.958.6
1975–198024,0007,00017,00031.110.021.03.947758.857.460.3
1980–198523,0007,00016,00028.79.619.13.267360.057.962.5
1985–199019,0007,00012,00026.49.816.62.706860.657.963.8
1990–199519,0007,00012,00023.59.813.72.556361.458.564.9
1995–200018,0007,00011,00022.08.913.02.505663.160.166.6
2000–200516,0007,0009,00020.17.612.52.434965.762.769.1
2005–201014,0006,0008,00018.85.912.92.334268.765.571.9
*CBR = crude birth rate (per 1000); CDR = crude death rate (per 1000); NC = natural change (per 1000); IMR = infant mortality rate per 1000 births; TFR = total fertility rate (number of children per woman)

Vital statistics

[8]

PopulationLive birthsDeathsNatural changeCrude birth rate (per 1000)Crude death rate (per 1000)Natural change (per 1000)Total fertility rateInfant mortality rate
194816 5765 43711 139
194917 1375 26411 873
195016 9855 93811 047
195118 3575 63712 720
195219 5555 77213 783
195320 1485 87614 272
195420 2635 63514 628
195521 0735 55715 516
195621 6685 38016 288
195722 9835 72617 257
195823 6615 19518 466
195924 4675 31319 154
196023 7185 16718 551
196124 3235 06919 254
196225 3164 66420 652
196325 7964 57321 223
196425 5414 74820 793
196525 8304 70521 125
196626 3485 23421 114
196723 3355 38817 947
196823 4675 61917 848
196922 129
197023 7034 80818 895
197122 9335 24817 685
197225 0655 96219 103
197324 1005 59918 501
197423 1006 16116 939
197523 2005 92417 276
197624 2006 25116 949
19775 883
197823 2006 00017 200
19844 781
1992712 415
1993734 8544 5146.1
1994745 9944 3045.8
1995760 379
1996770 139
1997775 1375 1176.6
1998773 4324 9776.4
1999770 5844 1975.4
2000756 395
2001753 8624 6296.1
2002751 6475 0036.7
2003749 7394 9866.7
2004748 1445 1416.9
2005746 86514 8605 2309 63019.97.012.922.0
2006745 89814 8305 0209 81019.96.713.219.2
2007745 24614 5005 0409 46019.56.812.720.3
2008774 44315 2404 98010 26019.76.413.217.5
2009753 22714 4615 2709 19119.27.012.210.8
2010752 11314 2905 2609 03019.07.012.014.7
2011750 66314 1105 1808 93018.86.911.914.4
2012746 72413 7805 1608 62018.56.911.513.8
2013749 28913 8204 9308 89018.46.611.92.612.9
2014751 97514 8005 4609 34019.77.312.423.3
2015754 80313 0605 0508 01017.36.710.621.8
2016757 7595 1096.7
2017760 80713 6084 9098 69917.96.511.4
2018763 89914 6594 55810 10119.26.013.2
2019766 9865 5607.2
2020770 0263 5034.5
2021772 9757 1549.3
20226 818

Fertility and births

Total Fertility Rate (TFR) (Wanted Fertility Rate) and Crude Birth Rate (CBR): [9]

YearTotalUrbanRural
CBRTFRWFRCBRTFRWFRCBRTFRWFR
200521.32.620.32.421.72.8
2009232.82.1172.11.7243.02.3

Ethnic groups

Ethnic groups of Guyana (2012 Census)
Ethnic groupspercent
Indian
39.83%
Black
29.25%
Mixed
19.88%
Amerindian
9.51%
Other (includes Chinese, European)
0.5%

The present population of Guyana is racially and ethnically heterogeneous, with ethnic groups originating from India, Africa, Europe, and China, as well as indigenous or aboriginal peoples.

The largest ethnic group are the Indo-Guyanese, the descendants of indentured labourers from India, who make up 39.8% of the population, according to the 2012 census. [10] They are followed by the Afro-Guyanese, the descendants of enslaved labourers from Africa, who constitute 29.3. Guyanese of mixed heritage make up 19.9%. [10]

Indigenous peoples, known locally as Amerindians, make up 10.5%. The indigenous groups include the Arawaks, the Wai Wai, the Caribs, the Akawaio, the Arecuna, the Patamona, the Wapixana, the Macushi, and the Warao. [10] The two largest groups, the Indo-Guyanese and Afro-Guyanese, have experienced some racial tension. [11] [12] [13] [14]

Most Indo-Guyanese are descended from indentured labourers who migrated from North India, especially the Bhojpur and Awadh regions of the Hindi Belt in the present day states of Uttar Pradesh, Bihar and Jharkhand. [15] A significant minority of Indo-Guyanese are also descended from indentured migrants who came from the South Indian states of Tamil Nadu and Andhra Pradesh. [16] Among the immigrants there were many labourers from other parts of South Asia such as Nepal, Bengal, Chota Nagpur, and Northwestern India - the modern states of Punjab, Haryana - which was at the time a part of the state of Uttar Pradesh and Rajasthan.

The distribution pattern in the 2002 census was similar to those of the 1980 and 1991 censuses, but the share of the two main groups has declined. Indo-Guyanese made up 51.9% of the total population in 1980, but by 1991 this had fallen to 48.6%, and then to 43.5% in the 2002 census. Those of African descent increased slightly from 30.8% to 32.3% during the first period (1980 and 1991) before falling to 30.2% in the 2002 census. With small growth in the overall population, the decline in the shares of the two larger groups has resulted in the relative increase of shares of the multiracial and Amerindian groups.

The Amerindian population rose by 22,097 people between 1991 and 2002. This represents an increase of 47.3% or annual growth of 3.5%. Similarly, the multiracial population increased by 37,788 persons, representing a 43.0% increase or annual growth rate of 3.2% from the base period of 1991 census.

The number of Chinese is about 0.2% and the White population (mostly consisting of Portuguese) is about 0.3%. [17] [18]

Population of Guyana according to ethnic group [19] [20] [21]
Census year Indian Black Mixed Amerindian White Chinese OtherTotal
# %# %# %# %# %# %# %
1946163,434
43.5%
143,385
38.2%
37,685
10.0%
16,322
4.3%
8,543
2.3%
3,567
0.9%
2,765
0.7%
375,701
1960267,840
47.8%
183,980
32.8%
67,189
12.0%
25.450
4.5%
3,218
0.6%
4,074
0.7%
8,655
1.5%
560,406
1980394,417
51.9%
234,094
30.8%
84,764
11.2%
40,343
5.3%
3,790
0.5%
1,864
0.2%
294
0.0%
759,566
1991351,939
48.6%
233,465
32.3%
87,881
12.1%
46,722
6.5%
2,267
0.3%
1,290
0.2%
107
0.0%
723,671
2002326,277
43.4%
227,062
30.2%
125,727
16.7%
68,675
9.1%
1,974
0.3%
1,396
0.2%
112
0.0%
751,223
2012297,493
39.8%
218,483
29.3%
148,532
19.9%
78,492
10.5%
2,325
0.3%
1,377
0.2%
253
0.0%
746,955

Language

English is the official language of Guyana, which is the only South American country with English as the official language. [22] [23]

Guyanese Creole (an English-based creole with African and Indian syntax) is widely spoken in Guyana. [22]

A number of Amerindian languages are also spoken by a minority of the population. These include Cariban languages such as Macushi, Akawaio and Wai-Wai, and Arawakan languages such as Arawak (or Lokono) and Wapishana. [22] [23]

Other languages include Chinese spoken by some members of the Chinese community, Portuguese spoken by some Portuguese Guyanese, Dutch spoken by Surinamese in Guyana, and Guyanese Hindustani and Tamil spoken by a few older members of the Indian Guyanese community, as well as Sarnami Hindustani spoken by Indians from Suriname. [22] [23]

Second and third languages

Portuguese is increasingly widely used as a second language in Guyana, particularly in the south of the country near the Brazil border. [22] Dutch and French are spoken by those who frequently visit neighbouring Suriname and French Guiana respectively. French is widely taught in secondary schools along with Spanish as foreign languages. Spanish is also used by a minority of the population as a second language. Spanish is spoken typically by visitors and residents from Venezuela. [24]

Religion

Religion in Guyana (2012 census) [25]

   Pentecostal (22.8%)
   Anglican (5.2%)
   Methodist (1.4%)
   Roman Catholic (7.1%)
  Other Christians [lower-alpha 1] (20.8%)
   Hindu (24.8%)
   Muslim (6.8%)
  Other (2.6%)
   Irreligious (3.1%)

Notes

  1. Mostly made up of other Protestants, but also Eastern Orthodox, Mormons, and other Christians.

Related Research Articles

The Demographics of French Guiana are characterized by a young population with 44% below the age of 20 as of 2017. The total population stood at 268,700 as of January 1, 2017. The demographic profile is a reflection of the territory's high fertility rates. Regarding nationality, as of 2010, 64.5% of the population had French nationality, while 35.5% were of foreign nationality with significant communities from Suriname, Haiti, and Brazil among others.

<span class="mw-page-title-main">Demographics of Suriname</span>

This is a demography of the population of Suriname, including population density, ethnicity, education level, health of the populace, economic status, religious affiliations, and other aspects of the population.

<span class="mw-page-title-main">Demographics of Trinidad and Tobago</span>

This article is about the demography of the population of Trinidad and Tobago including population density, ethnicity, education level, health of the populace, economic status, religious affiliations and other aspects of the population.

Indo-Caribbeans or Indian-Caribbeans are people in the Caribbean who are descendants of the Jahaji indentured laborers from India and the wider subcontinent, who were brought by the British, Dutch, and French during the colonial era from the mid-19th century to the early 20th century. A minority of them are descendants from people who immigrated as entrepreneurs, businesspeople, merchants, engineers, doctors, religious leaders and other professional occupations beginning in the mid-20th century.

<span class="mw-page-title-main">The Guianas</span> Region in north-central South America

The Guianas, also spelled Guyanas or Guayanas, is a region in north-eastern South America. Strictly, the term refers to the three Guyanas: Guyana, Suriname and French Guiana, formerly British, Dutch and French Guyana. Broadly it refers to the South American coast from the mouth of the Oronoco to the mouth of the Amazon.

Indo-Guyanese or Indian-Guyanese, are Guyanese nationals of Indian origin who trace their ancestry to India and the wider subcontinent. They are the descendants of indentured servants and settlers who migrated from India beginning in 1838, and continuing during the British Raj.

<span class="mw-page-title-main">Macushi</span> Indigenous people of Brazil

The Macushi are an indigenous people living in the borderlands of southern Guyana, northern Brazil in the state of Roraima, and in an eastern part of Venezuela.

<span class="mw-page-title-main">Wapishana</span> Indigenous people of Brazil

The Wapishana or Wapichan are an indigenous group found in the Roraima area of northern Brazil and southern Guyana.

<span class="mw-page-title-main">Caribbean Hindustani</span> Indo-Aryan language spoken in the Caribbean

Caribbean Hindustani is an Indo-Aryan language spoken by Indo-Caribbeans and the Indo-Caribbean diaspora. It is a koiné language mainly based on the Bhojpuri and Awadhi dialects. These Hindustani dialects were the most spoken dialects by the Indians who came as immigrants to the Caribbean from Colonial India as indentured laborers. It is closely related to Fiji Hindi and the Bhojpuri-Hindustani spoken in Mauritius and South Africa.

The Indian indenture system was a system of indentured servitude, by which more than 1.6 million workers from British India were transported to labour in European colonies, as a substitute for slave labor, following the abolition of the trade in the early 19th century. The system expanded after the abolition of slavery in the British Empire in 1833, in the French colonies in 1848, and in the Dutch Empire in 1863. British Indian indentureship lasted till the 1920s. This resulted in the development of a large South Asian diaspora in the Caribbean, Natal, East Africa, Réunion, Mauritius, Sri Lanka, Malaysia, Myanmar, and Fiji, as well as the growth of Indo-Caribbean, Indo-African, Indo-Mauritian, Indo-Fijian, Indo-Malaysian, and Indo-Singaporean populations.

<span class="mw-page-title-main">Guyana</span> Caribbean country in South America

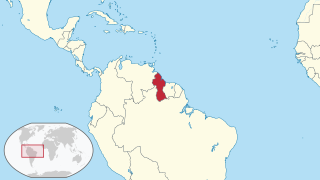
Guyana, officially the Co-operative Republic of Guyana, is a country on the northern coast of South America, part of the historic mainland British West Indies. Guyana is an indigenous word which means "Land of Many Waters". Georgetown is the capital of Guyana and is also the country's largest city. Guyana is bordered by the Atlantic Ocean to the north, Brazil to the south and southwest, Venezuela to the west, and Suriname to the east. With a land area of 214,969 km2 (83,000 sq mi), Guyana is the third-smallest sovereign state by area in mainland South America after Uruguay and Suriname, and is the second-least populous sovereign state in South America after Suriname; it is also one of the least densely populated countries on Earth. It has a wide variety of natural habitats and very high biodiversity. The country also hosts a part of the Amazon rainforest, the largest tropical rainforest in the world.

<span class="mw-page-title-main">Languages of Guyana</span>

English is the official language of Guyana, which is the only South American country with English as the official language.

<span class="mw-page-title-main">Index of Guyana-related articles</span>

The following is an alphabetical list of topics related to the Co-operative Republic of Guyana.

<span class="mw-page-title-main">Guyanese people</span> South American ethnic group

The people of Guyana, or Guyanese, come from a wide array of backgrounds and cultures including aboriginal natives, African and Indian origins, as well as a minority of Chinese and European descendant peoples. Demographics as of 2012 are Indo-Guyanese 39.8%, Afro-Guyanese 30.1%, mixed race 19.9%, Amerindian 10.5%, other 1.5%. As a result, Guyanese do not equate their nationality with race and ethnicity, but with citizenship. Although citizens make up the majority of Guyanese, there is a substantial number of Guyanese expatriates, dual citizens and descendants living worldwide, chiefly elsewhere in the Anglosphere.

<span class="mw-page-title-main">Surinamese people</span>

Surinamese people are people who identify with the country of Suriname. This connection may be residential, legal, historical or cultural. For most Surinamese, several of these connections exist and are collectively the source of their being Surinamese.

<span class="mw-page-title-main">Women in Guyana</span> Overview of the status of women in Guyana

Women in Guyana are a cross-section of Asian, African, and indigenous backgrounds. British colonization and imperialism have contributed to the sexism against Guyanese women in the household, politics, and education.

<span class="mw-page-title-main">Indigenous peoples in Guyana</span> Earliest inhabitants of Guyana

Indigenous peoples in Guyana, Native Guyanese or Amerindian Guyanese are Guyanese people who are of indigenous ancestry. They comprise approximately 9.16% of Guyana's population. Amerindians are credited with the invention of the canoe, as well as Cassava-based dishes and Guyanese pepperpot, the national dish of Guyana. Amerindian languages have also been incorporated in the lexicon of Guyanese Creole.

<span class="mw-page-title-main">Trinidadians and Tobagonians</span> People identified with the country of Trinidad and Tobago

Trinidadians and Tobagonians, colloquially known as Trinis or Trinbagonians, are the people who are identified with the country of Trinidad and Tobago. The country is home to people of many different national, ethnic and religious origins. As a result, Trinidadians do not equate their nationality with race and ethnicity, but with citizenship, identification with the islands as whole, or either Trinidad or Tobago specifically. Although citizens make up the majority of Trinidadians, there is a substantial number of Trinidadian expatriates, dual citizens and descendants living worldwide, chiefly elsewhere in the Anglosphere.

The Indian community in Saint Kitts and Nevis is made up of Indo-Kittitians, Indo-Nevisians, non-resident Indians and persons of Indian origin. Indo-Kittitians and Indo-Nevisians are nationals of Saint Kitts and Nevis whose ancestry lies within the country of India. The community originated from the Indian indentured workers brought to Saint Kitts and Nevis by the British in 1861 and 1874 respectively. By 1884, most of the community had emigrated to Caribbean nations with larger Indian populations such as Trinidad and Tobago, Guyana and Suriname.

<span class="mw-page-title-main">Hinduism in Suriname</span>

Hinduism in Suriname is the second-largest religion. According to ARDA, there are 129,440 Hindus in Suriname as of 2015, constituting 23.15% of the population. Suriname has the second largest percentage of Hindus in the Western Hemisphere, after Guyana (24.8%).

References

  1. "Final 2012 Census Compendium". Bureau of Statistics - Guyana. Retrieved 27 July 2017.
  2. "World Population Prospects 2022". United Nations Department of Economic and Social Affairs, Population Division. Retrieved 17 July 2022.
  3. "World Population Prospects 2022: Demographic indicators by region, subregion and country, annually for 1950-2100" (XSLX) ("Total Population, as of 1 July (thousands)"). United Nations Department of Economic and Social Affairs, Population Division. Retrieved 17 July 2022.
  4. 1 2 "Population Division of the Department of Economic and Social Affairs of the United Nations Secretariat, World Population Prospects: The 2010 Revision". Esa.un.org. Retrieved 3 October 2017.
  5. "UNSD — Demographic and Social Statistics". unstats.un.org. Retrieved 10 May 2023.
  6. Guyana Census 2002, population composition, Ch. 2 (p. 44)
  7. Total population 751,223, where 15–64 years is 452,609/751,223 ~= 60.2%.
  8. "DEMOGRAPHIC PROFILE: GUYANA" (PDF). Caricomstats.org. Archived from the original (PDF) on 3 March 2016. Retrieved 3 October 2017.
  9. "Guyana - Demographic and Health Survey 2009". microdata.worldbank.org. Retrieved 3 October 2017.
  10. 1 2 3 https://statisticsguyana.gov.gy/wp-content/uploads/2019/11/Final_2012_Census_Compendium2.pdf Archived 5 January 2021 at the Wayback Machine [ bare URL PDF ]
  11. "Guyana turns attention to racism". BBC News. 20 September 2005.
  12. "Conflict between East-Indian and Blacks in Trinidad and Guyana Socially, Economically and Politically". Gabrielle Hookumchand, Professor Moses Seenarine. 18 May 2000.
  13. International Business Times: "Guyana: A Study in Polarized Racial Politics" Archived 15 July 2012 at the Wayback Machine 12 December 2011
  14. "Ethnic Conflict Threatens Democracy in Guyana". 18 March 2024.
  15. Helen Myers (1999). Music of Hindu Trinidad . University of Chicago Press. p.  30. ISBN   9780226554532.
  16. Indian Diaspora (PDF). Archived from the original (PDF) on 30 April 2011. Retrieved 3 October 2017.{{cite book}}: |website= ignored (help)
  17. "South America :: GUYANA". Cia.gov. CIA The World Factbook. Retrieved 3 October 2017.
  18. "Portuguese emigration from Madeira to British Guiana". Guyana.org. Retrieved 3 October 2017.
  19. "2012 Census Compendium 2". Statisticsguyana.gov.gy. Retrieved 3 October 2017.
  20. "United Nations Statistics Division - Demographic and Social Statistics". unstats.un.org. Retrieved 3 October 2017.
  21. Guyana Census 2002, population composition, Ch. 2 (pp. 27–28)
  22. 1 2 3 4 5 Smock, Kirk (2008). Guyana: The Bradt Travel Guide. Bradt. pp.  19. ISBN   978-1-84162-223-1.
  23. 1 2 3 Ali, Arif (2008). Guyana. London: Hansib. ISBN   978-1-906190-10-1.
  24. Damoiseau, Robert (2003) Eléments de grammaire comparée français-créole guyanais Ibis rouge, Guyana, ISBN   2-84450-192-3
  25. Guyana 2012 census compendium 2 . Retrieved 28 August 2019.