Venezuela is a country in South America. The Venezuelan people comprise a combination of heritages, primarily Native American and European. The historically present Native American, Spanish colonists, and African slaves have all contributed to varying degrees. Later, waves of European groups (Italians, Spanish, Portuguese and Germans) migrated to Venezuela in the 20th century, influencing many aspects of Venezuelan life, including its culture, language, food, and music though small in number.
About 51% of the population is mestizo (mixed white and indigenous); Europeans and Arabs (whites) make up 43% of the population, Africans 3.6%, Amerindian people 2%, and other races, mostly Asians, make up 1.2%.[1][2] About 85% of the population live in urban areas in the northern portion of the country and currently resides in the urban conglomerations (Caracas, Maracay, Maracaibo, Valencia, etc.) that are concentrated in Venezuela's northern coastal mountain strip. Nearly half of Venezuela's geographic area lies south of the Orinoco River; however, this region contains only 5% of the Venezuelan population.
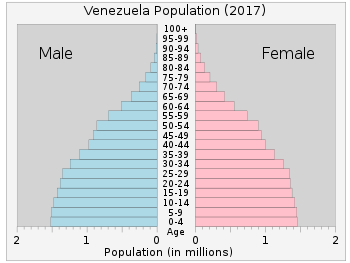
The 2022 revision of the World Population Prospects[3][4] estimate puts Venezuela's total population at 28,199,867 inhabitants.[3][4] Additionally, over the past five years, Venezuelan society's general age structure has been trending towards the homologous structure found in Cuba, Western Europe, Japan, and other healthy and rapidly ageing societies. Notably, there has been a significant increase in the proportion and gross numbers of elderly Venezuelans (aged 65 and up), as well as a corresponding drop in the total fertility. More than 7 million people, that is 20 per cent of the population, have left Venezuela in the last years, mostly as refugees due to the economic and political situation.[5]
Population
Census population
Year
Pop.
±%
1873
1,732,411
—
1881
2,005,139
+15.7%
1891
2,221,572
+10.8%
1920
2,479,525
+11.6%
1926
2,814,131
+13.5%
1936
3,364,347
+19.6%
1941
3,850,771
+14.5%
1950
5,034,838
+30.7%
1961
7,523,999
+49.4%
1971
10,721,522
+42.5%
1981
14,516,735
+35.4%
1990
18,105,265
+24.7%
2001
23,232,553
+28.3%
2011
27,722,793
+19.3%
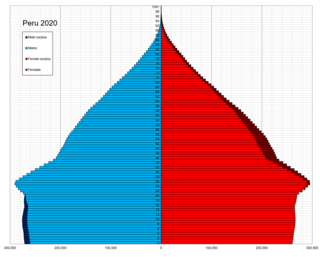
According to the 2022 revision of the World Population Prospects[3][4] the total population was 28,199,867 in 2021, compared to only 5,482,000 in 1950. The proportion of children below the age of 15 in 2010 was 29.5%, 64.9% was between 15 and 65 years of age, while 5.6% was 65 years or older.[6]
Total population
Proportion aged 0–14 (%)
Proportion aged 15–64 (%)
Proportion aged 65+ (%)
1950
5,482,000
43.5
54.6
1.9
1955
6,758,000
44.8
53.1
2.0
1960
8,147,000
45.6
51.9
2.4
1965
9,825,000
46.4
51.0
2.6
1970
11,588,000
45.7
51.5
2.8
1975
13,361,000
43.3
53.6
3.0
1980
15,344,000
40.7
56.2
3.2
1985
17,508,000
38.8
57.8
3.4
1990
19,862,000
37.9
58.4
3.7
1995
22,189,000
36.3
59.8
3.9
2000
24,192,000
34.0
61.5
4.5
2005
26,432,000
31.7
63.3
5.0
2010
28,440,000
29.9
64.5
5.6
2015
30,082,000
28.4
65.3
6.4
2020
28,436,000
27.3
64.8
8.0
Graphs are unavailable due to technical issues. There is more info on Phabricator and on MediaWiki.org.
Graphs are unavailable due to technical issues. There is more info on Phabricator and on MediaWiki.org.
Life expectancy in Venezuela since 1900Life expectancy in Venezuela since 1960 by gender
total population: 76.2 years
male: 73.2 years
female: 79.3 years (2018 est.)
Urbanization:
urban population: 88.2% of total population (2018)
rate of urbanisation: 1.28% annual rate of change (2015–20 est.)
Languages:
Spanish (official), numerous indigenous dialects
Literacy:
definition: age 15 and over can read and write (2016 est.)
total population: 97.1%
male: 97%
female: 97.2% (2016 est.)
School life expectancy (primary to tertiary education):
total: 14 years
Unemployment, youth ages 15–24:
total: 14.6%. Country comparison to the world: 92nd
Sex ratio
Age
Ratio (males/females)
Total:
1.02
At birth:
1.07
Under 15:
1.07
15–64:
1.01
Over 65:
0.83
Race
This article or section is in a state of significant expansion or restructuring. You are welcome to assist in its construction by editing it as well. If this article or section has not been edited in several days, please remove this template. If you are the editor who added this template and you are actively editing, please be sure to replace this template with {{in use}} during the active editing session. Click on the link for template parameters to use. This article was last edited by Rodw(talk | contribs) 18 hours ago. (Updatetimer)
Contributor note: Please be advised that this section is currently under construction. It is in the process of adding citations, sources, and providing additional geographic context based on census results.
According to an autosomal DNA genetic study conducted in 2008 by the University of Brasilia (UNB), the composition of Venezuela's population is: 60.60% of European contribution, 23% of Amerindian contribution and 16.30% of African contribution. According the Statistics National Institute of Venezuela, individuals of mixed race constitute the largest demographic group nationwide, comprising approximately half of the population (50%). Following closely are individuals of white ethnicity, accounting for around 43% of the population and predominantly distributed across various regions of the country. These regions include traditional destinations for European immigrants, such as the Coastal Mountain Range, Andean cordillera, the Caribbean islands, and significant urban centers.
While afro-descendants are dispersed throughout the country, comprising around 3.6% of the population, they tend to be concentrated in areas with historical ties to colonial-era slavery, such as the north-central coast (Barlovento region, Ocumare de la Costa) and the southern region of Lake Maracaibo Lowlands. Over time, some black communities have migrated to larger metropolitan areas during the post-colonial period.
Indigenous populations primarily inhabit the southern half of Venezuela, the region known as Guayana south-along the Orinoco River. Additionally, Indigenous communities can be found in the Guajira Peninsula and the eastern part of the country. Together, Indigenous peoples represent approximately 2% of the total population in Venezuela.[15]
Approximately 50% of Venezuelans identify themselves as mixed-race, indicating mixed ancestry with intermediate features reflecting indigenous, European, and/or African phenotypes (to a lesser extent, this category can include individuals with Arab or Asian ancestry mixed with the aforementioned groups). The intermingling of races in Venezuela commenced in the 16th century when Spanish conquerors and settlers intermarried with indigenous women, owing to the absence of European women in the region. Subsequently, with the introduction of enslaved Africans, a process of racial fusion emerged among the indigenous, European, and African populations. This process persisted over the decades as additional waves of migration from Europe, the Middle East, North America, Latin America, and Asia contributed to Venezuela's diverse genetic landscape. Diverses genetic studies indicate that the mestizo Venezuelan population predominantly possesses a European genetic component (54 - 71.9%), followed by Amerindian (18.6 - 32%), and to a lesser extent, African (9.5 - 16.3%) ancestry, with notable regional variations.[16][17][18]
Mestizos are distributed throughout most of the country, with significant concentrations primarily along the northern strip of the Orinoco River (the northern half of the country). Noteworthy towns in the Los Llanos region, such as El Pao (Cojedes), San Antonio (Barinas), Trinidad de La Capilla - Guanarito (Portuguesa), La Union (Barinas), Florida (Portuguesa), and Libertad de Orituco (Guárico), boast a majority of residents belonging to this ethnic group, with over 75% mestizo population. States with the highest proportion of mestizos include Apure, Cojedes, Guárico, and Portuguesa, all part of the Los Llanos region in the central-western interior, with slightly over 60% of their population identifying as mestizo. Conversely, areas with minimal mestizo presence are observed in jungle regions of the Upper Orinoco in Amazonas, as well as portions of the Orinoco Delta and Alta Guajira (Zulia), where they represent less than 1% of the total population. States with the lowest percentage of mestizo population include Amazonas (less than 10%) and Delta Amacuro (less than 35%), both situated in the Guayana region of southern Venezuela, characterized by low population density historically dominated by Native American Indians.[15]
The majority of White Venezuelans trace their ancestry to European Mediterranean origins, primarily Spanish, followed by Italian and Portuguese contributions. European colonization of Venezuela commenced with the arrival of the Spanish in the late 15th century, with settlers predominantly hailing from regions such as Andalusia, Galicia, the Basque Country, and the Canary Islands. The influence of the Canary Islands on Venezuelan culture and customs has been particularly significant, earning Venezuela the occasional nickname "the eighth island of the Canary archipelago".[20]
During the emergence of the independence movements in the Americas, Venezuela experienced a notable influx of White Dominicans.[23] This surge in migration was largely prompted by a genocide perpetrated by Afro-descendant Haitians following the capture of Hispaniola. As Venezuela pursued independence, it witnessed a significant arrival of Italian immigrants seeking better opportunities, with migration beginning in 1814 and intensifying around 1870 during Italy's unification. These Italian immigrants primarily concentrated in agricultural regions, particularly focusing on coffee and cocoa cultivation in the Andean and the Coastal Range area of the country.[24] Concurrently, volunteers from England, Scotland, and Ireland formed the "British Legion", actively engaging in the War of Independence, leaving a lasting impact and contributing to the enduring presence of British descendants in Venezuela.[25]
Following independence, Venezuela faced challenges attracting immigrants due to economic stagnation and internal conflicts. Despite this, small groups of French settlers,[25] particularly Corsicans, established themselves along the coast of the Paria Peninsula, contributing significantly to the cocoa industry.[26] Additionally, Italians were notably present in the Andean region,[27][28] while German immigrants formed communities such as Colonia Tovar in the center-north, they also played vital roles in commerce, particularly in Maracaibo's retail sector and informal banking systems.[29] Towards the late 19th century, White Americans and White Canadians relocated to Venezuela,[30] primarily as evangelical missionaries representing various Protestant denominations,[31] along with engineers drawn by the burgeoning oil industry.[32]
During the 1970s and 1980s, Southern Cone nations like Argentina and Uruguay with a predominantly Spanish and Italian-descents population, were plagued by oppressive dictatorships. Consequently, many individuals from these countries sought refuge in Venezuela, attracted by the promise of safety and stability.[37] Additionally, Venezuela became a destination for other European Latin Americans communities, including Colombians, Chileans, Dominicans, Brazilians, Cubans, and others, fleeing economic struggles, political unrest, and autocratic regimes in their homelands.[25]
According to the 2011 census, 88.3 per cent of the population is Christian, primarily Roman Catholic (71%), 17 per cent Protestant, and the remaining 0.03 per cent Mormons (LDS Church).[41] The Venezuelans without religion are 9% (atheist 2%, agnostic or indifferent 6% and doesn't know/doesn't respond 1% ), almost 3% of the population follow other religions (1% of them are of Santería).[39][40]
↑ La Comunidad Europea en Venezuela. Servicio de Prensa e Información, Delegación para América Latina de la Comisión de las Comunidades Europeas. 1985. p.117.
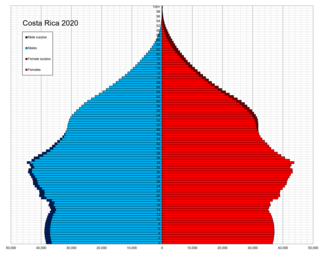
This is a demographic article about Costa Rica's population, including population density, ethnicity, education level, health of the populace, economic status, religious affiliations, and other aspects of the population.
This is a demography of the population of the Dominican Republic including population density, ethnicity, education level, health of the populace, economic status, religious affiliations and other aspects of the population.
Demographic features of the population of Ecuador include population density, ethnicity, education level, health of the populace, economic status, religious affiliations and other aspects of the population.
This is a demography of the population of El Salvador including population density, ethnicity, education level, health of the populace, economic status, religious affiliations and other aspects of the population.
This is a demography of the population of Guatemala including population density, ethnicity, education level, health of the populace, economic status, religious affiliations and other aspects of the population.
This article is about the ethnic groups and population of Honduras.
With a population of about 129 million in 2022, Mexico is the 10th most populated country in the world. It is the largest Spanish-speaking country in the world and the third-most populous country in the Americas after the United States and Brazil. Throughout most of the 20th century Mexico's population was characterized by rapid growth. Although this tendency has been reversed and average annual population growth over the last five years was less than 1%, the demographic transition is still in progress; Mexico still has a large youth cohort. The most populous city in the country is the capital, Mexico City, with a population of 8.9 million (2016), and its metropolitan area is also the most populated with 20.1 million (2010). Approximately 50% of the population lives in one of the 55 large metropolitan areas in the country. In total, about 78.84% of the population of the country lives in urban areas, and only about 21.16% in rural ones.
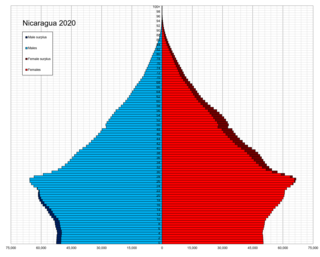
According to the 2022 revision of the World Population Prospects, Nicaragua has a population of 6,850,540. Whites and Mestizos and tribally unaffiliated Native Americans combined make up about 56% of the population. The remainder of the Nicaraguan population is 9% English-speaking Afro-Nicaraguans, and 33% Tribal Native American.
This is a demography of the population of Panama including population density, ethnicity, education level, health of the populace, economic status, religious affiliations, and other aspects of the population. Panama's 2020 census has been postponed due to the COVID-19 pandemic but the government are currently assessing additional implications. They are evaluating the preparatory processes that can begin now, such as procurement.
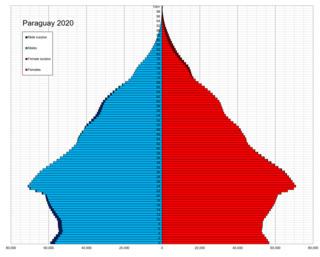
Demographic features of the population of Paraguay include population density, ethnicity, education level, health of the populace, economic status, religious affiliations and other aspects of the population.
This is a demography of the population of Peru including population density, ethnicity, education level, the health of the populace, economic status, religious affiliations and other aspects of the population.
This is a demography of the population of Uruguay including population density, ethnicity, education level, health of the populace, economic status, religious affiliations and other aspects of the population.
Venezuela, officially the Bolivarian Republic of Venezuela, is a country on the northern coast of South America, consisting of a continental landmass and many islands and islets in the Caribbean Sea. Venezuela comprises an area of 916,445 km2 (353,841 sq mi), and its population was estimated at 29 million in 2022. The capital and largest urban agglomeration is the city of Caracas.
Chile's 2017 census reported a population of 17,574,003 people. Its rate of population growth has been decreasing since 1990, due to a declining birth rate. By 2050 the population is expected to reach approximately 20.2 million people, at which point it is projected to either stagnate or begin declining. About 85% of the country's population lives in urban areas, with 40% living in Greater Santiago alone. The largest agglomerations according to the 2002 census are Greater Santiago with 5.6 million people, Greater Concepción with 861,000 and Greater Valparaíso with 824,000.
This is a demography of Argentina including population density, ethnicity, economic status and other aspects of the population.
The demographic characteristics of the population of Bolivia are known from censuses, with the first census undertaken in 1826 and the most recent in 2012. The National Institute of Statistics of Bolivia (INE) has performed this task since 1950. The population of Bolivia in 2012 reached 10 million for the first time in history. The population density is 9.13 inhabitants per square kilometer, and the overall life expectancy in Bolivia at birth is 68.2 years. The population has steadily risen from the late 1800s to the present time. The natural growth rate of the population is positive, which has been a continuing trend since the 1950s; in 2012, Bolivia's birth rate continued to be higher than the death rate. Bolivia is in the third stage of demographic transition. In terms of age structure, the population is dominated by the 15–64 segment. The median age of the population is 23.1, and the gender ratio of the total population is 0.99 males per female.
The demographic characteristics of Cuba are known through census which have been conducted and analyzed by different bureaus since 1774. The National Office of Statistics of Cuba (ONE) since 1953. The most recent census was conducted in September 2012. The population of Cuba at the 2012 census was nearly 11.2 million. The population density is 101 inhabitants per square kilometer, and the overall life expectancy in Cuba is 78.0 years. The population has always increased from one census to the next in the 20th century, with the exception of the 2012 census, when the count decreased by 10,000. Since 1740, Cuba's birth rate has surpassed its death rate; the natural growth rate of the country is positive. Cuba is in the fourth stage of demographic transition. In terms of age structure, the population is dominated (71.1%) by the 15- to 64-year-old segment. The median age of the population is 39.5, making it the oldest in the Americas, and the gender ratio of the total population is 0.99 males per female.
Venezuelans are the citizens identified with the country of Venezuela. This connection may be through citizenship, descent or cultural. For most Venezuelans, many or all of these connections exist and are the source of their Venezuelan citizenship or their bond to Venezuela.
European Venezuelans or White Venezuelans are Venezuelan citizens who self-identify in the national census as white, tracing their heritage to European ethnic groups. According to the official census report, although "white" literally involves external issues such as light skin, shape and color of hair and eyes, among others, the term "white" has been used in different ways in different historical periods and places, and so its precise definition is somewhat confusing.
The demographics of Colombia consist of statistics regarding Colombians' health, economic status, religious affiliations, ethnicity, population density, and other aspects of the population. Colombia is the second-most populous country in South America after Brazil, and the third-most populous in Latin America, after Brazil and Mexico.
This page is based on this Wikipedia article Text is available under the CC BY-SA 4.0 license; additional terms may apply. Images, videos and audio are available under their respective licenses.