Distance matrices in phylogeny

Last updated

Distance matrices are used in phylogeny as non-parametric distance methods and were originally applied to phenetic data using a matrix of pairwise distances. These distances are then reconciled to produce a tree (a phylogram, with informative branch lengths). The distance matrix can come from a number of different sources, including measured distance (for example from immunological studies) or morphometric analysis, various pairwise distance formulae (such as euclidean distance) applied to discrete morphological characters, or genetic distance from sequence, restriction fragment, or allozyme data. For phylogenetic character data, raw distance values can be calculated by simply counting the number of pairwise differences in character states (Hamming distance).

Contents

Distance-matrix methods

Distance-matrix methods of phylogenetic analysis explicitly rely on a measure of "genetic distance" between the sequences being classified, and therefore they start with a multiple sequence alignment (MSA) as an input. From it, they construct an all-to-all matrix describing the distance between each sequence pair. Finally, they construct a phylogenetic tree that places closely related sequences under the same interior node and whose branch lengths closely reproduce the observed distances between sequences. The produced tree is either rooted or unrooted, depending on the algorithm used.

Distance is often defined as the fraction of mismatches at aligned positions, with gaps either ignored or counted as mismatches. [1]

Distance-matrix methods are frequently used as the basis for progressive and iterative types of multiple sequence alignment.

The main disadvantage of distance-matrix methods is their inability to efficiently use information about local high-variation regions that appear across multiple subtrees. [2]

Neighbor-joining

Neighbor-joining methods apply general data clustering techniques to sequence analysis using genetic distance as a clustering metric. The simple neighbor-joining method produces unrooted trees, but it does not assume a constant rate of evolution (i.e., a molecular clock) across lineages.

UPGMA and WPGMA

The UPGMA (Unweighted Pair Group Method with Arithmetic mean) and WPGMA (Weighted Pair Group Method with Arithmetic mean) methods produce rooted trees and require a constant-rate assumption – that is, it assumes an ultrametric tree in which the distances from the root to every branch tip are equal.

Fitch–Margoliash method

The Fitch–Margoliash method uses a weighted least squares method for clustering based on genetic distance. [3] Closely related sequences are given more weight in the tree construction process to correct for the increased inaccuracy in measuring distances between distantly related sequences. In practice, the distance correction is only necessary when the evolution rates differ among branches. [2] The distances used as input to the algorithm must be normalized to prevent large artifacts in computing relationships between closely related and distantly related groups. The distances calculated by this method must be linear; the linearity criterion for distances requires that the expected values of the branch lengths for two individual branches must equal the expected value of the sum of the two branch distances – a property that applies to biological sequences only when they have been corrected for the possibility of back mutations at individual sites. This correction is done through the use of a substitution matrix such as that derived from the Jukes–Cantor model of DNA evolution.

The least-squares criterion applied to these distances is more accurate but less efficient than the neighbor-joining methods. An additional improvement that corrects for correlations between distances that arise from many closely related sequences in the data set can also be applied at increased computational cost. Finding the optimal least-squares tree with any correction factor is NP-complete, [4] so heuristic search methods like those used in maximum-parsimony analysis are applied to the search through tree space.

Using outgroups

Independent information about the relationship between sequences or groups can be used to help reduce the tree search space and root unrooted trees. Standard usage of distance-matrix methods involves the inclusion of at least one outgroup sequence known to be only distantly related to the sequences of interest in the query set. [1] This usage can be seen as a type of experimental control. If the outgroup has been appropriately chosen, it will have a much greater genetic distance and thus a longer branch length than any other sequence, and it will appear near the root of a rooted tree. Choosing an appropriate outgroup requires the selection of a sequence that is moderately related to the sequences of interest; too close a relationship defeats the purpose of the outgroup and too distant adds noise to the analysis. [1] Care should also be taken to avoid situations in which the species from which the sequences were taken are distantly related, but the gene encoded by the sequences is highly conserved across lineages. Horizontal gene transfer, especially between otherwise divergent bacteria, can also confound outgroup usage.

Weaknesses of different methods

In general, pairwise distance data are an underestimate of the path-distance between taxa on a phylogram. Pairwise distances effectively "cut corners" in a manner analogous to geographic distance: the distance between two cities may be 100 miles "as the crow flies," but a traveler may actually be obligated to travel 120 miles because of the layout of roads, the terrain, stops along the way, etc. Between pairs of taxa, some character changes that took place in ancestral lineages will be undetectable, because later changes have erased the evidence (often called multiple hits and back mutations in sequence data). This problem is common to all phylogenetic estimation, but it is particularly acute for distance methods, because only two samples are used for each distance calculation; other methods benefit from evidence of these hidden changes found in other taxa not considered in pairwise comparisons. For nucleotide and amino acid sequence data, the same stochastic models of nucleotide change used in maximum likelihood analysis can be employed to "correct" distances, rendering the analysis "semi-parametric."

Several simple algorithms exist to construct a tree directly from pairwise distances, including UPGMA and neighbor joining (NJ), but these will not necessarily produce the best tree for the data. To counter potential complications noted above, and to find the best tree for the data, distance analysis can also incorporate a tree-search protocol that seeks to satisfy an explicit optimality criterion. Two optimality criteria are commonly applied to distance data, minimum evolution (ME) and least squares inference. Least squares is part of a broader class of regression-based methods lumped together here for simplicity. These regression formulae minimize the residual differences between path-distances along the tree and pairwise distances in the data matrix, effectively "fitting" the tree to the empirical distances. In contrast, ME accepts the tree with the shortest sum of branch lengths, and thus minimizes the total amount of evolution assumed. ME is closely akin to parsimony, and under certain conditions, ME analysis of distances based on a discrete character dataset will favor the same tree as conventional parsimony analysis of the same data.

Phylogeny estimation using distance methods has produced a number of controversies. UPGMA assumes an ultrametric tree (a tree where all the path-lengths from the root to the tips are equal). If the rate of evolution were equal in all sampled lineages (a molecular clock), and if the tree were completely balanced (equal numbers of taxa on both sides of any split, to counter the node density effect), UPGMA should not produce a biased result. These expectations are not met by most datasets, and although UPGMA is somewhat robust to their violation, it is not commonly used for phylogeny estimation. The advantage of UPGMA is that it is fast and can handle many sequences.

Neighbor-joining is a form of star decomposition and, as a heuristic method, is generally the least computationally intensive of these methods. It is very often used on its own, and in fact quite frequently produces reasonable trees. However, it lacks any sort of tree search and optimality criterion, and so there is no guarantee that the recovered tree is the one that best fits the data. A more appropriate analytical procedure would be to use NJ to produce a starting tree, then employ a tree search using an optimality criterion, to ensure that the best tree is recovered.

Many scientists eschew distance methods, for various reasons. A commonly cited reason is that distances are inherently phenetic rather than phylogenetic, in that they do not distinguish between ancestral similarity (symplesiomorphy) and derived similarity (synapomorphy). This criticism is not entirely fair: most currently implementations of parsimony, likelihood, and Bayesian phylogenetic inference use time-reversible character models, and thus accord no special status to derived or ancestral character states. Under these models, the tree is estimated unrooted; rooting, and consequently determination of polarity, is performed after the analysis. The primary difference between these methods and distances is that parsimony, likelihood, and Bayesian methods fit individual characters to the tree, whereas distance methods fit all the characters at once. There is nothing inherently less phylogenetic about this approach.[ citation needed ]

More practically, distance methods are avoided because the relationship between individual characters and the tree is lost in the process of reducing characters to distances. These methods do not use character data directly, and information locked in the distribution of character states can be lost in the pairwise comparisons. Also, some complex phylogenetic relationships may produce biased distances. On any phylogram, branch lengths will be underestimated because some changes cannot be discovered at all due to failure to sample some species due to either experimental design or extinction (a phenomenon called the node density effect). However, even if pairwise distances from genetic data are "corrected" using stochastic models of evolution as mentioned above, they may more easily sum to a different tree than one produced from analysis of the same data and model using maximum likelihood. This is because pairwise distances are not independent; each branch on a tree is represented in the distance measurements of all taxa it separates. Error resulting from any characteristic of that branch that might confound phylogeny (stochastic variability, change in evolutionary parameters, an abnormally long or short branch length) will be propagated through all of the relevant distance measurements. The resulting distance matrix may then better fit an alternate (presumably less optimal) tree.

Despite these potential problems, distance methods are extremely fast, and they often produce a reasonable estimate of phylogeny. They also have certain benefits over the methods that use characters directly. Notably, distance methods allow use of data that may not be easily converted to character data, such as DNA-DNA hybridization assays. They also permit analyses that account for the possibility that the rate at which particular nucleotides are incorporated into sequences may vary over the tree, using LogDet distances. For some network-estimation methods (notably NeighborNet), the abstraction of information about individual characters in distance data are an advantage. When considered character-by character, conflict between character and a tree due to reticulation cannot be told from conflict due either to homoplasy or error. However, pronounced conflict in distance data, which represents an amalgamation of many characters, is less likely due to error or homoplasy unless the data are strongly biased, and is thus more likely to be a result of reticulation.

Distance methods are popular among molecular systematists, a substantial number of whom use NJ without an optimization stage almost exclusively. With the increasing speed of character-based analyses, some of the advantages of distance methods will probably wane. However, the nearly instantaneous NJ implementations, the ability to incorporate an evolutionary model in a speedy analysis, LogDet distances, network estimation methods, and the occasional need to summarize relationships with a single number all mean that distance methods will probably stay in the mainstream for a long time to come.

See also

Related Research Articles

In biology, phylogenetics is the study of the evolutionary history and relationships among or within groups of organisms. These relationships are determined by phylogenetic inference methods that focus on observed heritable traits, such as DNA sequences, protein amino acid sequences, or morphology. The result of such an analysis is a phylogenetic tree—a diagram containing a hypothesis of relationships that reflects the evolutionary history of a group of organisms.

<span class="mw-page-title-main">Cladogram</span> Diagram used to show relations among groups of organisms with common origins

A cladogram is a diagram used in cladistics to show relations among organisms. A cladogram is not, however, an evolutionary tree because it does not show how ancestors are related to descendants, nor does it show how much they have changed, so many differing evolutionary trees can be consistent with the same cladogram. A cladogram uses lines that branch off in different directions ending at a clade, a group of organisms with a last common ancestor. There are many shapes of cladograms but they all have lines that branch off from other lines. The lines can be traced back to where they branch off. These branching off points represent a hypothetical ancestor which can be inferred to exhibit the traits shared among the terminal taxa above it. This hypothetical ancestor might then provide clues about the order of evolution of various features, adaptation, and other evolutionary narratives about ancestors. Although traditionally such cladograms were generated largely on the basis of morphological characters, DNA and RNA sequencing data and computational phylogenetics are now very commonly used in the generation of cladograms, either on their own or in combination with morphology.

<span class="mw-page-title-main">Phylogenetic tree</span> Branching diagram of evolutionary relationships between organisms

A phylogenetic tree, phylogeny or evolutionary tree is a graphical representation which shows the evolutionary history between a set of species or taxa during a specific time. In other words, it is a branching diagram or a tree showing the evolutionary relationships among various biological species or other entities based upon similarities and differences in their physical or genetic characteristics. In evolutionary biology, all life on Earth is theoretically part of a single phylogenetic tree, indicating common ancestry. Phylogenetics is the study of phylogenetic trees. The main challenge is to find a phylogenetic tree representing optimal evolutionary ancestry between a set of species or taxa. Computational phylogenetics focuses on the algorithms involved in finding optimal phylogenetic tree in the phylogenetic landscape.

Molecular phylogenetics is the branch of phylogeny that analyzes genetic, hereditary molecular differences, predominantly in DNA sequences, to gain information on an organism's evolutionary relationships. From these analyses, it is possible to determine the processes by which diversity among species has been achieved. The result of a molecular phylogenetic analysis is expressed in a phylogenetic tree. Molecular phylogenetics is one aspect of molecular systematics, a broader term that also includes the use of molecular data in taxonomy and biogeography.

In bioinformatics, neighbor joining is a bottom-up (agglomerative) clustering method for the creation of phylogenetic trees, created by Naruya Saitou and Masatoshi Nei in 1987. Usually based on DNA or protein sequence data, the algorithm requires knowledge of the distance between each pair of taxa to create the phylogenetic tree.

UPGMA is a simple agglomerative (bottom-up) hierarchical clustering method. It also has a weighted variant, WPGMA, and they are generally attributed to Sokal and Michener.

In mathematics, computer science and especially graph theory, a distance matrix is a square matrix containing the distances, taken pairwise, between the elements of a set. Depending upon the application involved, the distance being used to define this matrix may or may not be a metric. If there are N elements, this matrix will have size N×N. In graph-theoretic applications, the elements are more often referred to as points, nodes or vertices.

<span class="mw-page-title-main">Outgroup (cladistics)</span>

In cladistics or phylogenetics, an outgroup is a more distantly related group of organisms that serves as a reference group when determining the evolutionary relationships of the ingroup, the set of organisms under study, and is distinct from sociological outgroups. The outgroup is used as a point of comparison for the ingroup and specifically allows for the phylogeny to be rooted. Because the polarity (direction) of character change can be determined only on a rooted phylogeny, the choice of outgroup is essential for understanding the evolution of traits along a phylogeny.

In phylogenetics and computational phylogenetics, maximum parsimony is an optimality criterion under which the phylogenetic tree that minimizes the total number of character-state changes. Under the maximum-parsimony criterion, the optimal tree will minimize the amount of homoplasy. In other words, under this criterion, the shortest possible tree that explains the data is considered best. Some of the basic ideas behind maximum parsimony were presented by James S. Farris in 1970 and Walter M. Fitch in 1971.

<span class="mw-page-title-main">Substitution model</span> Description of the process by which states in sequences change into each other and back

In biology, a substitution model, also called models of DNA sequence evolution, are Markov models that describe changes over evolutionary time. These models describe evolutionary changes in macromolecules represented as sequence of symbols. Substitution models are used to calculate the likelihood of phylogenetic trees using multiple sequence alignment data. Thus, substitution models are central to maximum likelihood estimation of phylogeny as well as Bayesian inference in phylogeny. Estimates of evolutionary distances are typically calculated using substitution models. Substitution models are also central to phylogenetic invariants because they are necessary to predict site pattern frequencies given a tree topology. Substitution models are also necessary to simulate sequence data for a group of organisms related by a specific tree.

<span class="mw-page-title-main">Clustal</span>

Clustal is a series of computer programs used in bioinformatics for multiple sequence alignment. There have been many versions of Clustal over the development of the algorithm that are listed below. The analysis of each tool and its algorithm is also detailed in their respective categories. Available operating systems listed in the sidebar are a combination of the software availability and may not be supported for every current version of the Clustal tools. Clustal Omega has the widest variety of operating systems out of all the Clustal tools.

In phylogenetics, long branch attraction (LBA) is a form of systematic error whereby distantly related lineages are incorrectly inferred to be closely related. LBA arises when the amount of molecular or morphological change accumulated within a lineage is sufficient to cause that lineage to appear similar to another long-branched lineage, solely because they have both undergone a large amount of change, rather than because they are related by descent. Such bias is more common when the overall divergence of some taxa results in long branches within a phylogeny. Long branches are often attracted to the base of a phylogenetic tree, because the lineage included to represent an outgroup is often also long-branched. The frequency of true LBA is unclear and often debated, and some authors view it as untestable and therefore irrelevant to empirical phylogenetic inference. Although often viewed as a failing of parsimony-based methodology, LBA could in principle result from a variety of scenarios and be inferred under multiple analytical paradigms.

Computational phylogenetics, phylogeny inference, or phylogenetic inference focuses on computational and optimization algorithms, heuristics, and approaches involved in phylogenetic analyses. The goal is to find a phylogenetic tree representing optimal evolutionary ancestry between a set of genes, species, or taxa. Maximum likelihood, parsimony, Bayesian, and minimum evolution are typical optimality criteria used to assess how well a phylogenetic tree topology describes the sequence data. Nearest Neighbour Interchange (NNI), Subtree Prune and Regraft (SPR), and Tree Bisection and Reconnection (TBR), known as tree rearrangements, are deterministic algorithms to search for optimal or the best phylogenetic tree. The space and the landscape of searching for the optimal phylogenetic tree is known as phylogeny search space.

<span class="mw-page-title-main">Multiple sequence alignment</span> Alignment of more than two molecular sequences

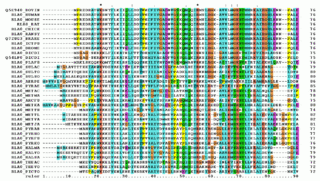
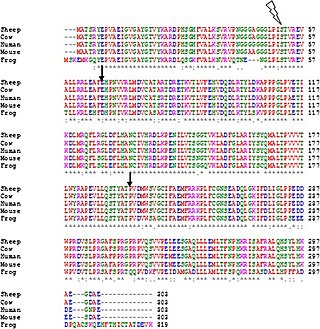
Multiple sequence alignment (MSA) may refer to the process or the result of sequence alignment of three or more biological sequences, generally protein, DNA, or RNA. In many cases, the input set of query sequences are assumed to have an evolutionary relationship by which they share a linkage and are descended from a common ancestor. From the resulting MSA, sequence homology can be inferred and phylogenetic analysis can be conducted to assess the sequences' shared evolutionary origins. Visual depictions of the alignment as in the image at right illustrate mutation events such as point mutations that appear as differing characters in a single alignment column, and insertion or deletion mutations that appear as hyphens in one or more of the sequences in the alignment. Multiple sequence alignment is often used to assess sequence conservation of protein domains, tertiary and secondary structures, and even individual amino acids or nucleotides.

Ancestral reconstruction is the extrapolation back in time from measured characteristics of individuals, populations, or specie to their common ancestors. It is an important application of phylogenetics, the reconstruction and study of the evolutionary relationships among individuals, populations or species to their ancestors. In the context of evolutionary biology, ancestral reconstruction can be used to recover different kinds of ancestral character states of organisms that lived millions of years ago. These states include the genetic sequence, the amino acid sequence of a protein, the composition of a genome, a measurable characteristic of an organism (phenotype), and the geographic range of an ancestral population or species. This is desirable because it allows us to examine parts of phylogenetic trees corresponding to the distant past, clarifying the evolutionary history of the species in the tree. Since modern genetic sequences are essentially a variation of ancient ones, access to ancient sequences may identify other variations and organisms which could have arisen from those sequences. In addition to genetic sequences, one might attempt to track the changing of one character trait to another, such as fins turning to legs.

Tree rearrangements are deterministic algorithms devoted to search for optimal phylogenetic tree structure. They can be applied to any set of data that are naturally arranged into a tree, but have most applications in computational phylogenetics, especially in maximum parsimony and maximum likelihood searches of phylogenetic trees, which seek to identify one among many possible trees that best explains the evolutionary history of a particular gene or species.

Least squares inference in phylogeny generates a phylogenetic tree based on an observed matrix of pairwise genetic distances and optionally a weight matrix. The goal is to find a tree which satisfies the distance constraints as best as possible.

Quantitative comparative linguistics is the use of quantitative analysis as applied to comparative linguistics. Examples include the statistical fields of lexicostatistics and glottochronology, and the borrowing of phylogenetics from biology.

T-REX is a freely available web server, developed at the department of Computer Science of the Université du Québec à Montréal, dedicated to the inference, validation and visualization of phylogenetic trees and phylogenetic networks. The T-REX web server allows the users to perform several popular methods of phylogenetic analysis as well as some new phylogenetic applications for inferring, drawing and validating phylogenetic trees and networks.

Minimum evolution is a distance method employed in phylogenetics modeling. It shares with maximum parsimony the aspect of searching for the phylogeny that has the shortest total sum of branch lengths.

References

  1. 1 2 3 Mount DM. (2004). Bioinformatics: Sequence and Genome Analysis 2nd ed. Cold Spring Harbor Laboratory Press: Cold Spring Harbor, NY.
  2. 1 2 Felsenstein J. (2004). Inferring Phylogenies Sinauer Associates: Sunderland, MA.
  3. Fitch WM; Margoliash E (1967). "Construction of phylogenetic trees". Science. 155 (3760): 279–284. Bibcode:1967Sci...155..279F. doi:10.1126/science.155.3760.279. PMID   5334057.
  4. Day, WHE (1986). "Computational complexity of inferring phylogenies from dissimilarity matrices". Bulletin of Mathematical Biology. 49 (4): 461–7. doi:10.1016/s0092-8240(87)80007-1. PMID   3664032.