Related Research Articles

In statistics, the Kolmogorov–Smirnov test is a nonparametric test of the equality of continuous, one-dimensional probability distributions that can be used to compare a sample with a reference probability distribution, or to compare two samples. It is named after Andrey Kolmogorov and Nikolai Smirnov.
Nonparametric statistics is the branch of statistics that is not based solely on parametrized families of probability distributions. Nonparametric statistics is based on either being distribution-free or having a specified distribution but with the distribution's parameters unspecified. Nonparametric statistics includes both descriptive statistics and statistical inference. Nonparametric tests are often used when the assumptions of parametric tests are violated.
In statistics, Mood's median test is a special case of Pearson's chi-squared test. It is a nonparametric test that tests the null hypothesis that the medians of the populations from which two or more samples are drawn are identical. The data in each sample are assigned to two groups, one consisting of data whose values are higher than the median value in the two groups combined, and the other consisting of data whose values are at the median or below. A Pearson's chi-squared test is then used to determine whether the observed frequencies in each sample differ from expected frequencies derived from a distribution combining the two groups.

A time series is a series of data points indexed in time order. Most commonly, a time series is a sequence taken at successive equally spaced points in time. Thus it is a sequence of discrete-time data. Time Series analysis can be useful to see how a given asset, security or economic variable changes over time. Examples of time series are heights of ocean tides, counts of sunspots, and the daily closing value of the Dow Jones Industrial Average.
In statistics, the Mann–Whitney U test is a nonparametric test of the null hypothesis that, for randomly selected values X and Y from two populations, the probability of X being greater than Y is equal to the probability of Y being greater than X.

Walter Andrew Shewhart was an American physicist, engineer and statistician, sometimes known as the father of statistical quality control and also related to the Shewhart cycle.

Control charts, also known as Shewhart charts or process-behavior charts, are a statistical process control tool used to determine if a manufacturing or business process is in a state of control. It is more appropriate to say that the control charts are the graphical device for Statistical Process Monitoring (SPM). Traditional control charts are mostly designed to monitor process parameters when underlying form of the process distributions are known. However, more advanced techniques are available in the 21st century where incoming data streaming can-be monitored even without any knowledge of the underlying process distributions. Distribution-free control charts are becoming increasingly popular.
Statistical process control (SPC) is a methodquality control which employs statistical methods to monitor and control a process. This helps to ensure that the process operates efficiently, producing more specification-conforming products with less waste. SPC can be applied to any process where the "conforming product" output can be measured. Key tools used in SPC include run charts, control charts, a focus on continuous improvement, and the design of experiments. An example of a process where SPC is applied is manufacturing lines.

Mathematical statistics is the application of probability theory, a branch of mathematics, to statistics, as opposed to techniques for collecting statistical data. Specific mathematical techniques which are used for this include mathematical analysis, linear algebra, stochastic analysis, differential equations, and measure theory.

In statistical process monitoring (SPM), the and R chart is a type of scheme, popularly known as control chart, used to monitor the mean and range of a normally distributed variables simultaneously, when samples are collected at regular intervals from a business or industrial process.. It is often used to monitor the variables data but the performance of the and R chart may suffer when the normality assumption is not valid. This is connected to traditional statistical quality control (SQC) and statistical process control (SPC). However, Woodall noted that "I believe that the use of control charts and other monitoring methods should be referred to as “statistical process monitoring,” not “statistical process control (SPC).”"

In statistics, a Q–Q (quantile-quantile) plot is a probability plot, which is a graphical method for comparing two probability distributions by plotting their quantiles against each other. First, the set of intervals for the quantiles is chosen. A point (x, y) on the plot corresponds to one of the quantiles of the second distribution plotted against the same quantile of the first distribution. Thus the line is a parametric curve with the parameter which is the number of the interval for the quantile.

A run chart, also known as a run-sequence plot is a graph that displays observed data in a time sequence. Often, the data displayed represent some aspect of the output or performance of a manufacturing or other business process. It is therefore a form of line chart.
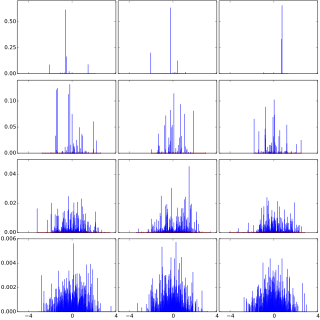
In probability theory, Dirichlet processes are a family of stochastic processes whose realizations are probability distributions. In other words, a Dirichlet process is a probability distribution whose range is itself a set of probability distributions. It is often used in Bayesian inference to describe the prior knowledge about the distribution of random variables—how likely it is that the random variables are distributed according to one or another particular distribution.
In statistics, the Hodges–Lehmann estimator is a robust and nonparametric estimator of a population's location parameter. For populations that are symmetric about one median, such as the (Gaussian) normal distribution or the Student t-distribution, the Hodges–Lehmann estimator is a consistent and median-unbiased estimate of the population median. For non-symmetric populations, the Hodges–Lehmann estimator estimates the "pseudo–median", which is closely related to the population median.
In statistics, the Siegel–Tukey test, named after Sidney Siegel and John Tukey, is a non-parametric test which may be applied to data measured at least on an ordinal scale. It tests for differences in scale between two groups.
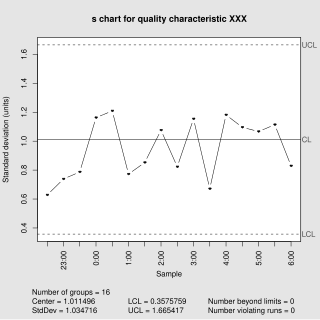
In statistical quality control, the and s chart is a type of control chart used to monitor variables data when samples are collected at regular intervals from a business or industrial process. This is connected to traditional statistical quality control (SQC) and statistical process control (SPC). However, Woodall noted that "I believe that the use of control charts and other monitoring methods should be referred to as “statistical process monitoring,” not “statistical process control (SPC).”"

In statistical quality control, the EWMA chart is a type of control chart used to monitor either variables or attributes-type data using the monitored business or industrial process's entire history of output. While other control charts treat rational subgroups of samples individually, the EWMA chart tracks the exponentially-weighted moving average of all prior sample means. EWMA weights samples in geometrically decreasing order so that the most recent samples are weighted most highly while the most distant samples contribute very little.
In statistics, the Cucconi test is a nonparametric test for jointly comparing central tendency and variability in two samples. Many rank tests have been proposed for the two-sample location-scale problem. Nearly all of them are Lepage-type tests, that is a combination of a location test and a scale test. The Cucconi test was first proposed by Odoardo Cucconi in 1968.
In statistics, the Lepage test is an exactly distribution-free test for jointly monitoring the location and scale (variability) in two-sample treatment versus control comparisons. This is one of the most famous rank tests for the two-sample location-scale problem. The Lepage test statistic is the squared Euclidean distance of standardized Wilcoxon rank-sum test for location and the standardized Ansari–Bradley test for scale. The Lepage test was first introduced by Yves Lepage in 1971 in a paper in Biometrika. A large number of Lepage-type tests exists in statistical literature for simultaneously testing location and scale shifts in case-control studies. The details may be found in the book: Nonparametric statistical tests: A computational approach. Kössler, W. in 2006 also introduced various Lepage type tests using some alternative score functions optimal for various distributions. Dr. Amitava Mukherjee and Dr. Marco Marozzi introduced a class of percentile modified version of the Lepage test. An alternative to the Lepage-type tests is known as the Cucconi test proposed by Odoardo Cucconi in 1968.
References
- ↑ Bhattacharya, P. K.; Frierson, Dargan (May 1981). "A Nonparametric Control Chart for Detecting Small Disorders". The Annals of Statistics. 9 (3): 544–554. doi: 10.1214/aos/1176345458 . ISSN 0090-5364.
- ↑ Amin, Raid W.; Reynolds, Marion R.; Saad, Bakir (January 1995). "Nonparametric quality control charts based on the sign statistic". Communications in Statistics - Theory and Methods. 24 (6): 1597–1623. doi:10.1080/03610929508831574. ISSN 0361-0926.
- ↑ Balakrishnan, N.; Triantafyllou, I.S.; Koutras, M.V. (September 2009). "Nonparametric control charts based on runs and Wilcoxon-type rank-sum statistics". Journal of Statistical Planning and Inference. 139 (9): 3177–3192. doi:10.1016/j.jspi.2009.02.013. ISSN 0378-3758.
- ↑ Mukherjee, A.; Chakraborti, S. (2011-09-26). "A Distribution-free Control Chart for the Joint Monitoring of Location and Scale". Quality and Reliability Engineering International. 28 (3): 335–352. doi:10.1002/qre.1249. ISSN 0748-8017.
- ↑ Chowdhury, S.; Mukherjee, A.; Chakraborti, S. (2013-02-19). "A New Distribution-free Control Chart for Joint Monitoring of Unknown Location and Scale Parameters of Continuous Distributions". Quality and Reliability Engineering International. 30 (2): 191–204. doi:10.1002/qre.1488. ISSN 0748-8017.