Earth mover's distance

Last updated

In computer science, the earth mover's distance (EMD) [1] is a measure of dissimilarity between two frequency distributions, densities, or measures, over a metric space D. Informally, if the distributions are interpreted as two different ways of piling up earth (dirt) over D, the EMD captures the minimum cost of building the smaller pile using dirt taken from the larger, where cost is defined as the amount of dirt moved multiplied by the distance over which it is moved.

Contents

The earth mover's distance is also known as Wasserstein metric , KantorovichRubinstein metric, or Mallows's distance. [2] It is the solution of the optimal transport problem, which in turn is also known as the Monge-Kantorovich problem, or sometimes the HitchcockKoopmans transportation problem; [3] when the measures are uniform over a set of discrete elements, the same optimization problem is known as minimum weight bipartite matching.

Formal definitions

The EMD between probability distributions and can be defined as an infimum over joint probabilities:

where is the set of all joint distributions whose marginals are and .

By Kantorovich-Rubinstein duality, this can also be expressed as:

where the supremum is taken over all 1-Lipschitz continuous functions, i.e. .


EMD between signatures

In some applications, it is convenient to represent a distribution as a signature, or collection clusters, where the -th cluster represents a mass of centered at . In this formulation, consider signatures and . Let be the ground distance between clusters and . Then the EMD between and is given by the optimal flow , with the flow between and , that minimizes the overall cost.

subject to the constraints:

The optimal flow is found by solving this linear optimization problem. The earth mover's distance is defined as the work normalized by the total flow:

Variants and extensions

Unequal probability mass


Some applications may require the comparison of distributions with different total masses. One approach is to allow for partial matching, where dirt from the more massive distribution is rearranged to make the less massive, and any leftover "dirt" is discarded at no cost. Formally, let be the total weight of , and be the total weight of . We have:

where is the set of all measures whose projections are and . Note that this generalization of EMD is not a true distance between distributions, as it does not satisfy the triangle inequality.

An alternative approach is to allow for mass to be created or destroyed, on a global or local level, as an alternative to transportation, but with a cost penalty. In that case one must specify a real parameter , the ratio between the cost of creating or destroying one unit of "dirt", and the cost of transporting it by a unit distance. This is equivalent to minimizing the sum of the earth moving cost plus times the L1 distance between the rearranged pile and the second distribution. The resulting measure is a true distance function. [4]

More than two distributions

The EMD can be extended naturally to the case where more than two distributions are compared. In this case, the "distance" between the many distributions is defined as the optimal value of a linear program. This generalized EMD may be computed exactly using a greedy algorithm, and the resulting functional has been shown to be Minkowski additive and convex monotone. [5]

Computing the EMD

The EMD can be computed by solving an instance of transportation problem, using any algorithm for minimum-cost flow problem, e.g. the network simplex algorithm.

The Hungarian algorithm can be used to get the solution if the domain D is the set {0, 1}. If the domain is integral, it can be translated for the same algorithm by representing integral bins as multiple binary bins.

As a special case, if D is a one-dimensional array of "bins" of length n, the EMD can be efficiently computed by scanning the array and keeping track of how much dirt needs to be transported between consecutive bins. Here the bins are zero-indexed:

EMD-based similarity analysis

EMD-based similarity analysis (EMDSA) is an important and effective tool in many multimedia information retrieval [6] and pattern recognition [7] applications. However, the computational cost of EMD is super-cubic to the number of the "bins" given an arbitrary "D". Efficient and scalable EMD computation techniques for large scale data have been investigated using MapReduce, [8] [9] as well as bulk synchronous parallel and resilient distributed dataset. [10]

Applications

An early application of the EMD in computer science was to compare two grayscale images that may differ due to dithering, blurring, or local deformations. [11] In this case, the region is the image's domain, and the total amount of light (or ink) is the "dirt" to be rearranged.

The EMD is widely used in content-based image retrieval to compute distances between the color histograms of two digital images.[ citation needed ] In this case, the region is the RGB color cube, and each image pixel is a parcel of "dirt". The same technique can be used for any other quantitative pixel attribute, such as luminance, gradient, apparent motion in a video frame, etc..

More generally, the EMD is used in pattern recognition to compare generic summaries or surrogates of data records called signatures. [1] A typical signature consists of list of pairs ((x1,m1), ... (xn,mn)), where each xi is a certain "feature" (e.g., color in an image, letter in a text, etc.), and mi is "mass" (how many times that feature occurs in the record). Alternatively, xi may be the centroid of a data cluster, and mi the number of entities in that cluster. To compare two such signatures with the EMD, one must define a distance between features, which is interpreted as the cost of turning a unit mass of one feature into a unit mass of the other. The EMD between two signatures is then the minimum cost of turning one of them into the other.

EMD analysis has been used for quantitating multivariate changes in biomarkers measured by flow cytometry, with potential applications to other technologies that report distributions of measurements. [12]

History

The concept was first introduced by Gaspard Monge in 1781, [13] in the context of transportation theory. The use of the EMD as a distance measure for monochromatic images was described in 1989 by S. Peleg, M. Werman and H. Rom. [11] The name "earth mover's distance" was proposed by J. Stolfi in 1994, [14] and was used in print in 1998 by Y. Rubner, C. Tomasi and L. G. Guibas. [15]

See also

Related Research Articles

<span class="mw-page-title-main">Binomial distribution</span> Probability distribution

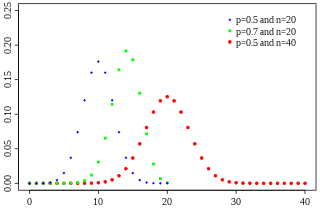
In probability theory and statistics, the binomial distribution with parameters n and p is the discrete probability distribution of the number of successes in a sequence of n independent experiments, each asking a yes–no question, and each with its own Boolean-valued outcome: success or failure. A single success/failure experiment is also called a Bernoulli trial or Bernoulli experiment, and a sequence of outcomes is called a Bernoulli process; for a single trial, i.e., n = 1, the binomial distribution is a Bernoulli distribution. The binomial distribution is the basis for the popular binomial test of statistical significance.

In mathematics, the Lp spaces are function spaces defined using a natural generalization of the p-norm for finite-dimensional vector spaces. They are sometimes called Lebesgue spaces, named after Henri Lebesgue, although according to the Bourbaki group they were first introduced by Frigyes Riesz.

<span class="mw-page-title-main">Multidimensional scaling</span> Set of related ordination techniques used in information visualization

Multidimensional scaling (MDS) is a means of visualizing the level of similarity of individual cases of a data set. MDS is used to translate distances between each pair of objects in a set into a configuration of points mapped into an abstract Cartesian space.

<span class="mw-page-title-main">Total variation distance of probability measures</span> Concept in probability theory

In probability theory, the total variation distance is a distance measure for probability distributions. It is an example of a statistical distance metric, and is sometimes called the statistical distance, statistical difference or variational distance.

In mathematics, a norm is a function from a real or complex vector space to the non-negative real numbers that behaves in certain ways like the distance from the origin: it commutes with scaling, obeys a form of the triangle inequality, and is zero only at the origin. In particular, the Euclidean distance in a Euclidean space is defined by a norm on the associated Euclidean vector space, called the Euclidean norm, the 2-norm, or, sometimes, the magnitude of the vector. This norm can be defined as the square root of the inner product of a vector with itself.

In mathematical statistics, the Kullback–Leibler (KL) divergence, denoted , is a type of statistical distance: a measure of how one probability distribution P is different from a second, reference probability distribution Q. A simple interpretation of the KL divergence of P from Q is the expected excess surprise from using Q as a model instead of P when the actual distribution is P. While it is a measure of how different two distributions are, and in some sense is thus a "distance", it is not actually a metric, which is the most familiar and formal type of distance. In particular, it is not symmetric in the two distributions, and does not satisfy the triangle inequality. Instead, in terms of information geometry, it is a type of divergence, a generalization of squared distance, and for certain classes of distributions, it satisfies a generalized Pythagorean theorem.

<span class="mw-page-title-main">Real coordinate space</span> Space formed by the n-tuples of real numbers

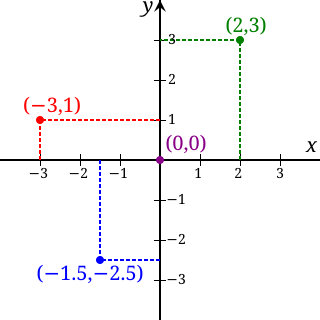
In mathematics, the real coordinate space or real coordinate n-space, of dimension n, denoted Rn or , is the set of all ordered n-tuples of real numbers, that is the set of all sequences of n real numbers, also known as coordinate vectors. Special cases are called the real lineR1, the real coordinate planeR2, and the real coordinate three-dimensional spaceR3. With component-wise addition and scalar multiplication, it is a real vector space.

<span class="mw-page-title-main">Jaccard index</span> Measure of similarity and diversity between sets

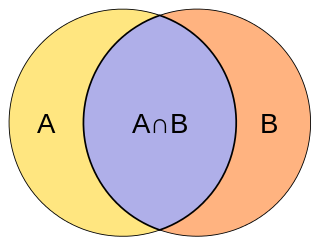
The Jaccard index, also known as the Jaccard similarity coefficient, is a statistic used for gauging the similarity and diversity of sample sets.

In quantum mechanics, notably in quantum information theory, fidelity is a measure of the "closeness" of two quantum states. It expresses the probability that one state will pass a test to identify as the other. The fidelity is not a metric on the space of density matrices, but it can be used to define the Bures metric on this space.

In the mathematical discipline of graph theory, the expander walk sampling theorem intuitively states that sampling vertices in an expander graph by doing relatively short random walk can simulate sampling the vertices independently from a uniform distribution. The earliest version of this theorem is due to Ajtai, Komlós & Szemerédi (1987), and the more general version is typically attributed to Gillman (1998).

In mathematics and economics, transportation theory or transport theory is a name given to the study of optimal transportation and allocation of resources. The problem was formalized by the French mathematician Gaspard Monge in 1781.

In mathematics, the Wasserstein distance or Kantorovich–Rubinstein metric is a distance function defined between probability distributions on a given metric space . It is named after Leonid Vaseršteĭn.

Stein's method is a general method in probability theory to obtain bounds on the distance between two probability distributions with respect to a probability metric. It was introduced by Charles Stein, who first published it in 1972, to obtain a bound between the distribution of a sum of -dependent sequence of random variables and a standard normal distribution in the Kolmogorov (uniform) metric and hence to prove not only a central limit theorem, but also bounds on the rates of convergence for the given metric.

In applied mathematics, topological data analysis (TDA) is an approach to the analysis of datasets using techniques from topology. Extraction of information from datasets that are high-dimensional, incomplete and noisy is generally challenging. TDA provides a general framework to analyze such data in a manner that is insensitive to the particular metric chosen and provides dimensionality reduction and robustness to noise. Beyond this, it inherits functoriality, a fundamental concept of modern mathematics, from its topological nature, which allows it to adapt to new mathematical tools.

<span class="mw-page-title-main">Poisson distribution</span> Discrete probability distribution

In probability theory and statistics, the Poisson distribution is a discrete probability distribution that expresses the probability of a given number of events occurring in a fixed interval of time if these events occur with a known constant mean rate and independently of the time since the last event. It can also be used for the number of events in other types of intervals than time, and in dimension greater than 1.

<span class="mw-page-title-main">Distance correlation</span>

In statistics and in probability theory, distance correlation or distance covariance is a measure of dependence between two paired random vectors of arbitrary, not necessarily equal, dimension. The population distance correlation coefficient is zero if and only if the random vectors are independent. Thus, distance correlation measures both linear and nonlinear association between two random variables or random vectors. This is in contrast to Pearson's correlation, which can only detect linear association between two random variables.

A sum-of-squares optimization program is an optimization problem with a linear cost function and a particular type of constraint on the decision variables. These constraints are of the form that when the decision variables are used as coefficients in certain polynomials, those polynomials should have the polynomial SOS property. When fixing the maximum degree of the polynomials involved, sum-of-squares optimization is also known as the Lasserre hierarchy of relaxations in semidefinite programming.

The distributional learning theory or learning of probability distribution is a framework in computational learning theory. It has been proposed from Michael Kearns, Yishay Mansour, Dana Ron, Ronitt Rubinfeld, Robert Schapire and Linda Sellie in 1994 and it was inspired from the PAC-framework introduced by Leslie Valiant.

In functional analysis and related areas of mathematics, a metrizable topological vector space (TVS) is a TVS whose topology is induced by a metric. An LM-space is an inductive limit of a sequence of locally convex metrizable TVS.

A Stein discrepancy is a statistical divergence between two probability measures that is rooted in Stein's method. It was first formulated as a tool to assess the quality of Markov chain Monte Carlo samplers, but has since been used in diverse settings in statistics, machine learning and computer science.

References

  1. 1 2 Rubner, Y.; Tomasi, C.; Guibas, L.J. (1998). "A metric for distributions with applications to image databases". Sixth International Conference on Computer Vision (IEEE Cat. No.98CH36271). Narosa Publishing House. pp. 59–66. doi:10.1109/iccv.1998.710701. ISBN   81-7319-221-9. S2CID   18648233.
  2. C. L. Mallows (1972). "A note on asymptotic joint normality". Annals of Mathematical Statistics. 43 (2): 508–515. doi: 10.1214/aoms/1177692631 .
  3. Singiresu S. Rao (2009). Engineering Optimization: Theory and Practice (4th ed.). John Wiley & Sons. p. 221. ISBN   978-0-470-18352-6.
  4. Pele, Ofir; Werman, Michael (2008). "A Linear Time Histogram Metric for Improved SIFT Matching". Computer Vision – ECCV 2008. Lecture Notes in Computer Science. Vol. 5304. Springer Berlin Heidelberg. pp. 495–508. doi:10.1007/978-3-540-88690-7_37. eISSN   1611-3349. ISBN   978-3-540-88689-1. ISSN   0302-9743.
  5. Kline, Jeffery (2019). "Properties of the d-dimensional earth mover's problem". Discrete Applied Mathematics. 265: 128–141. doi: 10.1016/j.dam.2019.02.042 . S2CID   127962240.
  6. Mark A. Ruzon; Carlo Tomasi (2001). "Edge, Junction, and Corner Detection Using Color Distributions". IEEE Transactions on Pattern Analysis and Machine Intelligence.
  7. Kristen Grauman; Trevor Darrel (2004). "Fast contour matching using approximate earth mover's distance". Proceedings of CVPR 2004.
  8. Jin Huang; Rui Zhang; Rajkumar Buyya; Jian Chen (2014). "MELODY-Join: Efficient Earth Mover's Distance Similarity Joins Using MapReduce". Proceedings of IEEE International Conference on Data Engineering.
  9. Jia Xu; Bin Lei; Yu Gu; Winslett, M.; Ge Yu; Zhenjie Zhang (2015). "Efficient Similarity Join Based on Earth Mover's Distance Using MapReduce". IEEE Transactions on Knowledge and Data Engineering.
  10. Jin Huang; Rui Zhang; Rajkumar Buyya; Jian Chen, M.; Yongwei Wu (2015). "Heads-Join: Efficient Earth Mover's Distance Join on Hadoop". IEEE Transactions on Parallel and Distributed Systems.
  11. 1 2 S. Peleg; M. Werman; H. Rom (1989). "A unified approach to the change of resolution: Space and gray-level". IEEE Transactions on Pattern Analysis and Machine Intelligence. 11 (7): 739–742. doi:10.1109/34.192468. S2CID   18415340.
  12. Orlova, DY; Zimmerman, N; Meehan, C; Meehan, S; Waters, J; Ghosn, EEB (23 March 2016). "Earth Mover's Distance (EMD): A True Metric for Comparing Biomarker Expression Levels in Cell Populations". PLOS One . 11 (3): e0151859. Bibcode:2016PLoSO..1151859O. doi: 10.1371/journal.pone.0151859 . PMC   4805242 . PMID   27008164.
  13. "Mémoire sur la théorie des déblais et des remblais". Histoire de l'Académie Royale des Science, Année 1781, avec les Mémoires de Mathématique et de Physique. 1781.
  14. J. Stolfi, personal communication to L. J. Guibas, 1994, as cited by Rubner, Yossi; Tomasi, Carlo; Guibas, Leonidas J. (2000). "The earth mover's distance as a metric for image retrieval" (PDF). International Journal of Computer Vision. 40 (2): 99–121. doi:10.1023/A:1026543900054. S2CID   14106275.
  15. Yossi Rubner; Carlo Tomasi; Leonidas J. Guibas (1998). "A metric for distributions with applications to image databases". Sixth International Conference on Computer Vision (IEEE Cat. No.98CH36271). pp. 59–66. doi:10.1109/ICCV.1998.710701. ISBN   81-7319-221-9. S2CID   18648233.{{cite book}}: CS1 maint: date and year (link)