Economic indicator

Last updated

An economic indicator is a statistic about an economic activity. Economic indicators allow analysis of economic performance and predictions of future performance. One application of economic indicators is the study of business cycles. Economic indicators include various indices, earnings reports, and economic summaries: for example, the unemployment rate, quits rate (quit rate in American English), housing starts, consumer price index (a measure for inflation), Inverted yield curve, [1] consumer leverage ratio, industrial production, bankruptcies, gross domestic product, broadband internet penetration, retail sales, price index, and changes in credit conditions.

Contents

The leading business cycle dating committee in the United States of America is the private National Bureau of Economic Research. The Bureau of Labor Statistics is the principal fact-finding agency for the U.S. government in the field of labor economics and statistics. Other producers of economic indicators includes the United States Census Bureau and United States Bureau of Economic Analysis.

Classification by timing

Equities as leading, GDP as coincident, and business credit as lagging indicator CycleSandwich.png
Equities as leading, GDP as coincident, and business credit as lagging indicator

Economic indicators can be classified into three categories according to their usual timing in relation to the business cycle: leading indicators, lagging indicators, and coincident indicators.

Leading indicators

PPI is a leading indicator, CPI and PCE lag
.mw-parser-output .legend{page-break-inside:avoid;break-inside:avoid-column}.mw-parser-output .legend-color{display:inline-block;min-width:1.25em;height:1.25em;line-height:1.25;margin:1px 0;text-align:center;border:1px solid black;background-color:transparent;color:black}.mw-parser-output .legend-text{}
PPI
Core PPI
CPI
Core CPI
PCE
Core PCE Inflation data.webp
PPI is a leading indicator, CPI and PCE lag
   PPI
  Core PPI
   CPI
   Core CPI
   PCE
  Core PCE

Leading indicators are indicators that usually, but not always, change before the economy as a whole changes. [3] They are therefore useful as short-term predictors of the economy. Leading indicators include the index of consumer expectations, building permits, and credit conditions. The Conference Board publishes a composite Leading Economic Index consisting of ten indicators designed to predict activity in the U. S. economy six to nine months in future.

Components of the Conference Board's Leading Economic Indicators Index: [4]

  1. Average weekly hours (manufacturing) — Adjustments to the working hours of existing employees are usually made in advance of new hires or layoffs, which is why the measure of average weekly hours is a leading indicator for changes in unemployment.
  2. Average weekly initial jobless claims for unemployment insurance — The CB reverses the value of this component from positive to negative because a positive reading indicates a loss in jobs. The initial jobless-claims data is more sensitive to business conditions than other measures of unemployment, and as such leads the monthly unemployment data released by the U.S. Department of Labor.
  3. Manufacturers' new orders for consumer goods/materials — This component is considered a leading indicator because increases in new orders for consumer goods and materials usually mean positive changes in actual production. The new orders decrease inventory and contribute to unfilled orders, a precursor to future revenue.
  4. Vendor performance (slower deliveries diffusion index) — This component measures the time it takes to deliver orders to industrial companies. Vendor performance leads the business cycle because an increase in delivery time can indicate rising demand for manufacturing supplies. Vendor performance is measured by a monthly survey from the National Association of Purchasing Managers (NAPM). This diffusion index measures one-half of the respondents reporting no change and all respondents reporting slower deliveries.
  5. Manufacturers' new orders for non-defense capital goods — As stated above, new orders lead the business cycle because increases in orders usually mean positive changes in actual production and perhaps rising demand. This measure is the producer's counterpart of new orders for consumer goods/materials component (#3).
  6. Building permits for new private housing units.
  7. Stock prices of 500 common stocks — Equity market returns are considered a leading indicator because changes in stock prices reflect investors' expectations for the future of the economy and interest rates.
    Corporate equities as leading indicator with respect to GDP EquityBDP.png
    Corporate equities as leading indicator with respect to GDP
  8. Leading Credit Index - a composite index developed by the Conference Board consisting of six financial indicators such as yield spreads, loan survey information and investor sentiment [5]
  9. Interest rate spread (10-year Treasury vs. Federal Funds target) — The interest rate spread is often referred to as the yield curve and implies the expected direction of short-, medium- and long-term interest rates. Changes in the yield curve have been the most accurate predictors of downturns in the economic cycle. This is particularly true when the curve becomes inverted, that is, when the longer-term returns are expected to be less than the short rates.
  10. Index of consumer expectations — This is the only component of the leading indicators that is based solely on expectations. This component leads the business cycle because consumer expectations can indicate future consumer spending or tightening. The data for this component comes from the University of Michigan's Survey Research Center, and is released once a month.

Economist D.W. Mackenzie suggests that the ratio of private to public employment may also be useful as a leading economic indicator.

Lagging indicators

Lagging indicators are indicators that usually change after the economy as a whole does. Typically the lag is a few quarters of a year. The unemployment rate is a lagging indicator: employment tends to increase two or three quarters after an upturn in the general economy.[ citation needed ]. In a performance measuring system, profit earned by a business is a lagging indicator as it reflects a historical performance; similarly, improved customer satisfaction is the result of initiatives taken in the past.[ citation needed ]

The Index of Lagging Indicators is published monthly by The Conference Board, a non-governmental organization, which determines the value of the index from seven components.

The Index tends to follow changes in the overall economy.

The components on the Conference Board's index are:

Federal Funds Rate in the US lagging behind capacity utilization in manufacturing FedfundsCAP.png
Federal Funds Rate in the US lagging behind capacity utilization in manufacturing

Coincident indicators

Coincident indicators change at approximately the same time as the whole economy, thereby providing information about the current state of the economy. There are many coincident economic indicators, such as Gross Domestic Product, industrial production, personal income and retail sales. A coincident index may be used to identify, after the fact, the dates of peaks and troughs in the business cycle. [6]

There are four economic statistics comprising the Index of Coincident Economic Indicators: [7]

The Philadelphia Federal Reserve produces state-level coincident indexes based on 4 state-level variables: [8]

By direction

There are also three terms that describe an economic indicator's direction relative to the direction of the general economy:

The wage share (arguably) as countercyclical, but also as a lagging indicator with respect to the employment rate as procyclical indicator in the US Goodwin2 fredgraph.png
The wage share (arguably) as countercyclical, but also as a lagging indicator with respect to the employment rate as procyclical indicator in the US
Procyclical indicators
move in the same direction as the general economy: they increase when the economy is doing well; decrease when it is doing badly. Gross domestic product (GDP) is a procyclic indicator.
Countercyclical indicators
move in the opposite direction to the general economy. The unemployment rate and the wage share are countercyclic: in the short run they rise when the economy is deteriorating.
Acyclical indicators
are those with little or no correlation to the business cycle: they may rise or fall when the general economy is doing well, and may rise or fall when it is not doing well. [9]

Local indicators

Local governments often need to project future tax revenues. The city of San Francisco, for example, uses the price of a one-bedroom apartment on Craigslist, weekend subway ridership numbers, parking garage usage, and monthly reports on passenger landings at the city's airport. [10]

See also

Related Research Articles

In economics, a recession is a business cycle contraction that occurs when there is a general decline in economic activity. Recessions generally occur when there is a widespread drop in spending. This may be triggered by various events, such as a financial crisis, an external trade shock, an adverse supply shock, the bursting of an economic bubble, or a large-scale anthropogenic or natural disaster.

<span class="mw-page-title-main">Inflation</span> Devaluation of currency over a period of time

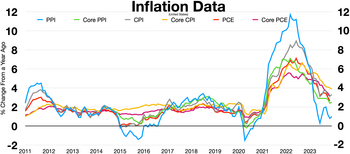
In economics, inflation is a general increase in the prices of goods and services in an economy. This is usually measured using the consumer price index (CPI). When the general price level rises, each unit of currency buys fewer goods and services; consequently, inflation corresponds to a reduction in the purchasing power of money. The opposite of CPI inflation is deflation, a decrease in the general price level of goods and services. The common measure of inflation is the inflation rate, the annualized percentage change in a general price index. As prices faced by households do not all increase at the same rate, the consumer price index (CPI) is often used for this purpose.

A consumer confidence index (CCI) is an economic indicator published by various organizations in several countries.

This aims to be a complete article list of economics topics:

Business cycles are intervals of general expansion followed by recession in economic performance. The changes in economic activity that characterize business cycles have important implications for the welfare of the general population, government institutions, and private sector firms. There are numerous specific definitions of what constitutes a business cycle. The simplest and most naïve characterization comes from regarding recessions as 2 consecutive quarters of negative GDP growth. More satisfactory classifications are provided by, first including more economic indicators and second by looking for more informative data patterns than the ad hoc 2 quarter definition.

The economies of Canada and the United States are similar because both are developed countries. While both countries feature in the top ten economies in the world in 2022, the U.S. is the largest economy in the world, with US$24.8 trillion, with Canada ranking ninth at US$2.2 trillion.

<span class="mw-page-title-main">Yield curve</span> Relationships among bond yields of different maturities

In finance, the yield curve is a graph which depicts how the yields on debt instruments – such as bonds – vary as a function of their years remaining to maturity. Typically, the graph's horizontal or x-axis is a time line of months or years remaining to maturity, with the shortest maturity on the left and progressively longer time periods on the right. The vertical or y-axis depicts the annualized yield to maturity.

Consumer confidence is an economic indicator that measures the degree of optimism that consumers feel about the overall state of the economy and their personal financial situation. If the consumer has confidence in the immediate and near future economy and his/her personal finance, then the consumer will spend more than save.

Procyclical and countercyclical variables are variables that fluctuate in a way that is positively or negatively correlated with business cycle fluctuations in gross domestic product (GDP). The scope of the concept may differ between the context of macroeconomic theory and that of economic policy–making.

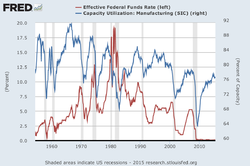
Capacity utilization or capacity utilisation is the extent to which a firm or nation employs its installed productive capacity. It is the relationship between output that is produced with the installed equipment, and the potential output which could be produced with it, if capacity was fully used. The Formula is the actual output per period all over full capacity per period expressed as a percentage.

<span class="mw-page-title-main">Inverted yield curve</span> Phenomenon when shorter term bonds yield higher interest rates than longer term bonds

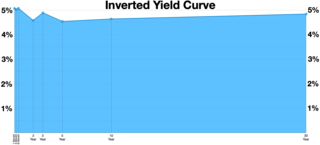
In finance, an inverted yield curve is a yield curve in which short-term debt instruments have a greater yield than longer term bonds. An inverted yield curve is an unusual phenomenon; bonds with shorter maturities generally provide lower yields than longer term bonds.

<span class="mw-page-title-main">The Conference Board</span> American non-profit research organization

The Conference Board, Inc. is a 501(c)(3) non-profit business membership and research group organization. It counts over 1,000 public and private corporations and other organizations as members, encompassing 60 countries.

The Conference Board Leading Economic Index is an American economic leading indicator intended to forecast future economic activity. It is calculated by The Conference Board, a non-governmental organization, which determines the value of the index from the values of ten key variables. These variables have historically turned downward before a recession and upward before an expansion. The per cent change year over year of the Leading Economic Index is a lagging indicator of the market directions.

See Business Cycle.

The Economic Cycle Research Institute (ECRI) based in New York City, is an independent institute formed in 1996 by Geoffrey H. Moore, Anirvan Banerji, and Lakshman Achuthan. It provides economic modeling, financial databases, economic forecasting, and market cycles services to investment managers, business executives, and government policymakers.

Real business-cycle theory is a class of new classical macroeconomics models in which business-cycle fluctuations are accounted for by real shocks. Unlike other leading theories of the business cycle, RBC theory sees business cycle fluctuations as the efficient response to exogenous changes in the real economic environment. That is, the level of national output necessarily maximizes expected utility, and governments should therefore concentrate on long-run structural policy changes and not intervene through discretionary fiscal or monetary policy designed to actively smooth out economic short-term fluctuations.

<span class="mw-page-title-main">Economic recovery</span> Phase of the business cycle following a recession

An economic recovery is the phase of the business cycle following a recession. The overall business outlook for an industry looks optimistic during the economic recovery phase.

This glossary of economics is a list of definitions of terms and concepts used in economics, its sub-disciplines, and related fields.

The Aruoba-Diebold-Scotti Business Conditions Index is a coincident business cycle indicator used in macroeconomics in the United States. The index measures business activity, which may be correlated with periods of expansion and contraction in the economy. The primary and novel function of the ADS index stems from its use of high-frequency economic data and subsequent high-frequency updating, opposed to the traditionally highly-lagged and infrequently-published macroeconomic data such as GDP.

<span class="mw-page-title-main">Sahm rule</span> Method of determining when the economy has entered a recession

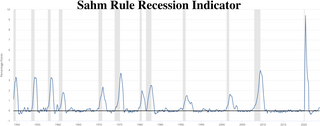
In macroeconomics, the Sahm rule, or Sahm rule recession indicator, is a heuristic measure by the United States' Federal Reserve for determining when an economy has entered a recession. It is useful in real-time evaluation of the business cycle and relies on monthly unemployment data from the Bureau of Labor Statistics (BLS). It is named after economist Claudia Sahm, formerly of the Federal Reserve and Council of Economic Advisors.

References

  1. "The impact of an inverted yield curve".
  2. "What Does the Producer Price Index Tell You?".
  3. O'Sullivan, Arthur; Sheffrin, Steven M. (2003). Economics: Principles in Action . Upper Saddle River, New Jersey: Pearson Prentice Hall. p.  314.
  4. "US LEADING INDICATORS". www.conference-board.org. July 20, 2023. Retrieved 17 August 2023.
  5. "Using a Leading Credit Index to Predict Turning Points in the U.S. Business Cycle". www.conference-board.org. December 2011. Retrieved 17 August 2023.
  6. Smith, Charles Emrys, "Economic Indicators", in Wankel, C. (ed.) Encyclopedia of Business in Today's World (2009). California, US.
  7. Yamarone, Richard (2012). "Indexes of Leading, Lagging, and Coincident Indicators". The Trader's Guide to Key Economic Indicators. John Wiley & Sons, Inc. pp. 47–63. doi:10.1002/9781118532461.ch2. ISBN   9781118532461.
  8. "State Coincident Indexes". Federal Reserve Bank of Philadelphia. Retrieved 4 October 2010.
  9. About.com, A Beginner's Guide to Economic Indicators Archived 2009-08-31 at the Wayback Machine , retrieved November 2009. This was the source of "procyclic", "acyclic", etc., as well as confirmation of "leading", "lagging", etc., and the source of some of the examples.
  10. "A Fresh Approach To Measuring The Economy". NPR. 2010-04-11. Retrieved 2010-04-20.