Economy of Uganda

Last updated

Economy of Uganda
KampalaSkyline2.jpg
Kampala, the financial centre of Uganda
Currency Ugandan shilling (USh)
1 July – 30 June
Trade organisations
AU, EAC, COMESA, WTO
Country group
Statistics
GDP
  • Increase2.svg $36.484 billion (nominal, 2020 est.) [3]
  • Increase2.svg $113.476 billion (PPP, 2020 est.) [3]
GDP rank 90th (nominal, 2017)
GDP growth
  • 3.9% (2017) 5.9% (2018)
  • 6.1% (2019e) 6.5% (2020f) [4] [note 1]
GDP per capita
  • Increase2.svg $916.156 (nominal, 2020 est.) [3]
  • Increase2.svg $2,752 (PPP, 2020 est.) [3]
GDP by sector
  • Agriculture: 71.9%
  • Industry: 4.4%
  • Services: 23.7%
  • (2017 est.)
3.2% (2019) [3]
19.1% (31 December 2017 est.) [5]
Population below poverty line
  • 21.4% (2017 est.) [6]
  • 41.7% on less than $1.90/day (2016) [7]
42.8 medium (2016) [8]
Labour force
  • Increase2.svg 16,833,878 (2019) [11]
  • 48.0% employment rate (2017) [12]
Labour force by occupation
  • agriculture: 71%
  • industry: 7%
  • services: 22%
  • (2013 est.) [6]
Main industries
sugar processing, brewing, tobacco, cotton textiles, cement, steel production [6]
External
ExportsIncrease2.svg $3.339 billion (2017 est.) [6]
Export goods
coffee, fish and fish products, tea, cotton, flowers, horticultural products, gold [6]
Main export partners
ImportsIncrease2.svg $5.036 billion (2017 est.) [6]
Import goods
capital equipment, vehicles, petroleum, medical supplies, cereals [6]
Main import partners
FDI stock
$10.909 billion (2016) [13]
Decrease2.svg −$1.212 billion (2017 est.) [6]
$7.163 billion (31 December 2017 est.) [6]
Public finances
$25.3 billion ($11.7 billion, domestic) (2023) [14]
–4.1% (of GDP) (2017 est.) [6]
Revenues$3.98 billion (2017) [15]
Expenses$7.66 billion (2017) [15]
Economic aid$3.68 billion (2017) [15]
Standard & Poor's: Decrease2.svg B [16]
Increase2.svg $3.654 billion (31 December 2017 est.) [6]
Main data source: CIA World Fact Book
All values, unless otherwise stated, are in US dollars.
A family in a market in Kampala. KampalaMarket.jpg
A family in a market in Kampala.

The economy of Uganda has a great potential and appears poised for rapid growth and development. [17] Uganda is endowed with significant natural resources, including ample fertile land, regular rainfall, and mineral deposits.

Contents

Chronic political instability and erratic economic management since the implementation of self-rule has produced a record of persistent economic decline that has left Uganda among the world's poorest and least-developed countries. [18] The informal economy, which is predominantly female, is broadly defined as a group of vulnerable individuals without protections in regards to their work. [19] Women face a plethora of barriers specific to gender when attempting to access the formal economy of Uganda, and research revealed prejudice against lending to women in the informal sector. [20] [21] The national energy needs have historically exceeded the domestic energy generation, though large petroleum reserves have been found in the country's west. [22]

After the turmoil of the Amin period, the country began a program of economic recovery in 1981 that received considerable foreign assistance. From mid-1984 onward, overly expansionist fiscal and monetary policies and the renewed outbreak of civil strife led to a setback in economic performance. [23]

The economy has grown since the 1990s; real gross domestic product (GDP) grew at an average of 6.7% annually during the period 1990–2015, [24] whereas real GDP per capita grew at 3.3% per annum during the same period. [24] During this period, the Ugandan economy experienced economic transformation: the share of agriculture value added in GDP declined from 56% in 1990 to 24% in 2015; the share of industry grew from 11% to 20% (with manufacturing increasing at a slower pace, from 6% to 9% of GDP); and the share of services went from 32% to 55%. [24]

International trade and finance

Ugandan export destinations in 2006. 2006Ugandan exports.PNG
Ugandan export destinations in 2006.


Since assuming power in early 1986, Museveni's government has taken important steps toward economic rehabilitation. The country's infrastructure, notably its transport and communications systems which were destroyed by war and neglect, is being rebuilt. Recognizing the need for increased external support, Uganda negotiated a policy framework paper with the IMF and the World Bank in 1987. Uganda subsequently began implementing economic policies designed to restore price stability and sustainable balance of payments, improve capacity utilization, rehabilitate infrastructure, restore producer incentives through proper price policies, and improve resource mobilization and allocation in the public sector. These so-called Structural Adjustment Programs greatly improved the shape of the Ugandan economy, but did not lead to economic growth in the first decade after their implementation. Since 1995, Uganda has experienced rapid economic growth, but it is not clear to what extent this positive development can be attributed to Structural Adjustment. [25] Uganda is a member of the World Trade Organization, since 1 January 1995 and a member of the General Agreement on Tariffs and Trade, from 25 October 1962. [26]

Currency

Uganda began issuing its own currency in 1966 through the Bank of Uganda. [27]

Agriculture

Agricultural products supply a significant portion of Uganda's foreign exchange earnings, with coffee alone, of which Uganda is Africa's second largest producer after Ethiopia, [28] accounting for about 17% of the country's exports in 2017 and earning the country US$545 million. [28] Exports of apparel, hides, skins, vanilla, vegetables, fruits, cut flowers, and fish are growing, while cotton, tea, and tobacco continue to be mainstays. [29]

Uganda produced in 2018:

In addition to smaller productions of other agricultural products, like cotton (87 thousand tons), tea (62 thousand tons), tobacco (35 thousand tons) and cocoa (27 thousand tons). [30]

Transportation

As of 2017, Uganda had about 130,000 kilometres (80,778 mi) of roads, with approximately 5,300 kilometres (3,293 mi) (4 percent) paved. [31] Most paved roads radiate from Kampala, the country's capital and largest city. [32]

As of 2017, Uganda's metre gauge railway network measures about 1,250 kilometres (777 mi) in length. Of this, about 56% (700 kilometres (435 mi)), is operational. A railroad originating at Mombasa on the Indian Ocean connects with Tororo, where it branches westward to Jinja, Kampala, and Kasese and northward to Mbale, Soroti, Lira, Gulu, and Pakwach. The only railway line still operating, however, is the one to Kampala. [31]

Uganda's important link to the port of Mombasa is now mainly by road, which serves its transport needs and also those of neighboring Rwanda, Burundi, parts of the Democratic Republic of the Congo, and South Sudan. [33]

An international airport is at Entebbe on the northern shores of Lake Victoria, about 41 kilometres (25 mi) south of Kampala. [34] In January 2018, the government of Uganda began the construction of Kabaale International Airport, in the Western Region of Uganda. This will be Uganda's second international airport, which is planned to facilitate the construction of an oil refinery and boost tourism. [35]

The transport union Amalgamated Transport and General Workers Union (ATWGU) is one of the more powerful trade unions in the country with about 100,000 members, many of whom are informal workers. [36]

Communications

The Uganda Communications Commission regulates communications, primarily "delivered through an enabled private sector." The companies it regulates include television networks, radio stations, mobile network operators, and fixed-line telephone companies. [37]

Mining and petroleum

Uganda's predominant mineral occurrences are gold, tungsten, tin, beryl, and tantalite in the south; tungsten, clay, and granite between latitude zero and two degrees north; and gold, mica, copper, limestone, and iron in the north. [38]

In late 2012, the government of Uganda was taken to court over value added tax that it placed on goods and services purchased by Tullow Oil, a foreign oil company operating in the country at the time. [39] The court case was heard at an international court based in the United States. The Ugandan government insisted that Tullow could not claim taxes on supplies as recoverable costs before oil production starts. [40] Sources from within the government reveal that the main concern at present is the manner in which millions of dollars have been lost in the past decade, money that could allegedly have stayed in Uganda for investment in the public sector; a Global Financial Integrity report recently revealed that illicit money flows from Uganda between 2001 and 2012 totalled $680 million. [40] Tullow Oil was represented in the court case by Kampala Associated Advocates, whose founder is Elly Kurahanga, the President of Tullow Uganda. [39] A partner at Kampala Associated Advocates, Peter Kabatsi, was also Uganda's solicitor general between 1990 and 2002, and he has denied claims that he negotiated contracts with foreign oil firms during his time in this role. [39]

In June 2015, the Ugandan government and Tullow Oil settled a longstanding dispute regarding the amount of certain capital gains taxes that the company owed to the government. [41] The government claimed that the company owed US$435 million. [42] The claim, however, was settled for US$250 million. [41]

In April 2018, the government signed agreements with Albertine Graben Refinery Consortium, an International consortium led by General Electric of the United States, to build a 60,000 barrels-per-day Uganda Oil Refinery in Western Uganda. The cost of the development is budgeted at about US$4 billion. [43] [44]

GDP per capita

GDP per capita (PPP) according to Madisson

Historical evolution of GDP per capita (PPP) of Uganda during the period 1950-2005 (expressed in dollars)
Economy of Uganda

Source: Maddison Historical Statistics Project [45]

Historical evolution of GDP per capita (PPP) of Uganda during the period 1985-2040 (expressed in dollars)
Economy of Uganda

Source: Maddison Historical Statistics Project [45]

Women in the Economy

The agriculture sector of the Ugandan economy, which composes roughly 40% of the country's GDP, is largely fulfilled by women laborers, especially in managing products, marketing, and the crop sub-sector. [46] 76% of women work in the agriculture sector and roughly 66% of men do, and women provide for 80% of food crops and 60% of traditional exports such as coffee or tea. [20] In the formal, non-agricultural economy, men constitute 61% of the workforce, whereas women predominate the informal economy, and this can be attributed to the lack of equity between men and women in the country. [46] The Uganda Bureau of Statistics reported, when looking at the urban workforce in 2015, 88.6% of women were employed informally, and 84.2% of men were. [47] Women are unable to enter into certain sectors, especially in the formal economy, due to the inability to provide substantial initial funding, and remain in the trade and service sectors of the economy. Comparatively, men dominate the more profitable sectors, such as manufacturing. [20] Women traders make up 70% of those in markets and 40% in shops in addition to dominating other sectors such as the service industry, crafts, and tailoring. [48]

Women are often undervalued in data compilation, particularly when considering their role in their domestic home lives. For example, women commonly match the contribution of their husbands to their familial income, if not provide more, when taking into consideration the value of their labor and the profits made from selling excess food. [20] Urban women on average earn between 50% and 70% of a household's income. [48] Women are also discredited in data collection due to biases of data collectors resulting in inaccurate reports, as well as income being measured per house, rather than separating by gender. [20] The barriers women face in furthering their entrepreneurial careers are different from those faced by men; this is inherent in the biased culture and institutions plaguing Uganda despite the passing of somewhat progressive policies, especially with the 1985 transition of government to the National Resistance Movement party. [49]

Data

YearGDP

(in bil. US$ PPP)

GDP per capita

(in US$ PPP)

GDP

(in bil. US$ nominal)

GDP growth

(real)

Inflation rate

(in Percent)

Government debt

(in % of GDP)

19805.95257.5Decrease2.svg-3.4%Increase2.svg99.2%n/a
1981Increase2.svg6.7Increase2.svg580Increase2.svg12.1Increase2.svg3.9%Increase2.svg100.0%n/a
1982Increase2.svg7.7Increase2.svg646Decrease2.svg8.4Increase2.svg8.2%Increase2.svg100.0%n/a
1983Increase2.svg8.4Increase2.svg683Increase2.svg9.6Increase2.svg4.9%Increase2.svg150.0%n/a
1984Increase2.svg8.5Decrease2.svg665Decrease2.svg7.4Decrease2.svg-3.0%Increase2.svg16.7%n/a
1985Steady2.svg8.5Decrease2.svg644Decrease2.svg6.8Decrease2.svg-3.0%Increase2.svg100.0%n/a
1986Increase2.svg8.7Decrease2.svg640Decrease2.svg6.7Increase2.svg0.9%Increase2.svg143.8%n/a
1987Increase2.svg9.3Increase2.svg657Increase2.svg10.9Increase2.svg4.0%Increase2.svg215.4%n/a
1988Increase2.svg10.4Increase2.svg710Increase2.svg11.3Increase2.svg8.3%Increase2.svg166.7%n/a
1989Increase2.svg11.5Increase2.svg757Decrease2.svg9.1Increase2.svg6.4%Increase2.svg130.8%n/a
1990Increase2.svg12.7Increase2.svg807Decrease2.svg7.5Increase2.svg6.5%Increase2.svg45.4%n/a
1991Increase2.svg13.4Increase2.svg820Decrease2.svg3.9Increase2.svg1.8%Increase2.svg20.8%n/a
1992Increase2.svg14.5Increase2.svg860Decrease2.svg3.6Increase2.svg5.9%Increase2.svg42.2%n/a
1993Increase2.svg15.8Increase2.svg908Increase2.svg4.3Increase2.svg6.7%Increase2.svg30.0%n/a
1994Increase2.svg17.4Increase2.svg967Increase2.svg6.2Increase2.svg7.7%Increase2.svg5.9%n/a
1995Increase2.svg19.4Increase2.svg1,045Increase2.svg7.5Increase2.svg9.2%Increase2.svg6.8%n/a
1996Increase2.svg21.1Increase2.svg1,098Increase2.svg7.7Increase2.svg6.6%Increase2.svg7.5%n/a
1997Increase2.svg22.4Increase2.svg1,132Increase2.svg8.4Increase2.svg4.6%Increase2.svg7.7%44.2%
1998Increase2.svg24.1Increase2.svg1,177Decrease2.svg8.2Increase2.svg6.1%Increase2.svg5.8%Increase Negative.svg45.1%
1999Increase2.svg26.4Increase2.svg1,249Decrease2.svg7.8Increase2.svg8.0%Increase2.svg5.8%Increase Negative.svg47.7%
2000Increase2.svg28.0Increase2.svg1,284Increase2.svg7.8Increase2.svg3.9%Increase2.svg3.4%Increase Negative.svg48.5%
2001Increase2.svg31.2Increase2.svg1,383Increase2.svg7.8Increase2.svg8.8%Increase2.svg1.9%Increase Negative.svg51.4%
2002Increase2.svg33.9Increase2.svg1,456Increase2.svg8.4Increase2.svg7.1%Decrease2.svg-0.3%Increase Negative.svg54.7%
2003Increase2.svg36.7Increase2.svg1,521Increase2.svg8.7Increase2.svg6.2%Increase2.svg8.7%Increase Negative.svg55.1%
2004Increase2.svg39.8Increase2.svg1,597Increase2.svg10.8Increase2.svg5.8%Increase2.svg3.7%Decrease Positive.svg49.0%
2005Increase2.svg45.2Increase2.svg1,753Increase2.svg12.5Increase2.svg10.0%Increase2.svg8.6%Decrease Positive.svg42.6%
2006Increase2.svg49.9Increase2.svg1,870Increase2.svg14.1Increase2.svg7.0%Increase2.svg7.2%Decrease Positive.svg27.8%
2007Increase2.svg55.4Increase2.svg2,006Increase2.svg17.5Increase2.svg8.1%Increase2.svg6.1%Decrease Positive.svg17.0%
2008Increase2.svg62.3Increase2.svg2,181Increase2.svg22.4Increase2.svg10.4%Increase2.svg12.0%Decrease Positive.svg15.7%
2009Increase2.svg67.8Increase2.svg2,294Increase2.svg24.1Increase2.svg8.1%Increase2.svg13.0%Decrease Positive.svg14.8%
2010Increase2.svg73.7Increase2.svg2,416Increase2.svg24.7Increase2.svg7.5%Increase2.svg4.0%Increase Negative.svg18.4%
2011Increase2.svg81.0Increase2.svg2,570Increase2.svg27.5Increase2.svg7.7%Increase2.svg18.7%Decrease Positive.svg18.0%
2012Decrease2.svg77.2Decrease2.svg2,373Increase2.svg30.9Increase2.svg2.3%Increase2.svg14.0%Increase Negative.svg19.5%
2013Increase2.svg80.3Increase2.svg2,395Increase2.svg32.3Increase2.svg3.9%Increase2.svg5.5%Increase Negative.svg22.1%
2014Increase2.svg84.1Increase2.svg2,441Increase2.svg34.8Increase2.svg5.7%Increase2.svg4.3%Increase Negative.svg24.8%
2015Increase2.svg85.4Decrease2.svg2,406Decrease2.svg29.8Increase2.svg8.0%Increase2.svg3.7%Increase Negative.svg28.5%
2016Increase2.svg86.2Decrease2.svg2,359Increase2.svg30.6Increase2.svg0.2%Increase2.svg5.2%Increase Negative.svg31.0%
2017Increase2.svg89.8Increase2.svg2,384Increase2.svg31.6Increase2.svg6.8%Increase2.svg5.6%Increase Negative.svg33.6%
2018Increase2.svg97.0Increase2.svg2,498Increase2.svg34.1Increase2.svg5.5%Increase2.svg2.5%Increase Negative.svg34.9%
2019Increase2.svg106.4Increase2.svg2,673Increase2.svg37.9Increase2.svg7.8%Increase2.svg2.1%Increase Negative.svg37.6%
2020Decrease2.svg106.2Decrease2.svg2,577Increase2.svg37.9Decrease2.svg-1.4%Increase2.svg2.8%Increase Negative.svg46.3%
2021Increase2.svg118.0Increase2.svg2,780Increase2.svg42.7Increase2.svg6.7%Increase2.svg2.2%Increase Negative.svg51.8%

Source: IMF [50]

See also

Related Research Articles

<span class="mw-page-title-main">Economy of Benin</span>

The economy of Benin remains underdeveloped and dependent on subsistence agriculture and cotton. Cotton accounts for 40% of Benin's GDP and roughly 80% of official export receipts. There is also production of textiles, palm products, and cocoa beans. Maize (corn), beans, rice, peanuts, cashews, pineapples, cassava, yams, and other various tubers are grown for local subsistence. Benin began producing a modest quantity of offshore oil in October 1982. Production ceased in recent years but exploration of new sites is ongoing.

<span class="mw-page-title-main">Economy of Burkina Faso</span>

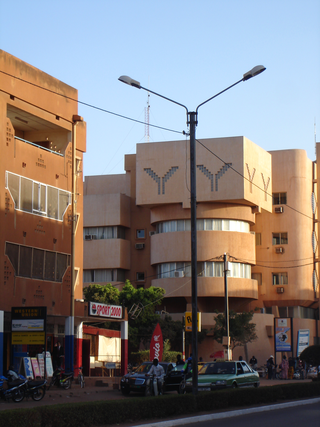
The economy of Burkina Faso is based primarily on subsistence farming and livestock raising. Burkina Faso has an average income purchasing-power-parity per capita of $1,900 and nominal per capita of $790 in 2014. More than 80% of the population relies on subsistence agriculture, with only a small fraction directly involved in industry and services. Highly variable rainfall, poor soils, lack of adequate communications and other infrastructure, a low literacy rate, and a stagnant economy are all longstanding problems of this landlocked country. The export economy also remained subject to fluctuations in world prices.

<span class="mw-page-title-main">Economy of Cameroon</span>

The economy of Cameroon was one of the most prosperous in Africa for a quarter of a century after independence. The drop in commodity prices for its principal exports – petroleum, cocoa, coffee, and cotton – in the mid-1980s, combined with an overvalued currency and economic mismanagement, led to a decade-long recession. Real per capita GDP fell by more than 60% from 1986 to 1994. The current account and fiscal deficits widened, and foreign debt grew. Yet because of its oil reserves and favorable agricultural conditions, Cameroon still has one of the best-endowed primary commodity economies in sub-Saharan Africa.

<span class="mw-page-title-main">Economy of the Central African Republic</span>

The economy of the Central African Republic is $2.321 billion by gross domestic product as of 2019, even lower than much smaller countries such as Barbados with an estimated annual per capita income of just $805 as measured by purchasing power parity in 2019.

<span class="mw-page-title-main">Economy of the Democratic Republic of the Congo</span>

The economy of the Democratic Republic of the Congo has declined drastically around the 1980s, despite being home to vast potential in natural resources and mineral wealth; their gross domestic product is $69.474 billion as of 2023. During the last five reported years the exports of Democratic Republic of the Congo have changed by $15.2B from $13.3B in 2017 to $28.5B in 2022.

<span class="mw-page-title-main">Economy of Ecuador</span>

The economy of Ecuador is the eighth largest in Latin America and the 69th largest in the world by total GDP. Ecuador's economy is based on the export of oil, bananas, shrimp, gold, other primary agricultural products and money transfers from Ecuadorian emigrants employed abroad. In 2017, remittances constituted 2.7% of Ecuador's GDP. The total trade amounted to 42% of the Ecuador's GDP in 2017.

<span class="mw-page-title-main">Economy of Ethiopia</span>

The economy of Ethiopia is a mixed and transition economy with a large public sector. The government of Ethiopia is in the process of privatizing many of the state-owned businesses and moving toward a market economy. The banking, telecommunication and transportation sectors of the economy are dominated by government-owned companies.

<span class="mw-page-title-main">Economy of Kenya</span>

The economy of Kenya is market-based with a few state enterprises. Kenya has an emerging market and is an averagely industrialised nation ahead of its East African peers. Currently a lower middle income nation, Kenya plans to be a newly industrialised nation by 2030. The major industries driving the Kenyan economy include financial services, agriculture, real estate, manufacturing, logistics, tourism, retail and energy. As of 2020, Kenya had the third largest economy in Sub-Saharan Africa, behind Nigeria and South Africa. Regionally, Kenya has had a stronger and more stable economy compared to its neighboring countries within East Africa.By 2023, the country had become Africa's largest start-up hub by both funds invested and number of projects.

<span class="mw-page-title-main">Economy of Kyrgyzstan</span>

The economy of Kyrgyzstan is heavily dependent on the agricultural sector. Cotton, tobacco, wool, and meat are the main agricultural products, although only tobacco and cotton are exported in any quantity. According to Healy Consultants, Kyrgyzstan's economy relies heavily on the strength of industrial exports, with plentiful reserves of gold, mercury and uranium. The economy also relies heavily on remittances from foreign workers. Following independence, Kyrgyzstan was progressive in carrying out market reforms, such as an improved regulatory system and land reform. In 1998, Kyrgyzstan was the first Commonwealth of Independent States (CIS) country to be accepted into the World Trade Organization. Much of the government's stock in enterprises has been sold. Kyrgyzstan's economic performance has been hindered by widespread corruption, low foreign investment and general regional instability. Despite those issues, Kyrgyzstan is ranked 70th on the ease of doing business index.

<span class="mw-page-title-main">Economy of Laos</span>

The economy of Laos is a lower-middle income developing economy. Being one of the socialist states, the Lao economic model resembles the Chinese socialist market and/or Vietnamese socialist-oriented market economies by combining high degrees of state ownership with openness to foreign direct investment and private ownership in a predominantly market-based framework.

<span class="mw-page-title-main">Economy of Libya</span>

The economy of Libya depends primarily on revenues from the petroleum sector, which represents over 95% of export earnings and 60% of GDP. These oil revenues and a small population have given Libya one of the highest nominal per capita GDP in Africa.

<span class="mw-page-title-main">Economy of Rwanda</span>

The economy of Rwanda has undergone rapid industrialisation due to a successful governmental policy. It has a mixed economy. Since the early-2000s, Rwanda has witnessed an economic boom, which improved the living standards of many Rwandans. The Government's progressive visions have been the catalyst for the fast transforming economy. The President of Rwanda, Paul Kagame, has noted his ambition to make Rwanda the "Singapore of Africa". The industrial sector is growing, contributing 16% of GDP in 2012.

<span class="mw-page-title-main">Economy of Sudan</span>

The economy of Sudan is largely based on agriculture and oil exports, with additional revenue coming from mining and manufacturing. GDP growth registered more than 10% per year in 2006 and 2007. Sudan had $30.873 billion by gross domestic product as of 2019, and has been working with the International Monetary Fund (IMF) to implement macroeconomic reforms, including a managed float of the exchange rate. Sudan began exporting crude oil in the last quarter of 1999.

<span class="mw-page-title-main">Economy of Tanzania</span>

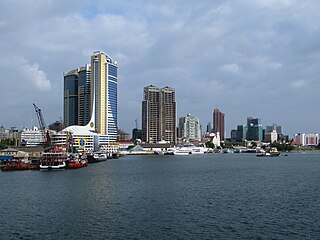
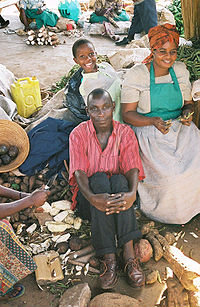
The economy of Tanzania is a lower-middle income economy that is overwhelmingly dependent on agriculture. Tanzania's economy has been transitioning from a planned economy to a market economy since 1985. Although total GDP has increased since these reforms began, GDP per capita dropped sharply at first, and only exceeded the pre-transition figure in around 2007.

<span class="mw-page-title-main">Economy of Togo</span>

The economy of Togo has struggled greatly. The International Monetary Fund (IMF) ranks it as the tenth poorest country in the world, with development undercut by political instability, lowered commodity prices, and external debts. While industry and services play a role, the economy is dependent on subsistence agriculture, with industrialization and regional banking suffering major setbacks.

<span class="mw-page-title-main">Economy of Albania</span>

The economy of Albania went through a process of transition from a centralized economy to a market-based economy on the principles of the free market.

<span class="mw-page-title-main">Economy of Tunisia</span>

The economy of Tunisia is in the process of being liberalized after decades of heavy state direction and participation in the country's economy. Prudent economic and fiscal planning has resulted in moderate but sustained growth for over a decade. Tunisia's economic growth historically has depended on oil, phosphates, agri-food products, car parts manufacturing, and tourism. In the World Economic Forum Global Competitiveness Report for 2015–2016, Tunisia ranks in 92nd place.

<span class="mw-page-title-main">Economy of Papua New Guinea</span>

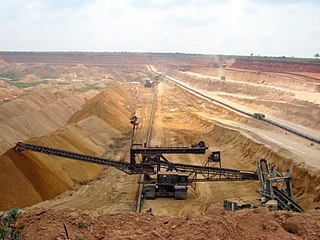
The economy of Papua New Guinea (PNG) is largely underdeveloped with the vast majority of the population living below the poverty line. However, according to the Asian Development Bank its GDP is expected to grow 3.4% in 2022 and 4.6% in 2023. It is dominated by the agricultural, forestry, and fishing sector and the minerals and energy extraction sector. The agricultural, forestry, and fishing sector accounts for most of the labour force of PNG while the minerals and energy extraction sector, including gold, copper, oil and natural gas is responsible for most of the export earnings.

<span class="mw-page-title-main">Economy of Ivory Coast</span>

The economy of Ivory Coast is stable and currently growing, in the aftermath of political instability in recent decades. The Ivory Coast's economy is largely market-based and depends heavily on the agricultural sector. Almost 70% of the Ivorian people are engaged in some form of agricultural activity. GDP per capitaArchived 4 May 2012 at the Wayback Machine grew 82% in the 1960s, reaching a peak growth of 360% in the 1970s, but this proved unsustainable and it shrank by 28% in the 1980s and a further 22% in the 1990s. This decline, coupled with high population growth, resulted in a steady fall in living standards. The Gross national product per capita, now rising again, was about US$727 in 1996. It was substantially higher two decades before. Real GDP growth is expected to average 6.5% in 2024-25.

<span class="mw-page-title-main">Economy of Algeria</span>

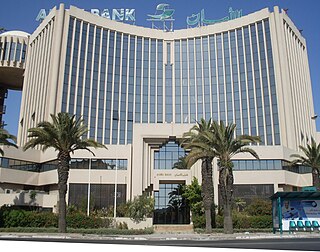
The economy of Algeria deals with Algeria's current and structural economic situation. Since independence in 1962, Algeria has launched major economic projects to build up a dense industrial base. However, despite these major achievements, the Algerian economy has gone through various stages of turbulence.

References

  1. "World Economic Outlook Database, April 2019". IMF.org. International Monetary Fund . Retrieved 29 September 2019.
  2. "World Bank Country and Lending Groups". datahelpdesk.worldbank.org. World Bank . Retrieved 29 September 2019.
  3. 1 2 3 4 5 "World Economic Outlook Database, October 2019". IMF.org. International Monetary Fund . Retrieved 27 February 2020.
  4. "Global Economic Prospects, January 2020 : Slow Growth, Policy Challenges" (PDF). openknowledge.worldbank.org. World Bank. p. 147. Retrieved 22 January 2020.
  5. Biryabarema, Elias (3 October 2017). "Uganda central bank lowers key lending rate to 9.5 percent". Reuters.com . Retrieved 8 June 2018.
  6. 1 2 3 4 5 6 7 8 9 10 11 12 13 "AFRICA :: UGANDA". CIA.gov. Central Intelligence Agency . Retrieved 29 January 2020.
  7. "Poverty headcount ratio at $1.90 a day (2011 PPP) (% of population) - Uganda". data.worldbank.org. World Bank. Retrieved 29 January 2020.
  8. "GINI index (World Bank estimate) - Uganda". data.worldbank.org. World Bank. Retrieved 29 January 2020.
  9. "Human Development Index (HDI)". hdr.undp.org. HDRO (Human Development Report Office) United Nations Development Programme . Retrieved 22 November 2022.
  10. "Inequality-adjusted Human Development Index (IHDI)". hdr.undp.org. HDRO (Human Development Report Office) United Nations Development Programme . Retrieved 22 November 2022.
  11. "Labor force, total - Uganda". data.worldbank.org. World Bank. Retrieved 29 January 2020.
  12. "Employment to population ratio, 15+, total (%) (national estimate) - Uganda". data.worldbank.org. World Bank. Retrieved 29 January 2020.
  13. UNCTAD (November 2017). "Uganda: Foreign Investment: Foreign Direct Investment". Export Entreprises SA Quoting UNCTAD . Retrieved 8 June 2018.
  14. "Audit report: Public debt growing at higher rate than GDP". The Independent (Uganda). 10 January 2024. Retrieved 20 May 2024.
  15. 1 2 3 KPMG (June 2017). "Uganda Budget Brief 2017: Economic Commentary" (PDF). Nairobi: KPMG Kenya . Retrieved 8 June 2018.
  16. "S&P lowers Uganda sovereign credit rating to B from B+". Reuters. 17 January 2014. Retrieved 9 December 2014.
  17. World Bank (December 2017). "Uganda Economic Update, 10th Edition, December 2017 : Accelerating Uganda's Development, Ending Child Marriage, Educating Girls". Washington, DC: World Bank Group. doi:10.1596/29031 . Retrieved 8 June 2018.
  18. Staff Writer (31 May 2016). "The richest and poorest countries in Africa". Johannesburg: Businesstech.co.za. Retrieved 8 June 2018.
  19. "Decent work and the informal economy - ILO 2002 | capacity4dev.eu". europa.eu. Retrieved 2019-05-13.
  20. 1 2 3 4 5 Snyder, Margarget (2000). Women in African Economies: From Burning Sun to Boardroom. Kampala: Fountain Publishers Ltd. pp. 5–6. ISBN   9970-02-187-7.
  21. Okurut, F. N.; Schoombee, A.; Berg, S. Van Der (2005). "Credit Demand and Credit Rationing in the Informal Financial Sector in Uganda1". South African Journal of Economics. 73 (3): 482–497. doi:10.1111/j.1813-6982.2005.00033.x. hdl: 10019.1/50308 . ISSN   1813-6982.
  22. John Aglionby (27 April 2017). "Uganda's oil reserves bring promise of work and infrastructure". The Financial Times . London. Archived from the original on 2022-12-10. Retrieved 8 June 2018.
  23. CARE International (13 November 2002). "Economic cost of the conflict in Northern Uganda". New York City: ReliefWeb . Retrieved 8 June 2018.
  24. 1 2 3 World Bank. "World Development Indicators". Washington, DC: World Bank Group . Retrieved 3 June 2018.
  25. Baten, Jörg (2016). A History of the Global Economy. From 1500 to the Present. Cambridge University Press. pp. 332–334. ISBN   9781107507180.
  26. WTO (8 June 2018). "Uganda and the WTO". Geneva: World Trade Organization (WTO). Retrieved 8 June 2018.
  27. Bank of Uganda (8 June 2018). "History of Uganda Currency". Kampala: Bank of Uganda. Archived from the original on 12 June 2018. Retrieved 8 June 2018.
  28. 1 2 Nakaweesi, Dorothy (25 October 2017). "Uganda posts highest coffee export volumes at 4.6 million bags". Daily Monitor . Kampala. Retrieved 8 June 2018.
  29. International Trade Administration (8 March 2017). "Uganda - Agriculture". Washington, DC: United States Department of Commerce. Retrieved 8 June 2018.
  30. Uganda production in 2018, by FAO
  31. 1 2 Ministry of Works & Transport (2017). "Key Summary Statistics". Kampala: Uganda Ministry of Works and Transport. Archived from the original on 30 July 2020. Retrieved 8 June 2018.
  32. "Map of Uganda Showing Main Roads". Dlca.logcluster.org. 2017. Archived from the original on 20 January 2021. Retrieved 8 June 2018.
  33. NCTTCA (2018). "About the Northern Transportation Corridor". Mombasa: Northern Corridor Transit and Transportation Coordination Authority (NCTTCA). Archived from the original on 3 February 2018. Retrieved 8 June 2018.
  34. Globefeed.com (8 June 2018). "Distance between Post Office Building, Kampala Road, Kampala, Uganda and Entebbe International Airport, 5536 Kampala Road, Entebbe, Uganda". Globefeed.com. Retrieved 8 June 2018.
  35. Steenhoff-Snethlage, Erin (11 December 2017). "Second international airport on the way for Uganda". Johannesburg: Ftwonline.co.za. Retrieved 8 June 2018.
  36. Schminke, Tobias Gerhard (2019). Labour-centred development and decent work : a structuralist perspective on informal employment and trade union organizing in Uganda. Halifax, Nova Scotia: Saint Mary's University. Retrieved 28 August 2023.
  37. Paul Mugume (23 January 2017). "Uganda Communications Commission Toughens on Local Content Prioritization". Kampala: TCTech Magazine. Retrieved 8 June 2018.
  38. Butagira, Tabu (31 August 2012). "Study shows Uganda's vast mineral riches". Daily Monitor . Kampala. Retrieved 8 June 2018.
  39. 1 2 3 Butagira, Tabu (17 December 2012). "Tullow sues government in new tax dispute". Daily Monitor . Kampala. Retrieved 8 June 2018.
  40. 1 2 NorthSouthNews (8 January 2013). "Tullow Oil and Ugandan government in second tax row". NorthSouthNews.com. Retrieved 8 June 2018.
  41. 1 2 RTÉ Ireland (22 June 2015). "Tullow pays $250 million to settle Uganda tax dispute out of court". RTÉ.ie. Dublin, Ireland: Raidió Teilifís Éireann . Retrieved 8 June 2018.
  42. Mason, Rowena (18 April 2011). "Tullow Oil sues Heritage over unpaid Ugandan tax bill". The Daily Telegraph . London. Retrieved 8 June 2018.
  43. Olingo, Allan (14 April 2018). "Uganda signs $4 billion refinery plant deal". The EastAfrican . Nairobi. Retrieved 8 June 2018.
  44. Musisi, Frederic (8 May 2018). "Uganda signs off Shs4 trillion for US in refinery". Daily Monitor . Kampala. Retrieved 8 May 2018.
  45. 1 2 Our World in Data (1950–1981). "Historical evolution of GDP per capita (PPP) of Uganda during the period 1950-2005". ourworldindata.org. Retrieved 2023-11-03.
  46. 1 2 Ellis, Amanda; Manuel, Claire; Blackden, C. Mark (2006). Gender and Economic Growth in Uganda: Unleashing the Power of Women. Washington D.C.: The World Bank. pp. 27–37. ISBN   0-8213-6384-0.
  47. "2017 Statistical Report" (PDF). Uganda Bureau of Statistics: 169. 2017.
  48. 1 2 Lange, Siri (2003). "When women grow wings: Gender relations in the informal economy of Kampala". CMI Report. R 2003: 8: 1–8.
  49. Guma, Prince Karakire (7 September 2015). "Business in the urban informal economy: barriers to women's entrepreneurship in Uganda". Journal of African Business . 16 (3): 305–321. doi:10.1080/15228916.2015.1081025. S2CID   216149652.
  50. "Report for Selected Countries and Subjects" . Retrieved 2018-08-24.
  1. FY based numbers