Economy of Hong Kong

Last updated

Economy of Hong Kong
Hong Kong Harbour Night 2019-06-11.jpg
Central and Victoria Harbour of Hong Kong
Currency Hong Kong dollar (HKD)
1 April – 31 March
Trade organisations
APEC, WTO, Group of Twenty (Chinese delegation), One Belt One Road, AIIB and ICC etc.
Country group
Statistics
PopulationIncrease2.svg 7,498,100 (2023) [3]
GDP
  • Increase2.svg $407 billion (nominal, 2024) [4]
  • Increase2.svg $570 billion (PPP, 2024) [4]
GDP rank
GDP growth
  • +6.4% (2021) −3.5% (2022) [5]
GDP per capita
  • Increase2.svg $53,606 (nominal, 2024) [4]
  • Increase2.svg $75,128 (PPP, 2024) [4]
GDP per capita rank
GDP by sector
1.9% (2022) [5]
Population below poverty line
19.9% (2016 est.) [6]
53.9 high (2016) [6]
Labour force
  • Decrease2.svg 3,946,772 (2019) [8]
  • Decrease2.svg 59.0% employment rate (2016) [9]
Labour force by occupation
  • manufacturing: 6.5%
  • construction: 2.1%
  • wholesale and retail trade, restaurants, and hotels: 43.3%
  • financing, insurance, and real estate, professional and business service: 20.7%
  • transport and communications: 7.8%
  • community, social, and personal services: 19.5%
Unemployment4.3% (2022) [5]
Average gross salary
HK$ 19,100
US$ 2,439
per month (2022 May) [10]
HK$ 17,883
US$ 2,284
per month (2022 May) [11]
Main industries
financing and insurance, import and export trade, professional and business services
External
Exports$533.6 billion (2023) [5]
Main export partners
Imports$593.3 billion (2023) [5]
Main import partners
FDI stock
  • Increase2.svg$2.2 trillion (31 December 2017 est.) [6]
  • Increase2.svg Abroad: $2.036 trillion (31 December 2017 est.) [6]
Increase2.svg $14.75 billion (2017 est.) [6]
Decrease Positive.svg $633.6 billion (31 December 2017 est.) [6]
Public finances
0.1% of GDP (2017 est.) [6]
+5.2% (of GDP) (2017 est.) [6]
Revenues79.34 billion (2017 est.) [6]
Expenses61.64 billion (2017 est.) [6]
Standard & Poor's: [12]
AAA (Domestic)
AAA (Foreign)
AAA (T&C Assessment)
Outlook: Stable [13]
Moody's: [13]
Aa3
Outlook: Negative
Fitch: [13]
AA+
Outlook: Stable
$430.7 billion (April 2023) [14]
Main data source: CIA World Fact Book
All values, unless otherwise stated, are in US dollars.

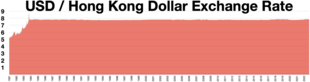
The economy of Hong Kong is a highly developed free-market economy. It is characterised by low taxation, almost free port trade and a well-established international financial market. [15] [16] Its currency, called the Hong Kong dollar, is legally issued by three major international commercial banks, [17] and is pegged to the US dollar. [18] [19] Interest rates are determined by the individual banks in Hong Kong to ensure that they are market driven. [20] There is no officially recognised central banking system, although the Hong Kong Monetary Authority functions as a financial regulatory authority. [21] [22]

Contents

Its economy is governed under positive non-interventionism, and is highly dependent on international trade and finance. For this reason it is regarded as among the most favorable places to start a company. In fact, a recent study shows that Hong Kong has come from 998 registered start-ups in 2014 to over 2800 in 2018, with eCommerce (22%), Fintech (12%), Software (12%) and Advertising (11%) companies comprising the majority. [23] The Economic Freedom of the World Index lists Hong Kong as the second freest territory, with a score of 8.55 based on data from 2021. [24]

Hong Kong's economic strengths include a sound banking system, virtually no public debt, a strong legal system, ample foreign exchange reserves with assets of US$481.6 billion represent over six times the currency in circulation or about 46 per cent of Hong Kong dollar M3 as at the end of March 2022, [25] rigorous anti-corruption measures and close ties with mainland China. [26] The Hong Kong Stock Exchange is a favourable destination for international firms and firms from mainland China to be listed, due to Hong Kong's highly internationalised and modernised financial industry. Additional advantages include the city's capital market in Asia, its size, regulations and available financial tools, which are comparable to London and New York City. [27] [28]

Hong Kong's gross domestic product had grown 180 times between 1961 and 1997. Also, the GDP per capita rose by 87 times within the same time frame. [29] Its economy is slightly larger than Chile's or Romania's [30] [31] [32] and its GDP per capita at purchasing power parity was the twelfth highest globally in 2023. By the latter measure, its GDP per capita was higher than those of the Netherlands, and slightly lower than Brunei. In 2009, Hong Kong's real economic growth fell by 2.8% as a result of the Great Recession. [33]

By the late 20th century, Hong Kong was the seventh largest port in the world and second only to New York City and Rotterdam in terms of container throughput. Hong Kong is a full Member of the World Trade Organization. [34] The Kwai Chung container complex was[ when? ] the largest in Asia, while Hong Kong shipping owners were[ when? ] second only to those of Greece in terms of total tonnage holdings in the world. The Hong Kong Stock Exchange is the sixth largest in the world, with a market capitalisation of about US$3.732 trillion. [35]

Hong Kong has also had an abundant supply of labour from the regions nearby. A skilled labour force coupled with the adoption of modern British/Western business methods and technology ensured that opportunities for external trade, investment, and recruitment were maximised. Prices and wages in Hong Kong are relatively flexible, depending on the performance and stability of the economy of Hong Kong. [36]

Hong Kong raises revenues from the sale and taxation of land and through attracting international businesses to provide capital for its public finance, due to its low tax policy. According to Healy Consultants, Hong Kong has the most attractive business environment within East Asia, in terms of attracting foreign direct investment (FDI). [37] In 2013, Hong Kong was the third largest recipient of FDI in the world. [38]

Hong Kong ranked fourth on the Tax Justice Network's 2011 Financial Secrecy Index. [39] The Hong Kong Government was the fourth highest ranked Asian government [40] in the World Economic Forum's Network Readiness Index (NRI), a measure of a government's information and communication technologies in 2016, and ranked 13th globally. [41]

Since the 1997 handover

Since the 1997 handover, Hong Kong's economic future became far more exposed to the challenges of economic globalisation and the direct competition from cities in mainland China. In particular, Shanghai claimed to have a geographical advantage. The Shanghai municipal government dreamt of turning the city into China's main economic centre by as early as 2010. [42]

Since the 1997 handover, Hong Kong's share of China's GDP has dropped from 18.4% to 2.1% in 2021. In 2021, the Housing Price Index was double of what it was in 1997, while the Real Wage Index was almost unchanged. [43]

Positive non-interventionism

Hong Kong's economic policy has often been cited by economists such as Milton Friedman and the Cato Institute as an example of laissez-faire capitalism, attributing the city's success to the government having a relatively low level of involvement in the economy. However, others have argued that the economic strategy is not at all adequately characterised by the term laissez-faire. [44] They point out that there are still many ways in which the government is involved in the economy, some of which exceed the degree of involvement in other capitalist countries. For example, the government is involved in public works projects, healthcare, education, and social welfare spending. Further, although rates of taxation on personal and corporate income are low by international standards, unlike most other countries Hong Kong's government raises a significant portion of its revenues from land leases and land taxation. All land in Hong Kong is owned by the government and is leased to private developers and users on fixed terms, for fees which are paid to the state treasury. By restricting the sale of land leases, the Hong Kong government keeps the price of land at what some consider as artificially high prices and this allows the government to support public spending with a low tax rate on income and profit. [45]

Economic freedom

In 2020, Hong Kong was ranked as the world's second-freest economy after Singapore in the Index of Economic Freedom , published by The Heritage Foundation. [46] [47] The index measures restrictions on business, trade, investment, finance, property rights and labour, and considers the impact of corruption, government size and monetary controls in 183 economies. Hong Kong is the only economy to have scored 90 points or above on the 100-point scale, achieved in 2014 and 2018. [48]

In 2021, The Heritage Foundation removed Hong Kong as a separate entity from China from its list of freest economics of the world, citing increasing interference from the Chinese government in Hong Kong's governmental system and democratic process. With this, Hong Kong, along with Macao, lost a position they had held in the index since the index's inception in 1995. At the time of the removal from the index, the founder of the Heritage Foundation indicated that while the SARs "offer their citizens more economic freedom than is available to the average citizen of China", these economic policies are still "ultimately controlled from Beijing". [49]

Economic data

Development of real GDP per capita in Hong Kong, Taiwan and Mainland China GDP per capita in Hong Kong, Taiwan and Mailand China.svg
Development of real GDP per capita in Hong Kong, Taiwan and Mainland China

The following table shows the main economic indicators in 1980–2021 (with IMF staff estimates in 2022–2027). Inflation below 5% is in green. [50]

YearGDP

(in Bil. US$PPP)

GDP per capita

(in US$ PPP)

GDP

(in Bil. US$nominal)

GDP per capita

(in US$ nominal)

GDP growth

(real)

Inflation rate

(in Percent)

Unemployment

(in Percent)

Government debt

(in % of GDP)

198036.17,130.728.95,704.0Increase2.svg10.3%Increase2.svg4.4%3.8%n/a
1981Increase2.svg43.1Increase2.svg8,325.5Increase2.svg31.1Increase2.svg5,995.2Increase2.svg9.2%Increase Negative.svg9.5%Increase Negative.svg3.9%n/a
1982Increase2.svg47.1Increase2.svg8,956.7Increase2.svg32.3Increase2.svg6,139.0Increase2.svg2.9%Increase Negative.svg11.0%Decrease Positive.svg3.5%n/a
1983Increase2.svg51.9Increase2.svg9,701.3Decrease2.svg29.9Decrease2.svg5,590.2Increase2.svg6.0%Increase Negative.svg9.9%Increase Negative.svg4.4%n/a
1984Increase2.svg59.2Increase2.svg10,892.1Increase2.svg33.5Increase2.svg6,170.5Increase2.svg10.0%Increase Negative.svg8.5%Decrease Positive.svg3.9%n/a
1985Increase2.svg61.5Increase2.svg11,173.8Increase2.svg35.7Increase2.svg6,490.4Increase2.svg0.7%Increase2.svg3.6%Decrease Positive.svg3.2%n/a
1986Increase2.svg69.7Increase2.svg12,515.9Increase2.svg41.1Increase2.svg7,380.1Increase2.svg11.1%Increase2.svg3.6%Decrease Positive.svg2.8%n/a
1987Increase2.svg80.9Increase2.svg14,415.0Increase2.svg50.6Increase2.svg9,015.2Increase2.svg13.4%Increase Negative.svg5.7%Decrease Positive.svg1.7%n/a
1988Increase2.svg90.9Increase2.svg16,032.8Increase2.svg59.7Increase2.svg10,527.5Increase2.svg8.5%Increase Negative.svg7.8%Decrease Positive.svg1.4%n/a
1989Increase2.svg96.6Increase2.svg16,877.5Increase2.svg68.8Increase2.svg12,012.6Increase2.svg2.3%Increase Negative.svg10.2%Decrease Positive.svg1.1%n/a
1990Increase2.svg104.1Increase2.svg18,099.3Increase2.svg76.9Increase2.svg13,374.3Increase2.svg3.8%Increase Negative.svg10.3%Increase Negative.svg1.3%n/a
1991Increase2.svg113.8Increase2.svg19,563.0Increase2.svg89.0Increase2.svg15,297.6Increase2.svg5.7%Increase Negative.svg11.2%Increase Negative.svg1.8%n/a
1992Increase2.svg123.6Increase2.svg20,995.4Increase2.svg104.3Increase2.svg17,710.5Increase2.svg6.2%Increase Negative.svg9.6%Increase Negative.svg2.0%n/a
1993Increase2.svg134.4Increase2.svg22,405.6Increase2.svg120.4Increase2.svg20,065.7Increase2.svg6.2%Increase Negative.svg8.8%Steady2.svg2.0%n/a
1994Increase2.svg145.5Increase2.svg23,784.5Increase2.svg135.8Increase2.svg22,194.0Increase2.svg6.0%Increase Negative.svg8.8%Decrease Positive.svg1.9%n/a
1995Increase2.svg152.1Increase2.svg24,262.2Increase2.svg144.7Increase2.svg23,070.5Increase2.svg2.4%Increase Negative.svg9.0%Increase Negative.svg3.2%n/a
1996Increase2.svg161.5Increase2.svg24,975.4Increase2.svg159.7Increase2.svg24,699.0Increase2.svg4.3%Increase Negative.svg6.3%Decrease Positive.svg2.8%n/a
1997Increase2.svg172.7Increase2.svg26,496.4Increase2.svg177.3Increase2.svg27,214.6Increase2.svg5.1%Increase Negative.svg5.8%Decrease Positive.svg2.2%n/a
1998Decrease2.svg164.3Decrease2.svg24,962.9Decrease2.svg168.9Decrease2.svg25,649.1Decrease2.svg-5.9%Increase2.svg2.8%Increase Negative.svg4.7%n/a
1999Increase2.svg170.8Increase2.svg25,737.3Decrease2.svg165.7Decrease2.svg24,969.0Increase2.svg2.5%Increase2.svg-4.0%Increase Negative.svg6.3%n/a
2000Increase2.svg188.1Increase2.svg28,025.5Increase2.svg171.6Increase2.svg25,574.5Increase2.svg7.7%Increase2.svg-3.7%Decrease Positive.svg4.9%n/a
2001Increase2.svg193.4Increase2.svg28,737.1Decrease2.svg169.4Decrease2.svg25,166.9Increase2.svg0.6%Increase2.svg-1.6%Increase Negative.svg5.1%n/a
2002Increase2.svg199.7Increase2.svg29,688.3Decrease2.svg166.3Decrease2.svg24,731.1Increase2.svg1.7%Increase2.svg-3.0%Increase Negative.svg7.3%n/a
2003Increase2.svg209.8Increase2.svg31,022.4Decrease2.svg161.4Decrease2.svg23,856.5Increase2.svg3.1%Increase2.svg-2.6%Increase Negative.svg7.9%n/a
2004Increase2.svg234.2Increase2.svg34,456.0Increase2.svg169.1Increase2.svg24,873.9Increase2.svg8.7%Increase2.svg-0.4%Decrease Positive.svg6.8%1.9%
2005Increase2.svg259.4Increase2.svg37,938.2Increase2.svg181.6Increase2.svg26,551.8Increase2.svg7.4%Increase2.svg0.9%Decrease Positive.svg5.6%Decrease Positive.svg1.7%
2006Increase2.svg286.2Increase2.svg41,456.1Increase2.svg193.5Increase2.svg28,028.2Increase2.svg7.0%Increase2.svg2.0%Decrease Positive.svg4.8%Decrease Positive.svg1.4%
2007Increase2.svg313.0Increase2.svg45,106.1Increase2.svg211.6Increase2.svg30,494.6Increase2.svg6.5%Increase2.svg2.0%Decrease Positive.svg4.0%Decrease Positive.svg1.2%
2008Increase2.svg325.8Increase2.svg46,777.4Increase2.svg219.3Increase2.svg31,487.9Increase2.svg2.1%Increase2.svg4.3%Decrease Positive.svg3.5%Decrease Positive.svg1.0%
2009Decrease2.svg319.8Decrease2.svg45,706.2Decrease2.svg214.0Decrease2.svg30,594.0Decrease2.svg-2.5%Increase2.svg0.6%Increase Negative.svg5.3%Decrease Positive.svg0.7%
2010Increase2.svg345.5Increase2.svg48,996.0Increase2.svg228.6Increase2.svg32,421.4Increase2.svg6.8%Increase2.svg2.3%Decrease Positive.svg4.3%Decrease Positive.svg0.6%
2011Increase2.svg369.7Increase2.svg51,998.8Increase2.svg248.5Increase2.svg34,955.1Increase2.svg4.8%Increase Negative.svg5.3%Decrease Positive.svg3.4%Steady2.svg0.6%
2012Increase2.svg373.5Increase2.svg52,082.4Increase2.svg262.6Increase2.svg36,623.7Increase2.svg1.7%Increase2.svg4.1%Decrease Positive.svg3.3%Decrease Positive.svg0.5%
2013Increase2.svg385.4Increase2.svg53,453.6Increase2.svg275.7Increase2.svg38,233.4Increase2.svg3.1%Increase2.svg4.3%Increase Negative.svg3.4%Decrease Positive.svg0.5%
2014Increase2.svg396.0Increase2.svg54,604.9Increase2.svg291.5Increase2.svg40,185.3Increase2.svg2.8%Increase2.svg4.4%Decrease Positive.svg3.3%Decrease Positive.svg0.1%
2015Increase2.svg411.3Increase2.svg56,266.9Increase2.svg309.4Increase2.svg42,325.4Increase2.svg2.4%Increase2.svg3.0%Increase Negative.svg3.3%Steady2.svg0.1%
2016Increase2.svg419.8Increase2.svg56,903.2Increase2.svg320.9Increase2.svg43,488.2Increase2.svg2.2%Increase2.svg2.4%Increase Negative.svg3.4%Steady2.svg0.1%
2017Increase2.svg442.4Increase2.svg59,667.9Increase2.svg341.3Increase2.svg46,025.7Increase2.svg3.8%Increase2.svg1.5%Decrease Positive.svg3.1%Steady2.svg0.1%
2018Increase2.svg465.9Increase2.svg62,220.8Increase2.svg361.7Increase2.svg48,310.0Increase2.svg2.8%Increase2.svg2.4%Decrease Positive.svg2.8%Steady2.svg0.1%
2019Increase2.svg466.3Decrease2.svg61,999.4Increase2.svg363.1Decrease2.svg48,274.9Decrease2.svg-1.7%Increase2.svg2.9%Increase Negative.svg2.9%Increase Negative.svg0.3%
2020Decrease2.svg441.0Decrease2.svg59,380.4Decrease2.svg344.9Decrease2.svg46,443.6Decrease2.svg-6.5%Increase2.svg0.3%Increase Negative.svg5.8%Increase Negative.svg1.0%
2021Increase2.svg488.5Increase2.svg65,980.6Increase2.svg369.2Increase2.svg49,865.4Increase2.svg6.3%Increase2.svg1.6%Decrease Positive.svg5.2%Increase Negative.svg2.1%
2022Increase2.svg518.7Increase2.svg69,987.0Decrease2.svg368.4Decrease2.svg49,699.6Decrease2.svg-0.9%Increase2.svg1.9%Decrease Positive.svg4.5%Increase Negative.svg3.3%
2023Increase2.svg558.4Increase2.svg75,134.8Increase2.svg387.5Increase2.svg52,132.1Increase2.svg3.9%Increase2.svg2.4%Decrease Positive.svg4.0%Increase Negative.svg4.3%
2024Increase2.svg587.1Increase2.svg78,651.5Increase2.svg406.7Increase2.svg54,494.0Increase2.svg3.0%Increase2.svg2.5%Decrease Positive.svg3.7%Increase Negative.svg4.7%
2025Increase2.svg615.2Increase2.svg81,952.1Increase2.svg427.3Increase2.svg56,912.0Increase2.svg2.9%Increase2.svg2.5%Decrease Positive.svg3.4%Increase Negative.svg4.8%
2026Increase2.svg644.9Increase2.svg85,404.0Increase2.svg449.4Increase2.svg59,514.7Increase2.svg2.9%Increase2.svg2.5%Decrease Positive.svg3.1%Decrease Positive.svg4.7%
2027Increase2.svg675.8Increase2.svg88,978.9Increase2.svg471.0Increase2.svg62,015.3Increase2.svg2.8%Increase2.svg2.5%Decrease Positive.svg2.9%Increase Negative.svg5.4%

GDP

Source: [5]

Labour

Source: [5]

2022–2023 fiscal year budget

Sources: [51] [52]

Trade

Selective data in HK$ for Main Countries/Territories (2022)

Source: [5]

Trade with Macau

Location of Hong Kong and Macau China-Special Administrative Regions.png
Location of Hong Kong and Macau

As at 2015, Macau is Hong Kong's second largest export destination, occupying 6.1% of Hong Kong's total exports. [53] The amount of export totaled US$8.4B, with broadcasting equipment, jewelry, and precious metal watches as the major products. [54] On the other hand, Hong Kong is Macau's largest export destination. [55] Totaled USD 774M, with precious metal watches, jewelry, trunks and cases as the major trading products, the exports to the Hong Kong forms 53% of Macau's total exports. [56] Since 2018, Hong Kong and Macau have been connected via road by the Hong Kong–Zhuhai–Macau Bridge.

Poverty

The international poverty line is a monetary threshold under which an individual is considered to be living in poverty. This threshold is calculated using Purchasing Power Parity. [57] According to the World Bank, the international poverty line was most recently updated in October 2015, in which it was increased from $1.25 per day to $1.90 per day using the value of 2011 dollars. [58] Raising this threshold helps account for changes in costs of living, which directly effects individuals ability to obtain basic necessities across countries.

Recent figures show that 1.37 million people are living below the poverty line and struggling to survive on HK$4,000 (US$510) per month for a one-person household, HK$9,800 for a two-person household earning, and HK$15,000 or a three-person household. [59] The poverty rate in Hong Kong hit a high of 20.1%, but recent efforts by government programs have lowered this number to 14.7%. [60]

In December 2012, the Commission on Poverty (CoP) was reinstated to prevent and alleviate poverty with three primary functions; analyze the poverty situation, assist policy formulation and to assess policy effectiveness. Cash handouts have been credited with alleviating much of the poverty, but the extent in which poverty has been alleviated is still questionable. Although cash handouts raise households above the poverty line, they are still struggling to meet certain standards as the cost of living in Hong Kong steadily increases.

Coupled with these cash payments, statutory minimum wage is set to increase for a second time in the past 10 years. Statutory Minimum Wage (SMW) came into existence on 1 May 2011 and the SMW rate has been HK$34.5 per hour since May 2017. The Legislative Council in Hong Kong most recently approved the revision on the SMW rate to increase to HK$37.5 per hour, effective 1 May 2019. [61] Although the total statistics for Hong Kong show declining poverty, child poverty increased .3 percentage points from 2017 to 2018, up to a total of 23.1%, as a result of larger households due to children staying with their elderly parents. [62] With economic growth projected to slow in the coming years, poverty becomes an increasingly pressing issue. [62]

Beyond benefiting the younger generation through cash handouts and minimum wage increases, expanded elderly allowances have been implemented to increase disposable incomes of the elderly population that can no longer work. As of 1 February 2019 the amount payable per month for eligible elderly population became HK$1,385 in an effort to raise households incomes living with elderly tenants. Although Hong Kong has become one of the largest growing cities in the world, much of the population is struggling to keep up with the rising costs of living.

One of the largest issues affecting low income families is the availability of affordable housing. Over the past decade, residential Hong Kong property prices have increased close to 242%, with growth finally starting to decelerate in 2019. [63] Considering housing is a basic necessity, prices have continuously increased while disposable incomes remain virtually unchanged. As the amount of affordable housing diminishes, it has become much harder for families to find homes in their home country. Public housing programs have been implemented by the government, but delayed construction and growing waitlists have not helped to the extent they planned for. Recent results from a Hong Kong think tank show that by 2022, the average citizen could wait up to 6 years for public housing. [64] Evidence shows that the availability of affordable housing has declined, forcing households to spend more on shelter and less on other necessities. These issues can lead to worse living conditions and imbalanced diets, both of which pose problems beyond just financial well-being.

Financial markets

Stock exchange

Hang Seng Index 2001 - 2022 Hang Seng Index.webp
Hang Seng Index 2001 - 2022

The Hong Kong Stock Exchange is the sixth largest in the world, with a market capitalisation of about US$3.732 trillion as of mid-2017. In 2006, the value of initial public offerings (IPO) conducted in Hong Kong was second highest in the world after London. [65] In 2009, Hong Kong raised 22 percent of IPO capital, becoming the largest centre of IPOs in the world. [66] The exchange is the world's 10th largest by turnover and third largest in China. [67] [ citation needed ]

Bond market

Hong Kong bonds
.mw-parser-output .legend{page-break-inside:avoid;break-inside:avoid-column}.mw-parser-output .legend-color{display:inline-block;min-width:1.25em;height:1.25em;line-height:1.25;margin:1px 0;text-align:center;border:1px solid black;background-color:transparent;color:black}.mw-parser-output .legend-text{}
15 year
10 year
2 year
1 year
6 month
3 month Hong Kong bonds.webp
Hong Kong bonds
  15 year
  10 year
  2 year
  1 year
  6 month
  3 month

Exchange rates

Current HKD exchange rates
From Google Finance: AUD CAD CHF CNY EUR GBP JPY USD TWD KRW INR
From Yahoo! Finance: AUD CAD CHF CNY EUR GBP JPY USD TWD KRW INR
From XE.com: AUD CAD CHF CNY EUR GBP JPY USD TWD KRW INR
From OANDA: AUD CAD CHF CNY EUR GBP JPY USD TWD KRW INR
USD / Hong Kong Dollar exchange rate USD to Hong Kong Dollar exchange rate.webp
Chinese Yuan / Hong Kong Dollar exchange rate Chinese Yuan to Hong Kong Dollar exchange rate.webp

See also

Related Research Articles

<span class="mw-page-title-main">Economy of Canada</span>

The economy of Canada is a highly developed mixed economy, with the world's tenth-largest economy as of 2023, and a nominal GDP of approximately US$2.117 trillion. Canada is one of the world's largest trading nations, with a highly globalized economy. In 2021, Canadian trade in goods and services reached $2.016 trillion. Canada's exports totalled over $637 billion, while its imported goods were worth over $631 billion, of which approximately $391 billion originated from the United States. In 2018, Canada had a trade deficit in goods of $22 billion and a trade deficit in services of $25 billion. The Toronto Stock Exchange is the tenth-largest stock exchange in the world by market capitalization, listing over 1,500 companies with a combined market capitalization of over US$3 trillion.

<span class="mw-page-title-main">Economy of Ecuador</span>

The economy of Ecuador is the eighth largest in Latin America and the 69th largest in the world by total GDP. Ecuador's economy is based on the export of oil, bananas, shrimp, gold, other primary agricultural products and money transfers from Ecuadorian emigrants employed abroad. In 2017, remittances constituted 2.7% of Ecuador's GDP. The total trade amounted to 42% of the Ecuador's GDP in 2017.

<span class="mw-page-title-main">Economy of Indonesia</span>

The economy of Indonesia is a mixed economy with dirigiste characteristics, and it is one of the emerging market economies in the world and the largest in Southeast Asia. As an upper-middle income country and member of the G20, Indonesia is classified as a newly industrialized country. Estimated at over 21 quadrillion rupiah in 2023, it is the 16th largest economy in the world by nominal GDP and the 7th largest in terms of GDP (PPP). Indonesia's internet economy reached US$77 billion in 2022, and is expected to cross the US$130 billion mark by 2025. Indonesia depends on the domestic market and government budget spending and its ownership of state-owned enterprises. The administration of prices of a range of basic goods also plays a significant role in Indonesia's market economy. However, since the 1990s, the majority of the economy has been controlled by individual Indonesians and foreign companies.

<span class="mw-page-title-main">Economy of Kazakhstan</span>

The economy of Kazakhstan is the largest in Central Asia in both absolute and per capita terms. In 2021, Kazakhstan attracted more than US$370 billion of foreign investments since becoming an independent republic after the collapse of the former Soviet Union.

<span class="mw-page-title-main">Economy of Macau</span>

The economy of Macau is a highly developed market economy. Macau's economy has remained one of the most open in the world since its handover to China in 1999. Apparel exports and gambling-related tourism are mainstays of the economy. Since Macau has little arable land and few natural resources, it depends on mainland China for most of its food, fresh water, and energy imports. Japan and Hong Kong are the main suppliers of raw materials and capital goods. Although Macau was hit hard by the 1997–98 Asian financial crisis and the early 2000s recession, its economy grew approximately 13.1% annually on average between 2001 and 2006. Macau is a full Member of the World Trade Organization. Public security has greatly improved after handover to the People's Republic of China. With the tax revenue from the profitable gambling industry, the Macau government is able to introduce the social welfare program of 15 years of free education to all Macau citizens. In 2015, Macau's economy saw a sharp decrease due to the reduced spending by visitors from Mainland China since the Anti-corruption campaign under Xi Jinping.

<span class="mw-page-title-main">Economy of Mauritius</span>

The economy of Mauritius is a mixed developing economy based on agriculture, exports, financial services, and tourism. Since the 1980s, the government of Mauritius has sought to diversify the country's economy beyond its dependence on just agriculture, particularly sugar production.

<span class="mw-page-title-main">Economy of Pakistan</span>

The economy of Pakistan is categorized as a developing economy. It ranks as the 24th-largest based on GDP using purchasing power parity (PPP) and the 46th largest in terms of nominal GDP. With a population of 241.5 million people as of 2023, Pakistan's position at per capita income ranks 161st by GDP (nominal) and 138th by GDP (PPP) according to the International Monetary Fund (IMF).

<span class="mw-page-title-main">Economy of the Republic of the Congo</span>

The economy of the Republic of the Congo is a mixture of subsistence hunting and agriculture, an industrial sector based largely on petroleum extraction and support services. Government spending is characterized by budget problems and overstaffing. Petroleum has supplanted forestry as the mainstay of the economy, providing a major share of government revenues and exports. Nowadays the Republic of the Congo is increasingly converting natural gas to electricity rather than burning it, greatly improving energy prospects.

<span class="mw-page-title-main">Economy of Senegal</span>

The economy of Senegal is driven by mining, construction, tourism, fishing and agriculture, which are the main sources of employment in rural areas, despite abundant natural resources in iron, zircon, gas, gold, phosphates, and numerous oil discoveries recently. Senegal's economy gains most of its foreign exchange from fish, phosphates, groundnuts, tourism, and services. As one of the dominant parts of the economy, the agricultural sector of Senegal is highly vulnerable to environmental conditions, such as variations in rainfall and climate change, and changes in world commodity prices.

<span class="mw-page-title-main">Economy of Thailand</span>

The economy of Thailand is dependent on exports, which accounted in 2021 for about 58 per cent of the country's gross domestic product (GDP). Thailand itself is a newly industrialized country, with a GDP of 17.367 trillion baht (US$495 billion) in 2022, the 9th largest economy in Asia. As of 2018, Thailand has an average inflation of 1.06% and an account surplus of 7.5% of the country's GDP. Its currency, the Thai Baht, ranked as the tenth most frequently used world payment currency in 2017.

<span class="mw-page-title-main">Economy of the Gambia</span>

The economy of the Gambia is heavily reliant on agriculture. The Gambia has no significant mineral or other natural resources, and has a limited agricultural base. About 75% of the population depends on crops and livestock for its livelihood. Small-scale manufacturing activity features the processing of peanuts, fish, and animal hides.

<span class="mw-page-title-main">Four Asian Tigers</span> Economies of South Korea, Taiwan, Singapore and Hong Kong

The Four Asian Tigers are the developed Asian economies of Hong Kong, Singapore, South Korea, and Taiwan. Between the early 1950s and 1990s, they underwent rapid industrialization and maintained exceptionally high growth rates of more than 7 percent a year.

<span class="mw-page-title-main">1997 Asian financial crisis</span> Financial crisis of many Asian countries during the second half of 1997

The 1997 Asian financial crisis was a period of financial crisis that gripped much of East and Southeast Asia during the late 1990s. The crisis began in Thailand in July 1997 before spreading to several other countries with a ripple effect, raising fears of a worldwide economic meltdown due to financial contagion. However, the recovery in 1998–1999 was rapid, and worries of a meltdown quickly subsided.

The Hong Kong dollar is the official currency of the Hong Kong Special Administrative Region. It is subdivided into 100 cents or 1000 mils. The Hong Kong Monetary Authority is the monetary authority of Hong Kong and the Hong Kong dollar.

<span class="mw-page-title-main">Economy of Asia</span>

The economy of Asia comprises about 4.7 billion people living in 50 different nations. Asia is the fastest growing economic region, as well as the largest continental economy by both GDP Nominal and PPP in the world. Moreover, Asia is the site of some of the world's longest modern economic booms.

<span class="mw-page-title-main">Economy of East Asia</span>

The economy of East Asia comprises 1.6 billion people living in six different countries and regions. The region includes several of the world's largest and most prosperous economies: Taiwan, Japan, South Korea, China, Hong Kong, and Macau. It is home to some of the most economically dynamic places in the world, being the site of some of the world's most extended modern economic booms, including the Taiwan miracle (1950–present) in Taiwan, Miracle on the Han River (1974–present) in South Korea, Japanese economic miracle (1950–1990) and the Chinese economic miracle (1983–2010) in China.

<span class="mw-page-title-main">Economy of China</span>

China has an upper middle income, developing, mixed, socialist market economy incorporating industrial policies and strategic five-year plans. It is the world's second largest economy by nominal GDP, behind the United States, and the world's largest economy since 2016 when measured by purchasing power parity (PPP). China accounted for 19% of the global economy in 2022 in PPP terms, and around 18% in nominal terms in 2022. The economy consists of public sector enterprises, state-owned enterprises (SOEs) and mixed-ownership enterprises, as well as a large domestic private sector and openness to foreign businesses in their system. Post-1978 economic reforms China's average GDP growth had been over 10% annually for over three decades, and in some years, growth exceeded 14% annually.

References

  1. "World Economic Outlook Database, April 2019". IMF.org. International Monetary Fund. Archived from the original on 21 December 2019. Retrieved 29 September 2019.
  2. "World Bank Country and Lending Groups". datahelpdesk.worldbank.org. World Bank. Archived from the original on 28 October 2019. Retrieved 29 September 2019.
  3. "Press Releases Detail". www.censtatd.gov.hk.
  4. 1 2 3 4 "Report for Selected Countries and Subjects: April 2024". imf.org. International Monetary Fund.
  5. 1 2 3 4 5 6 7 8 9 10 11 "List of All Statistical Products". Census and Statistics Department.
  6. 1 2 3 4 5 6 7 8 9 10 "The World Factbook". Central Intelligence Agency . Retrieved 25 January 2019.
  7. 1 2 "Human Development Report 2023/2024" (PDF). United Nations Development Programme. 13 March 2024. Archived (PDF) from the original on 13 March 2024. Retrieved 30 April 2024.
  8. "Labor force, total – Hong Kong SAR, China". data.worldbank.org. World Bank. Archived from the original on 14 August 2019. Retrieved 11 December 2019.
  9. "Employment to population ratio, 15+, total (%) (national estimate)". data.worldbank.org. World Bank. Archived from the original on 24 August 2019. Retrieved 24 August 2019.
  10. "Wages and Labor Income", www.censtatd.gov.hk
  11. "Income tax calculator Hong Kong", hk.talent.com
  12. "Sovereigns rating list". Standard & Poor's. Archived from the original on 28 September 2011. Retrieved 26 May 2011.
  13. 1 2 3 Rogers, Simon; Sedghi, Ami (15 April 2011). "How Fitch, Moody's and S&P rate each country's credit rating". The Guardian . London. Archived from the original on 1 August 2013. Retrieved 31 May 2011.
  14. "Hong Kong's Latest Foreign Currency Reserve Assets Figures Released". Hong Kong Monetary Authority. 11 April 2023. Archived from the original on 25 July 2023. Retrieved 25 July 2023.
  15. Mizuoka, Fujio (2018). Contrived Laissez-Faireism: The Politico-Economic Structure of British Colonialism in Hong Kong. Springer Publishing. p. 26. ISBN   978-3319697932. Archived from the original on 1 August 2020. Retrieved 1 June 2020.
  16. "The Profitability of the Banking Sector in Hong Kong" (PDF). Hkma.gov.hk. Archived (PDF) from the original on 14 June 2018. Retrieved 27 July 2018.
  17. Legal Tender Notes Issue Ordinance Archived 3 May 2015 at the Wayback Machine . Legislation.gov.hk (30 June 1997)
  18. "Monetary Stability" (PDF). Hkma.gov.hk. Archived from the original (PDF) on 5 June 2013. Retrieved 27 July 2018.
  19. "Triennial Central Bank Survey of Foreign Exchange and Derivatives Market Activity in April 2007" (PDF). Triennial Central Bank Survey 2007. Bank for International Settlements: 7. September 2007. Archived (PDF) from the original on 6 December 2017. Retrieved 5 September 2010.
  20. Gough, Neil; Sang-Hun, Choe (19 July 2012). "Asian Financial Regulators Examine Local Lending Rates". The New York Times . Archived from the original on 20 September 2017. Retrieved 5 March 2017.
  21. "The Hong Kong Association of Banks". Hkab.org.hk. Archived from the original on 17 September 2018. Retrieved 5 November 2012.
  22. Chiu, Peter (2003). "Hong Kong's Banking Industry Facing Keen Competition". China Perspectives. 2003 (2). doi: 10.4000/chinaperspectives.260 . Archived from the original on 14 May 2013. Retrieved 16 November 2012.
  23. WHub (2018). "Hong Kong Start Up Ecosystem Whitepaper". Archived from the original on 17 September 2018.
  24. "Economic Freedom of the World". Fraser Institute. 22 December 2016. Retrieved 28 December 2023.
  25. "Hong Kong's latest foreign currency reserve assets figures released". www.info.gov.hk.
  26. "Hong Kong". U.S. Department of State. Archived from the original on 4 June 2019. Retrieved 23 May 2019.
  27. "London retains financial services crown". Financial Times. Archived from the original on 10 December 2019. Retrieved 27 September 2013.
  28. "The Global Financial Centres Index 13" (PDF). Zyen.com. March 2013. Archived (PDF) from the original on 18 November 2017. Retrieved 27 July 2018.
  29. Rikkie Yeung (2008). Moving Millions: The Commercial Success and Political Controversies of Hong Kong's Railways. Hong Kong University Press. ISBN   978-962-209-963-0.
  30. "Nominal GDP list of countries. Data for the year 2010". World Economic Outlook Database, October 2022. International Monetary Fund . Retrieved 5 November 2022.
  31. "Gross domestic product (2009)" (PDF). The World Bank: World Development Indicators database. World Bank. 27 September 2010. Archived (PDF) from the original on 12 September 2009. Retrieved 5 October 2010.
  32. Field listing – GDP (official exchange rate) Archived 4 October 2008 at the Wayback Machine , The World Factbook
  33. "GDP growth (annual %)". World Bank. Archived from the original on 10 December 2019. Retrieved 11 June 2019.
  34. Hong Kong, China – Member information Archived 21 September 2012 at the Wayback Machine . WTO. Retrieved 1 November 2012.
  35. "World's Largest Stock Exchanges December 2017" . Retrieved 20 April 2020.
  36. Hong Kong Monetary Authority (30 December 2009). "A Structural Investigation into the Price and Wage Dynamics in Hong Kong" (PDF). Archived (PDF) from the original on 19 June 2013. Retrieved 5 November 2012.
  37. "Hong Kong Company Formation". Archived from the original on 25 August 2013. Retrieved 27 August 2013.
  38. "UNCTAD World Investment Report". UNCTAD. Archived from the original on 17 August 2013. Retrieved 27 August 2013.
  39. "2011 Results – Financial Secrecy Index". Archived from the original on 28 August 2013. Retrieved 12 August 2013.
  40. After Singapore, S. Korea and Taiwan
  41. "Global Information Technology Report 2016". World Economic Forum. Archived from the original on 17 September 2018. Retrieved 16 September 2018.
  42. Richardson, Harry W. Bae, Chang-Hee C. (2005) Globalization and Urban Development: Advances in Spatial Science ISBN   3-540-22362-2
  43. "The transformation of Hong Kong in five charts". Reuters. Retrieved 29 June 2023.
  44. Journal of Contemporary China (2000), 9(24) 291–308 "New Interventionism in the Making: interpreting state interventions in Hong Kong after the change of sovereignty" (PDF). Archived from the original (PDF) on 10 September 2008. Retrieved 12 December 2006.
  45. Geocities. "Doesn't Hong Kong show the potentials of 'free market' capitalism?". Archived from the original on 20 October 2009. Retrieved 9 October 2010.
  46. "Index of Economic Freedom". Heritage Foundation. Archived from the original on 20 June 2010. Retrieved 21 June 2010.
  47. "The World's Freest Economy Is Also Its Least-Affordable Housing Market". Bloomberg BusinessWeek. 21 January 2014. Archived from the original on 25 January 2014. Retrieved 28 January 2014.
  48. "2014 Index of Economic Freedom – Hong Kong". The Heritage Foundation. Archived from the original on 1 October 2018. Retrieved 16 September 2018.
  49. Feulner, Edwin J. (5 April 2021). "Hong Kong Is No Longer What It Was". The Heritage Foundation. Retrieved 12 September 2022.
  50. "Report for Selected Countries and Subjects".
  51. "The 2022–23 Budget – Government Revenue and Expenditure". budget.gov.hk.
  52. "Provisional financial results for the year ended March 31, 2022". www.info.gov.hk.
  53. Where does Hong Kong export to? (2015)
  54. What does Hong Kong export to Macao? (2015)
  55. Where does Macau export to? (2015)
  56. What does Macau export to Hong Kong? (2015)
  57. Kenton, Will. "International Poverty Line". Investopedia. Archived from the original on 18 April 2019. Retrieved 18 April 2019.
  58. "FAQs: Global Poverty Line Update". World Bank. Archived from the original on 18 April 2019. Retrieved 18 April 2019.
  59. "Record 1.37 million people living below poverty line in Hong Kong". South China Morning Post. 19 November 2018. Archived from the original on 18 April 2019. Retrieved 18 April 2019.
  60. "Analysis of poverty situation in Hong Kong in 2017 announced (with photo/video)". info.gov.hk. Archived from the original on 1 September 2019. Retrieved 18 April 2019.
  61. "Labour Department – Employee Rights and Benefits". labour.gov.hk. Archived from the original on 4 April 2019. Retrieved 18 April 2019.
  62. 1 2 "In Hong Kong, one in five are living in poverty". The Straits Times. 20 November 2018. Archived from the original on 18 April 2019. Retrieved 18 April 2019.
  63. "Investment Analysis of Hong Kong Real Estate Market". Global Property Guide. 6 March 2019. Archived from the original on 19 April 2019. Retrieved 18 April 2019.
  64. Chan, Holmes (18 April 2019). "By 2022, average Hongkonger could wait 6 years or more for public housing, think tank warns". Hong Kong Free Press HKFP. Retrieved 18 April 2019.
  65. Hong Kong surpasses New York in IPOs Archived 9 February 2009 at the Wayback Machine , International Herald Tribune, 25 December 2006. Retrieved 20 January 2007.
  66. "Hong Kong IPOs May Raise Record $48 Billion in 2010, E&Y Says". Bloomberg L.P. 21 December 2009. Archived from the original on 29 April 2011. Retrieved 6 March 2017.
  67. After Shenzhen and Shanghai