Overview


In 2018, gross electricity production in Italy reached 289.7 TWh, down 2.1% compared to 2017; [9] thermal power stations ensured 66.5% of production and renewable energies 33.5%: hydraulic 17.4%, solar 7.8%, wind 6.1% and geothermal 2.1% (note: this statistic includes biomass and waste in the thermal). [9] Net production was 279.8 TWh, including 2.3 TWh for pumping. [9]
| Gross production (TWh) | 1960 | 1970 | 1980 | 1990 | 2000 | 2010 | 2017 | 2018 | 2019 | 2020 | % 2020 | var. 2020/1990 |
|---|---|---|---|---|---|---|---|---|---|---|---|---|
| Fossil thermal | 8.0 | 70.2 | 133.3 | 178.2 | 217.8 | 218.9 | 187.0 | 170.5 | 173.1 | 160.5 | 57.0 % | -10 % |
| of which coal | nd | nd | nd | 35.8 | 30.5 | 44.4 | 35.1 | 31.0 | 21.3 | 13.1 | 4.6 % | -63 % |
| of which oil | nd | nd | nd | 102.7 | 85.9 | 21.7 | 11.5 | 11.0 | 10.2 | 9.8 | 3.5 % | -90 % |
| of which natural gas | nd | nd | nd | 39.7 | 101.4 | 152.7 | 140.3 | 128.5 | 141.7 | 137.6 | 48.9 % | +247 % |
| Nuclear thermal | 3.2 | 2.2 | ||||||||||
| Hydraulic | 46.1 | 41.3 | 47.5 | 35.1 | 50.9 | 54.4 | 38.0 | 50.5 | 48.2 | 48.6 | 17.3 % | +38 % |
| minus pumping | nd | -1.4 | -3.3 | -4.8 | -9.1 | -4.5 | nd | nd | nd | nd | nd | |
| Geothermal | 2.1 | 2.7 | 2.7 | 3.2 | 4.7 | 5.4 | 6.2 | 6.1 | 6.1 | 6.0 | 2.1 % | +87 % |
| Biomasse | 0.014 | 1.0 | 7.4 | 17.0 | 16.8 | 17.2 | 17.3 | 6.2 % | x1238 | |||
| Renewed waste | 0.04 | 0.4 | 2.0 | 2.4 | 2.4 | 2.4 | 2.4 | 0.8 % | +6,343 % | |||
| Wind | 0.002 | 0.56 | 9.1 | 17.7 | 17.7 | 20.2 | 18.7 | 6.6 % | ns | |||
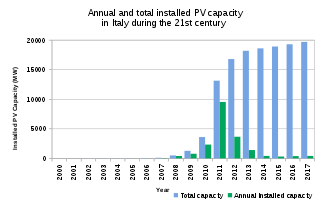
| Photovoltaic | 0.004 | 0.02 | 1.9 | 24.4 | 22.7 | 23.7 | 24.9 | 8.9 % | ns | |||
| Total renewable energies | 48.2 | 42.6 | 46.9 | 38.4 | 48.5 | 80.3 | 105.7 | 116.2 | 117.7 | 117.9 | 41.9 % | +207 % |
| Waste not renewed | 0.05 | 0.5 | 2.2 | 2.5 | 2.4 | 2.4 | 2.5 | 0.9 % | +4,619 % | |||
| Other Sources | 0 | 0.8 | 0.8 | 0.7 | 0.6 | 0.6 | 0.6 | 0.2 % | ns | |||
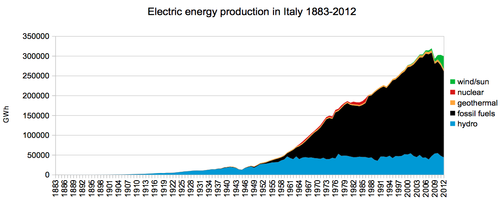
| Gross production [note 1] | 56.2 | 116.1 | 182.5 | 216.6 | 276.6 | 297.6 | 295.8 | 289.7 | 293.9 | 281.5 | 100 % | +30 % |
| Own consumption | 1.4 | 5.0 | 9.0 | 20.5 | 28.8 | 21.8 | 22.0 | 22.5 | 22.2 | 21.3 | 7.6 % | -1 % |
| Net production | 54.9 | 111.1 | 173.5 | 196.1 | 247.8 | 275.8 | 272.9 | 267.2 | 271.6 | 260.2 | 92.4 % | +33 % |
| Sources: Terna for the 1960s to 1980s; [10] International Energy Agency [11] for 1990-2020. | ||||||||||||
The Great Recession at the end of 2008 reduced demand for electricity by 5.7% in 2009. [12] The strong growth of renewable energies (+47% since 2010) has made it possible to reduce fossil fuel-based production by 27% between 2010 and 2020; the drop in demand caused by the Covid-19 pandemic in 2020 is however partly responsible for this decline in fossil fuels. [12]
| Gross power (MW) | 1960 | 1980 | 2000 | 2010 | 2015 | 2017 | 2018 | Var. 2018 2000 | Capacity factor 2018 (%)* |
|---|---|---|---|---|---|---|---|---|---|
| Classic thermal | 4,556 | 30,654 | 56,431 | 78,341 | 68,597 | 64,045 | 64,021 | +13.4 % | 34.4 % |
| Nuclear thermal | 1,471 | ||||||||
| Hydraulic | 11,468 | 15,904 | 20,658 | 21,893 | 22,560 | 22,838 | 22,911 | +10.9 % | 25.2 % |
| Geothermal | 287 | 440 | 627 | 772 | 821 | 813 | 813 | +30 % | 85.7 % |
| Wind + Photovoltaic | 370 | 9,406 | 28,063 | 29,448 | 30,372 | +8109 % | 15.4 % | ||
| Total power | 16,311 | 48,469 | 78,086 | 110,380 | 120,041 | 117,144 | 118,117 | +51 % | 28.1 % |
| * 2018 capacity factor: the calculation takes into account the staggering of commissioning. | |||||||||
Generating capacity in 2019 and production in 2020 was:
| Power Source | Generating Capacity (MW) (2019) [14] | Production (TWh) (2020) [15] |
|---|---|---|
| Hydroelectric | 22,541.1 | 46.2 |
| Thermal | 61,348.9 | 171,1 |
| Wind | 10,679.5 | 18.5 |
| Solar PV | 20,865.3 | 25.5 |
| Total | 116,434.8 | 283.1 |
In 2008 Italy consumed electricity in 6,054 kWh per capita, while the EU15 average was slightly higher 7,409 kWh per capita. In 2009 consumption was divided by power source: 13.5% import, 65.8% fossil electricity and 20.7% renewable electricity. [16]
| Use | Production | Import | Imp. % | Fossil | Nuclear | Other RE | Biomass | Wind | Non-RE use** | RE %*** | ||
|---|---|---|---|---|---|---|---|---|---|---|---|---|
| 2004 | 6,003 | 5,219 | 784 | 13.1% | 3,919 | 0 | 1,001 | 299 | 4,703 | 21.7% | ||
| 2005 | 6,029 | 5,189 | 841 | 13.9% | 4,200 | 0 | 884 | 105 | 5,040 | 16.4% | ||
| 2006 | 6,132 | 5,349 | 783 | 12.8% | 4,377 | 0 | 849 | 123 | 5,160 | 15.8% | ||
| 2008 | 6,054 | 5,384 | 671 | 11.1% | 4,271 | 0 | 992 | 120 | 4,942 | 18.4% | ||
| 2009 | 5,527 | 4,783 | 744 | 13.5% | 3,636 | 0 | 912* | 132 | 102* | 4,381 | 20.7% | |
| * Other RE includes waterpower, solar and geothermal electricity and wind power production until 2008 ** Non RE use = use – production of renewable electricity *** RE % = (production of RE / use) * 100% [note 2] | ||||||||||||