Graphs are unavailable due to technical issues. There is more info on Phabricator and on MediaWiki.org.
Foreign citizens immigrating to Norway annually, 1967-2019[1]
In 2017, Norway's immigrant population consisted of 883,751 people, making up 16.8% of the country's total population[2] (this includes both foreign-born and Norwegian-born with two foreign-born parents, and four foreign-born grandparents). Of this number, 724,987 are foreign-born, while 158,764 are Norwegian-born with foreign-born parents.[3] The ten most common countries of origin of immigrants residing in Norway are Poland (97,197), Lithuania (37,638), Sweden (36,315), Somalia (28,696), Germany (24,601), Iraq (22,493), Syria (20,823), Philippines (20,537), Pakistan (19,973) and Eritrea (19,957).[4] The immigrant population comprises people from a total of 221 countries and autonomous regions,[5] but 25% of the immigrants are from one of four migrant groups: Polish, Lithuanians, Swedes and Somalis.[6]
Immigration to Norway has increased over the last decades, beginning in the early 1990s. In 1992, the immigrant population in Norway was 183,000 individuals, representing 4.3% of the total population, and net migration that year was 9,105 people. In 2012, net migration peaked, as 48,714 people came to the country. Since 2013, net migration has decreased. In 2016, net migration was 27,778.[7]
Other historical fields linked to migrations were trade and academia, bringing workforce and innovation respectively. The Hanseatic League introduced large scale trade in Bergen and Northern Norway. Mining in Kongsberg, Røros and other places was made possible by immigrants from nearby countries. During the 19th century the evolution of dairies and the industrial exploitation of waterfalls depended on immigrants. Before the University was established in Christiania in 1811, almost all civil servants from up to circa 1500, were migrants.[9]
From the middle of the 20th century, the history of migration to Norway is characterized by four main phases.[5] The first wave of immigrants came during the 1960s, as a result of demand of labor within the secondary labor market. This group was mainly dominated by men from Pakistan and Turkey, who came to work in the oil sector. The shock of the 1973 Oil Crisis resulted in an immigration stop to Norway, which ended this first wave. The next wave came in the late 1970s, and consisted mostly of family members from former immigrants. The third wave of the mid 1980s was an increasing flow of asylum seekers mainly from Iran (Incl. Kurdistan province), Chile, Vietnam, Sri Lanka and the former Yugoslavia. From the beginning of the 21st century until today, Norwegian immigration has been characterized by a more liberal approach to labor immigration, as well as stricter policies towards asylum seekers.
Contemporary immigration
According to the Norwegian Immigration Act, all foreigners have to apply for permanent residency in order to live and work in Norway, except for citizens of Nordic countries.[10] There are four main reasons for immigration to Norway that are lawfully accepted – employment, education, protection and family reunification.[11] In 2016, most Norwegian immigrants came for family reunification (16,465 people), followed by protection (15,190), work (14,372) and education (4,147). Of the total number of 788,531 people who immigrated between 1990 and 2016, most immigrated for family reunification (283,478), followed by work (262,669), protection (156,590) and education (80,956).[11]
Norway is part of the European Economic Area (EEA) and the Schengen area. In 2017, 41.2% of the total immigrant population in Norway were from countries in the EU or EEA. 32.4% were from Asia including Turkey, and 13.7% were from Africa. The remaining 12.7% were from European countries not in the EU or EEA, North America, South America and Oceania.[12]
In 1999, the Norwegian Directorate of Immigration (Norwegian: Utlendingsdirektoratet, UDI) started to use blood testing on Somalis who applied for family reunification with parents. The tests showed that 1 out of 4 lied about the family ties. The tests were later changed to DNA tests to verify family ties.[13] The leader of a Somali community organization in Norway and the Norwegian Medical Association protested the tests and wished they would be discontinued.[13] In 2010, UDI started DNA-tests on Somali childless couples who applied for family reunification where one spouse already resided in Norway. The results showed that 40% of such pairs were siblings. As the tests became widely known, the ratio dropped to 25% and the tests were widened to migrants from other regions.[14]
By September 2019, 15 foreign residents who had travelled from Norway to Syria or Iraq to join the Islamic State had their residence permits revoked.[15]
Refugees in Norway
One cause of immigration in the 20th and 21st century is the need for protection in a new country, due to wars, riots, or political persecution in the migrants' home countries. In the 1950s, refugees came from Hungary to Norway, and in the 1970s from Chile and Vietnam.[5] In the mid-1980s, there was an increase in the number of asylum seekers from countries such as Iran (Incl. Kurdistan province) and Sri Lanka. In the 1990s, war refugees from the Balkans were the predominant immigrant group accepted into Norway; a large number of whom have since returned home to the Balkans. Since the end of the 1990s, new groups of asylum seekers from countries such as Iraq, Somalia, and Afghanistan have arrived in Norway.[citation needed]
The Dublin Regulation in 2001 states that non-European refugees applying for asylum in a Dublin country, will only get their application processed once, in the country where they first apply for asylum.[16]
During the European migrant crisis in 2015, a total of 31,145 asylum seekers crossed the Norwegian border in 2015.[17] The number had not been as high since the Balkan wars in 1990s. Most of the asylum seekers came from Afghanistan and Syria. In 2016, the number was dramatically reduced by almost 90%. In 2016, 3460 asylum seekers came to Norway. This was partly due to the stricter border control in Europe.[18] The EU-Turkey agreement, implemented 20 March 2016, was made in order strengthen organized channels of immigration to Europe, and prevent irregular migration from Turkey to the EU.[19]
Norway has also accepted refugees from other EU countries, In 2020 it granted asylum to anti-racism activist Rafał Gaweł from Poland, who was facing political persecution in his home country.[20]
In April 2016, Reuters reported that in the past year, Norway admitted 10 married children (children under 16 years of age). Four had children of their own. The Norwegian Directorate of Immigration (UDI) stated that "some" of the married children in Norway live "with their partners." The head of the PLAN charity stated: "If the girl is aged under 16, the minimum age for sexual intercourse in Norway, the child bride refugee should be separated from her husband even if they have children together."[21]
As of 2014, an official study showed that 4,081,000 people or 79.9% of the total population were Norwegians having no migrant background (both of their parents were born in Norway)[22] and more than 759,000 individuals (14.9%)[22] were immigrants—or descendants of recent immigrants—from neighbouring countries and the rest of the world. A further 235,000 (4.6%) were born in Norway to one foreign-born parent, and 34,000 (0.7%) were born abroad to one parent born in Norway.
In 2012, of the total 710,465 with immigrant background, 407,262 had Norwegian citizenship (60.2 percent).[23] Of these 13,2%, 335,000 (51%)[22] had a Western background mostly from Poland, Germany, and Sweden. 325,000 (49%)[22] had a non-Western background mostly from Turkey, Morocco, Iraq, Somalia, Pakistan and Iran (Incl. Kurdistan province).[24][25] Immigrants were represented in all Norwegian municipalities. The cities or municipalities with the highest share of immigrants in 2012 were Oslo (30.4 percent), Drammen (25 percent), Lørenskog (23 per cent) and Skien (19.6 percent).[2] According to Reuters, Oslo is the "fastest growing city in Europe because of increased immigration".[26] In recent years, immigration has accounted for most of Norway's population growth.
In 2010, the immigrant community grew by 57,000, which accounted for 90% of Norway's population growth; some 2% of newborn children were of immigrant background (two foreign parents). These statistics indicate that Norway's population is now 87.8% ethnic Norwegian, a figure that has steadily decreased since the late 20th century. Some 12.2% of the population is of solely immigrant background, while 5.7% of the population is of mixed Norwegian-foreign ancestry. People of other European ethnicity are 5.8% of the total, while Asians (including Pakistanis, and Iraqis) are 4.3%, Africans 1.5%, and others 0.6%.[27]
Immigrants and Norwegian-born to immigrant parents
Norwegian-born to immigrant parents in per cent of total population
Total
877 227
213 810
16.0
3.9
Nordic countries except Norway, EU/EFTA, UK, USA, Canada, Australia, New Zealand
378 076
51 274
6.9
0.9
Europe except EU/EFTA and UK, Africa, Asia, America except USA and Canada, Oceania except Australia and New Zealand, polar regions
499 150
162 535
9.1
3.0
Nordic countries except Norway
69 251
7 320
1.3
0.1
EU/EFTA until 2004 except the Nordic countries
85 626
8 852
1.6
0.2
New EU countries after 2004
207 883
34 089
3.8
0.6
Europe except for EU/EFTA/UK
101 058
22 589
1.8
0.4
Australia and New Zealand
2 532
91
0.0
0.0
Asia
265 120
92 273
4.8
1.7
Africa
105 817
43 685
1.9
0.8
America except USA og Canada
27 073
3 985
0.5
0.1
USA and Canada
12 784
922
0.2
0.0
Oceania except Australia and New Zealand
82
3
0.0
0.0
Education
Educational attainment of migrants in Norway in 2018
On average immigrants are well educated, with 16% having completed over four years of higher education as of 2018, compared to 10% for the whole population.[32] However, education levels vary a lot between different groups of migrants.
Social welfare
In 2017, 56% of all state social welfare was paid to immigrants. 86% of which was paid to immigrants from Asia or Africa. The third largest group was immigrants from non-EU Eastern European countries at 6%.[33]
Immigration has altered the religious demography of Norway. Among the immigrants, 250,030 have background from predominantly Christian countries, 119,662 from predominantly Muslim countries, 28,942 from mostly Buddhist countries, and 7,224 from countries that are predominantly Hindu.[34] The proportion of Muslim immigrants has fallen drastically in recent years, from about 80% in 2000 to less than 20% in 2007.[35]
As of 2008 there were living in Norway somewhere between 120,000 and 163,000 persons who had either immigrated from or who had parents who had immigrated from countries where Islam is the predominant religion, accounting for up to 3.4% of the country's total population.[35][36] This number should interpreted with caution according to a report by Statistics Norway, as there are significant religious minorities in several of these countries, and varying degrees of commitment to the religion. In the same year, 84,000 persons were members of an Islamic congregation.[35] The largest single denomination besides the state church is the Roman Catholic Church, which had a membership of more than 54,000 in 2008. It gained about 10,000 new members, mostly Poles, in the period 2004–2008.[35] Other religions which have increased mainly as a result of recent post-war immigration (with percentages of adherents in parentheses), include Hinduism (0.5%), Buddhism (0.4%), Eastern Orthodoxy and Oriental Orthodoxy (0.2%) and the Bahá'í Faith (<0.1%).
Employment
Statistics Norway has been criticized in 2018 for misrepresenting employment levels for African and Asian immigrants due to employment was counted from 1 weekly hour of work. Counting full-time employment as 30 hours of work per week, the figures were significantly lower. While official figures show that 35.2% of Pakistani female immigrants are employed, only 20% are in full-time employment.[37]
Employment rates of the 20 most common migrant groups in Norway, aged 20–66[38]
Immigrant employment rates are generally higher in Norway than overall employment rates in most countries [citation needed], the overall unemployment rate among immigrants being 6.5% in May 2011, totalling about 20,000 persons. The unemployment rate in the population as a whole was 2.7% at this time. There are differences between immigrant groups. People with African backgrounds have the highest unemployment rates, with 12.4%. Unemployment rates among immigrants from Asia and Eastern Europe were 8.2% and 7.4%, respectively. Persons born in Norway to immigrant parents, still a young and relatively small demographic, had an unemployment rate of 5.0%, totalling 766 persons. This was 1.6 percentage points above persons with Norwegian-born parents in the same age group, and 2.1 percentage points below immigrants in the same age group.[40]
Workforce participation
Overall workforce participation in the immigrant population was 61.6% in 2010,[40] compared to 71.9% for the population as a whole.[41]African immigrants had the lowest workforce participation, with 43.9%. Persons born to immigrant parents had a workforce participation of 53.0%, similar to that of the corresponding age demographic with Norwegian-born parents.[40]
Health
Immigrants from low income countries in Africa and Asia constitute a large proportion of those diagnosed with chronic infectious diseases Tuberculosis, HIV and Hepatitis B. Those who fall ill are often infected in their country of origin and are only diagnosed as they arrive in Norway, or they are infected during later visits to the home country of their family. In addition, these immigrants are less likely than Norwegian travellers to take travel vaccines against malaria, as they are unaware that after a couple of years in Norway they lose the immunity they had in their home country. Immigrants also socialize more with other immigrants and are therefore at greater risk of being infected while in Norway.[42]
In 2016 there were 298 reported cases of tuberculosis; of these, about 90% were people born outside Norway.[42]
In the 2013-2017 period people born outside Norway represented 60% of the about 225 annual cases of HIV infections and 96% of the 675 annual cases of chronic Heptatitis B.[42]
Effects of immigration
Demographic
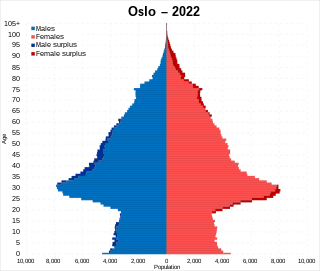
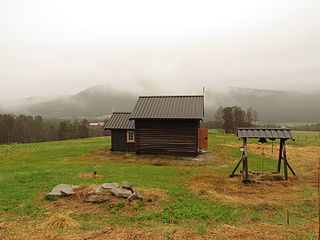
Norwegian and foreign born population pyramid in 2023Youths in Oslo
From 1977 to 2012, the number of non-Norwegian citizens living in Norway of European descent has increased from around 46,000 to around 280,000. In the same period the number of citizens of nations on other continents increased from about 25,000 to about 127,000, of which 112,230 from Middle East, Asia, Africa and South America.[43] If people with two immigrant parents are counted, the total immigrant population has risen from 57,041 in 1970 to 710 465 in 2012, the non-European proportion rose from 20.1% to 46.1%. The proportion of women in the immigrant population shifted from 56.1% in 1970 to 48.0% in 2012.[44] According to a book chapter published by Amsterdam University in 2008 and authored by Prof. Mete Feridun of University of Greenwich, immigration has a positive impact on economic growth in Norway and it has no statistically significant impact on unemployment in the job market.[45]
Bar chart showing number of perpetrators aged 15 and older per 1000 residents per foreign-born population for the years 2010–2013, according to Statistics Norway.
According to an analysis of 1998–2002 crime statistics, non-Western immigrants were overrepresented for violent crime, economic crime and traffic violations.[47]
According to a 2017 study by Statistics Norway, crime rates of immigrants varied with the reason for immigration. Three groups were overrepresented: refugees had the highest crime rate at 108.8 per 1000 population, family reunification immigrants were overrepresented at 66.9 per 1000 and labour migrants were overrepresented at 61.8 per 1000 population. Foreign residents who arrived to study were strongly underrepresented with 19.7 perpetrators per 1000.[46]
The overall probability that a person living in Norway would be convicted for a felony (Norwegian: forbrytelse) was increased by about 0.5 percentage points for the immigrant compared to non-immigrant populations for felonies committed in the years 2001–2004. The incidence was especially high among immigrants from Kosovo, Morocco, Somalia, Iraq, Iran (Incl. Kurdistan province) and Chile, and reached more than 2% in all these groups. In comparison, the incidence in the non-immigrant population was about 0.7%. Incidence was lower than for the non-immigrant population among immigrants from among others, Western European countries, Eastern Europe except Poland, the Balkans and Russia, the Philippines, China and North America. Incidence was also higher for persons with two immigrant parents for all countries of origin, including Nordic and Western European countries. When the data was corrected for the population group's age and gender structure (the most over-represented immigrant groups also have a considerable over-representation of young men), place of residence (rural–central) and employment situation, the over-representation was found to be significantly lower, especially for those groups which had the highest incidence in the uncorrected statistics. For some groups, among them immigrants from Bosnia-Herzegovina, Poland, Russia and the other Eastern European countries, the corrected incidences did not differ significantly from the non-immigrant population.[47]
According to data released by the European Council, 341 out of the year 2000 prison inmate population of 2643 were foreign nationals, a share of 12.9%. In the year 2010 foreign nationals represented 1129 out of a 3636 total, a 31.1% share. These figures were corroborated by officials of the Norwegian Correctional Service which stated the rising trend escalated when 8 countries joined the Schengen Area in 2007.[48] In order to decrease costs for interpreters and other special needs of foreign inmates, foreign nationals serving sentences involving subsequent deportation were in 2012 incarcerated in an institution holding only foreigners as they are not intended to be re-integrated into Norwegian society.[49] This institution opened in December 2012 in Kongsvinger.[50]
In September 2016 Norwegian authorities discovered that more than a million identity papers had been issued without stringent checks which enabled fraudsters to claim social welfare benefits of many persons simultaneously.[51]
Graphs are unavailable due to technical issues. There is more info on Phabricator and on MediaWiki.org.
In 2017, a Statistics Norway (SSB) report on crime in Norway was ordered by the immigration minister Sylvi Listhaug.[53] SSB limited the scope of the paper to figures for individual nations from which at least 4,000 immigrants lived in Norway as of 1 January 2010.[54] In the 2010–2013 period, the proportion of foreign-born perpetrators of criminal offences aged 15 and older per 1000 residents in Norway was found to be highest among immigrants from South and Central America (164.0), Africa (153.8), and Asia including Turkey (117.4), and lowest among immigrants from Eastern Europe (98.4), other Nordic countries (69.1), and Western Europe outside the Nordic region (50.7). This was compared to averages of 44.9 among native Norwegians and 112.9 among Norway-born residents with parents of foreign origin.[55] Among individual countries of origin for which figures were provided, the estimated proportion of foreign-born perpetrators was highest among immigrants from Kosovo (131.48), Afghanistan (127.62), Iraq (125.29), Somalia (123.81), and Iran (108.60). Immigrants from Poland were the only over-represented population for which gender and age structure, employment and place of residence, could explain their over-representation.[46] The total number of perpetrators in the 2010–2013 period with Norwegian background was 154326 and 27985 with immigration background.[56]
Total persons sanctioned in Norway by principal type of offence, citizenship and year, 2011–2015 (click image to view).
According to Statistics Norway, as of 2015, a total of 260,868 persons residing in Norway incurred sanctions. Of these, most were citizens of countries in Europe (240,497 individuals), followed by Asia (2,899 individuals), Africa (2,469 individuals), the Americas (909 individuals), and Oceania (92 individuals). There were also 13,853 persons sanctioned who had unknown citizenship, and 149 persons sanctioned without citizenship. The five most common countries of origin of foreign citizens in Norway who incurred sanctions were Poland (7,952 individuals), Lithuania (4,227 individuals), Sweden (3,490 individuals), Romania (1,953 individuals) and Denmark (1,728 individuals).[57]
In 2007 was the first time when foreign perpetrators of partner murders were in the majority. While 13% of Norway's population are foreigners, they represent 47% of perpetrators who have murdered their partner.[58] The most prevalent countries of origin were: Iran, Afghanistan, Iraq, Somalia and Eritrea.[58]
In 2018, an investigation into court cases involving domestic violence against children showed that 47% of the cases involved parents who were both born abroad. According to a researcher at Norwegian Police University College the over-representation was due to cultural (honor culture) and legal differences in Norway and foreign countries.[59]
Fiscal effects
According to Statistics Norway, every non-Western immigrant mean net deficit of 4.1 million NOK for Norwegian authorities, where tax income are reduced by welfare payments. The 15400 non-Western immigrants who arrived in 2012 will then result in expenses of about 63 000 million NOK, half the sum the Norwegian government revenue from the oil fund.[60]
Immigrants from Africa and Asia generally contributed less to tax uptake of the Norwegian state, where immigrants from Africa aged 25–62 contributed 50 000 NOK annually, immigrants from Asia contributed 70 000 NOK annually and the general population 140 000 NOK annually.[61]
Of the immigrant population 7.5% received social benefits compared to the other population at 2.2% The share of immigrants from Somalia on social benefits was 38%, Syria 30%, Afghanistan 22% and Iraq 20%.[61]
According to calculations by Finansavisen, the cost of the average Somali to the state is 9 million NOK, assuming that the descendants are perfectly integrated into Norwegian society. Of non-Western immigrants, Tamils do best with a cost of 1 million NOK. Swedes who already have an education and migrate to Norway give a net addition to the state balance sheet. Neighbouring countries India and Pakistan have a significant difference in state expenses, whereas the average Indian lead to costs of 1.6 million NOK, the average Pakistani costs 5.1 million NOK.[62]
The Directorate of Immigration (UDI) is responsible for the administration of immigration into the country.[63] Before the UDI was established in 1988, several government organisations were involved in administering immigration.[64] Another body, Integrerings- og mangfoldsdirektoratet (IMDi) (Directorate of Integration and Diversity), "contribute[s] to equality in living conditions and diversity through employment, integration and participation".[65]
This section needs expansion. You can help by adding to it. (January 2011)
Immigrants and Norwegian-born to immigrant parents, by country of origin
"Immigration from countries outside the EEA must be strictly enforced to ensure a successful integration. It can not be accepted that fundamental Western values and human rights are set aside by cultures and attitudes that certain groups of immigrants bring with them to Norway."[68]
An extreme form of opposition to immigration in Norway were the attacks carried out by the terrorist Anders Behring Breivik on 22 July 2011. He killed 8 people by bombing government buildings in Oslo and massacred 69 young people at a youth summer camp held by the Labour Party. He blamed the party for the high level of Muslim immigration and accused it of "promoting multiculturalism".[69]
Demographic features of the population of Norway include population density, ethnicity, education level, health of the populace, economic status, religious affiliations and other aspects.
The population of Oslo is monitored by Statistics Norway. As of 2022, the population of Oslo sat at 702,543.
The Somali diaspora or Qurbajoogta refers to Somalis who were born in Greater Somalia and reside in areas of the world that they were not born in. The civil war in Somalia greatly increased the size of the Somali diaspora, as many Somalis moved from Greater Somalia primarily to Europe, North America, Southern Africa and Australia. There are also small Somali populations in other pockets of Europe and Asia. The UN estimates that in 2015, approximately 2 million people from Somalia were living outside of the country's borders.
Many languages are spoken, written and signed in Norway.
Norwegian Vietnamese or Vietnamese Norwegian refers to citizens or naturalized residents of Norway of partially and full Vietnamese descent.
Pakistani Norwegians are Norwegians of Pakistani descent, 65.23% of Pakistanis in Norway live in the capital Oslo. First-generation Pakistani Norwegians, who migrate from Pakistan, are distinguished from the mainstream in several demographic aspects, while second-generation Pakistani Norwegians, who are born in Norway, are well established in Norway and have gone on to become professionals and politicians.
Family reunification is a recognized reason for immigration in many countries because of the presence of one or more family members in a certain country, therefore, enables the rest of the divided family or only specific members of the family to emigrate to that country as well.
Iraqis in Norway make up approximately 33,924 people. They are mostly refugees from the Iran–Iraq War, the Saddam regime and in particular the Iraq War. Iraqis are the seventh-largest immigrant group in Norway after Poles, Lithuanians, Swedes, Syrians, Pakistanis and Somalis.
Immigration and crime refers to the relationship between criminal activity and the phenomenon of immigration. The academic literature and official statistics provide mixed findings for the relationship between immigration and crime. Research in the United States tends to suggest that immigration either has no impact on the crime rate or even that immigrants are less prone to crime. A meta-analysis of 51 studies from 1994–2014 on the relationship between immigration and crime in the United States found that, overall, the immigration-crime association is negative, but the relationship is very weak and there is significant variation in findings across studies. This is in line with a 2009 review of high-quality studies conducted in the United States that also found a negative relationship.
Immigration to Europe has a long history, but increased substantially after World War II. Western European countries, especially, saw high growth in immigration post 1945, and many European nations today have sizeable immigrant populations, both of European and non-European origin. In contemporary globalization, migrations to Europe have accelerated in speed and scale. Over the last decades, there has been an increase in negative attitudes towards immigration, and many studies have emphasized marked differences in the strength of anti-immigrant attitudes among European countries.
African immigration to Norway refers to immigrants to Norway from Africa. An estimated 150,000 people in Norway are either first or second generation immigrants from Africa. Most of these have a background as asylum seekers.
Crime in Norway is countered by Norway's law enforcement agencies.
Poles in Norway are citizens and residents of Norway who are of Polish descent. They are the biggest immigrant group in Norway.
Syrians in Norway are citizens and residents of Norway who are of Syrian descent. Most have arrived as asylum immigrants because of the Syrian civil war.
The Albanians in the Nordic countries refers to the Albanian migrants in Nordic countries such as Denmark, Faroe Islands, Finland, Norway and Sweden and their descendants.
Eritreans in Norway are citizens and residents of Norway who are of Eritrean descent. Most have a background as asylum seekers that have fled Isaias Afwerkis regime.
Somalis in Norway are citizens and residents of Norway who are of Somali descent. They are the biggest African migration group in Norway. 36.5% of Somalis in Norway live in the capital Oslo. Almost all Somali in Norway have come to Norway as refugees from the Somali Civil War. In 2016, Somalis were the largest non-European migrant group in Norway.
Ethiopians in Norway are citizens and residents of Norway who are of Ethiopian descent.
Moroccans in Norway are citizens and residents of Norway who are of Moroccan descent.
Russians in Norway are people born in Russia or whose parents were both born in Russia and who live in Norway.
1 2 3 Sandnes, Toril (2017). Innvandrere i Norge, 2017. Oslo-Kongsvinger: Statistics Norway. Archived from the original on 23 September 2018. Retrieved 23 September 2018.
↑ From Harald Finehair to Håkon Håkonsson eight out of ten known queens were princesses from neighbouring countries. Steinar Imsen. Våre dronninger(in Norwegian). Grøndahl og Dreyer. 1991. ISBN82-09-10678-3
↑ Text of the current Dublin RegulationArchived 8 December 2017 at the Wayback MachineRegulation (EU) No 604/2013 of the European Parliament and of the Council of 26 June 2013 establishing the criteria and mechanisms for determining the Member State responsible for examining an application for international protection lodged in one of the Member States by a third-country national or a stateless person
↑ Doyle, Alister (21 April 2016). "Child brides sometimes tolerated in Nordic asylum centers despite bans". Reuters (Oslo). Archived from the original on 23 April 2016. Retrieved 22 April 2016. 10 of those aged under 16 – the minimum local age for sex or marriage – were married and four had children, the Norwegian Directorate of Immigration (UDI) said [...] Of the 10 "some live in adult asylum centers, some in their own rooms and some with their partners," it said in emailed replies [...] "If the girl is aged under 16, the minimum age for sexual intercourse in Norway, the child bride refugee should be separated from her husband even if they have children together and even if they say they want to stay together," said Kjell Erik Oie, head of PLAN Norway.
↑ Investigating the Economic Impact of Immigration on the Host Country: The Case of Norway, in Kolb, Holger and Egbert, Henrik (Eds.), 46–55, Migrants and Markets: Perspectives from Economics and Other Social Sciences, Amsterdam University Press (2008).
↑ Synøve N. Andersen, Bjart Holtsmark & Sigmund B. Mohn. Kriminalitet blant innvandrere og norskfødte med innvandrerforeldre En analyse av registerdata for perioden 1992–2015. p.24. Archived from the original on 15 January 2018. Retrieved 23 December 2017. For å begrense rapportens omfang, og fordi det i alle befolkningsgrupper er en relativt lav andel som begår kriminalitet, og analyser av relativt små befolkningsgrupper derfor er lite hensiktsmessig, rapporterer vi tall for enkeltland dersom antall innvandrere fra landet var minst 4000 personer per 1.1.2010, jfr. Skarðhamar et al. (2011).
↑ Synøve N. Andersen, Bjart Holtsmark & Sigmund B. Mohn. Kriminalitet blant innvandrere og norskfødte med innvandrerforeldre En analyse av registerdata for perioden 1992–2015. p.38 (Tabell 3.6). Archived from the original on 15 January 2018. Retrieved 23 December 2017. Tabell 3.6 viser oss det totale antallet gjerningspersoner blant norskfødte med innvandrerforeldre, brutt ned etter foreldrenes landbakgrunn og innvandringsgrunn. Tallet i den øverste raden i tabellen kjenner vi igjen fra tidligere; det er 44,9 gjerningspersoner per 1000 bosatt i den øvrige befolkningen. Blant norskfødte med innvandrerforeldre er tallet 112,9.
Mete Feridun, Investigating the Economic Impact of Immigration on the Host Country: The Case of Norway, in Kolb, Holger and Egbert, Henrik (Eds.), 46–55, Migrants and Markets: Perspectives from Economics and Other Social Sciences, Amsterdam University Press (2008).
This page is based on this Wikipedia article Text is available under the CC BY-SA 4.0 license; additional terms may apply. Images, videos and audio are available under their respective licenses.