
The economy of Canada is a highly developed mixed economy, with the world's tenth-largest economy as of 2023, and a nominal GDP of approximately US$2.117 trillion. Canada is one of the world's largest trading nations, with a highly globalized economy. In 2021, Canadian trade in goods and services reached $2.016 trillion. Canada's exports totalled over $637 billion, while its imported goods were worth over $631 billion, of which approximately $391 billion originated from the United States. In 2018, Canada had a trade deficit in goods of $22 billion and a trade deficit in services of $25 billion. The Toronto Stock Exchange is the tenth-largest stock exchange in the world by market capitalization, listing over 1,500 companies with a combined market capitalization of over US$3 trillion.

The economy of the Czech Republic is a developed export-oriented social market economy based in services, manufacturing, and innovation that maintains a high-income welfare state and the European social model. The Czech Republic participates in the European Single Market as a member of the European Union, and is therefore a part of the economy of the European Union. It uses its own currency, the Czech koruna, instead of the euro. It is a member of the Organisation for Economic Co-operation and Development (OECD). The Czech Republic ranks 16th in inequality-adjusted human development and 24th in World Bank Human Capital Index, ahead of countries such as the United States, the United Kingdom or France. It was described by The Guardian as "one of Europe's most flourishing economies".

The economy of Ecuador is the eighth largest in Latin America and the 69th largest in the world by total GDP. Ecuador's economy is based on the export of oil, bananas, shrimp, gold, other primary agricultural products and money transfers from Ecuadorian emigrants employed abroad. In 2017, remittances constituted 2.7% of Ecuador's GDP. The total trade amounted to 42% of the Ecuador's GDP in 2017.

The economy of Ethiopia is a mixed and transition economy with a large public sector. The government of Ethiopia is in the process of privatizing many of the state-owned businesses and moving toward a market economy. The banking, telecommunication and transportation sectors of the economy are dominated by government-owned companies.

The economy of Indonesia is a mixed economy with dirigiste characteristics, and it is one of the emerging market economies in the world and the largest in Southeast Asia. As an upper-middle income country and member of the G20, Indonesia is classified as a newly industrialized country. Estimated at over 21 quadrillion rupiah in 2023, it is the 16th largest economy in the world by nominal GDP and the 7th largest in terms of GDP (PPP). Indonesia's internet economy reached US$77 billion in 2022, and is expected to cross the US$130 billion mark by 2025. Indonesia depends on the domestic market and government budget spending and its ownership of state-owned enterprises. The administration of prices of a range of basic goods also plays a significant role in Indonesia's market economy. However, since the 1990s, the majority of the economy has been controlled by individual Indonesians and foreign companies.

The economy of Kazakhstan is the largest in Central Asia in both absolute and per capita terms. In 2021, Kazakhstan attracted more than US$370 billion of foreign investments since becoming an independent republic after the collapse of the former Soviet Union.

The economy of Latvia is an open economy in Europe and is part of the European Single Market. Latvia is a member of the World Trade Organization (WTO) since 1999, a member of the European Union since 2004, a member of the Eurozone since 2014 and a member of the OECD since 2016. Latvia is ranked the 14th in the world by the Ease of Doing Business Index prepared by the World Bank Group. According to the Human Development Report 2011, Latvia belongs to the group of very high human development countries. Due to its geographical location, transit services are highly developed, along with timber and wood processing, agriculture and food products, and manufacturing of machinery and electronic devices.

The economy of the Philippines is an emerging market, and considered as a newly industrialized country in the Asia-Pacific region. In 2024, the Philippine economy is estimated to be at ₱26.55 trillion, making it the world's 32nd largest by nominal GDP and 13th largest in Asia according to the International Monetary Fund.
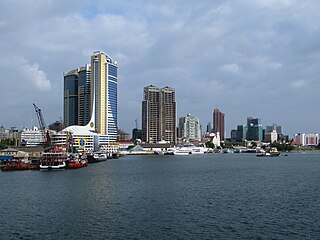
The economy of Tanzania is a lower-middle income economy that is overwhelmingly dependent on agriculture. Tanzania's economy has been transitioning from a planned economy to a market economy since 1985. Although total GDP has increased since these reforms began, GDP per capita dropped sharply at first, and only exceeded the pre-transition figure in around 2007.

The economy of Vietnam is a developing mixed socialist-oriented market economy. It is the 35th-largest economy in the world by nominal gross domestic product (GDP) and the 26th-largest economy in the world by purchasing power parity (PPP). It is a lower-middle income country with a low cost of living. Vietnam is a member of the Asia-Pacific Economic Cooperation, the Association of Southeast Asian Nations and the World Trade Organization.

Australia is a highly developed country with a mixed economy. As of 2023, Australia was the 14th-largest national economy by nominal GDP, the 19th-largest by PPP-adjusted GDP, and was the 21st-largest goods exporter and 24th-largest goods importer. Australia took the record for the longest run of uninterrupted GDP growth in the developed world with the March 2017 financial quarter. It was the 103rd quarter and the 26th year since the country had a technical recession. As of June 2021, the country's GDP was estimated at $1.98 trillion.

The economy of Austria is a highly developed social market economy, with the country being one of the fourteen richest in the world in terms of GDP per capita. Until the 1980s, many of Austria's largest industry firms were nationalised. In recent years, privatisation has reduced state holdings to a level comparable to other European economies.

The economy of Bahrain is heavily dependent upon oil and gas. The Bahraini Dinar is the second-highest-valued currency unit in the world. Since the late 20th century, Bahrain has heavily invested in the banking and tourism sectors. The country's capital, Manama is home to many large financial structures. Bahrain's finance industry is very successful. In 2008, Bahrain was named the world's fastest growing financial center by the City of London's Global Financial Centres Index. Bahrain's banking and financial services sector, particularly Islamic banking, have benefited from the regional boom driven by demand for oil. Petroleum is Bahrain's most exported product, accounting for 60% of export receipts, 70% of government revenues, and 11% of GDP. Aluminium is the second most exported product, followed by finance and construction materials.

The world economy or global economy is the economy of all humans in the world, referring to the global economic system, which includes all economic activities conducted both within and between nations, including production, consumption, economic management, work in general, financial transactions and trade of goods and services. In some contexts, the two terms are distinct: the "international" or "global economy" is measured separately and distinguished from national economies, while the "world economy" is simply an aggregate of the separate countries' measurements. Beyond the minimum standard concerning value in production, use and exchange, the definitions, representations, models and valuations of the world economy vary widely. It is inseparable from the geography and ecology of planet Earth.

The economy of Africa consists of the trade, industry, agriculture, and human resources of the continent. As of 2019, approximately 1.3 billion people were living in 53 countries in Africa. Africa is a resource-rich continent. Recent growth has been due to growth in sales, commodities, services, and manufacturing. West Africa, East Africa, Central Africa and Southern Africa in particular, are expected to reach a combined GDP of $29 trillion by 2050.

The economy of Asia comprises about 4.7 billion people living in 50 different nations. Asia is the fastest growing economic region, as well as the largest continental economy by both GDP Nominal and PPP in the world. Moreover, Asia is the site of some of the world's longest modern economic booms.

The economy of North America comprises more than 596 million people in its 24 sovereign states and 15 dependent territories. It is marked by a sharp division between the predominantly English speaking countries of Canada and the United States, which are among the wealthiest and most developed nations in the world, and countries of Central America and the Caribbean in the former Latin America that are less developed. Mexico and Caribbean nations of the Commonwealth of Nations are between the economic extremes of the development of North America.

China has an upper middle income, developing, mixed, socialist market economy incorporating industrial policies and strategic five-year plans. It is the world's second largest economy by nominal GDP, behind the United States, and the world's largest economy since 2016 when measured by purchasing power parity (PPP). China accounted for 19% of the global economy in 2022 in PPP terms, and around 18% in nominal terms in 2022. The economy consists of public sector enterprises, state-owned enterprises (SOEs) and mixed-ownership enterprises, as well as a large domestic private sector and openness to foreign businesses in their system. Post-1978 economic reforms China's average GDP growth had been over 10% annually for over three decades, and in some years, growth exceeded 14% annually.

Foreign trade of the United States comprises the international imports and exports of the United States. The country is among the top three global importers and exporters.

The economy of Central America is the eleventh-largest economy in Latin America, behind Brazil, Mexico, Argentina and Colombia. According to the World Bank, the nominal GDP of Central America reached 204 billion US dollar in 2010, as recovery from the crisis of 2009, where gross domestic product (GDP) suffered a decline to 3.8%. The major economic sectors are agriculture and tourism, although the industrial sector has shown strong growth, mainly in Panama.