This article needs to be updated.(March 2020) |
The following are international rankings of China.
This article needs to be updated.(March 2020) |
The following are international rankings of China.
| Field | Rank | Date |
|---|---|---|
| Apple production , output of 37,001,601 tons | 1 | 2014 |
| Aquatic plants production , output of 11,163,675 tons | 1 | 2005 |
| Asparagus production , output of 5,906,000 tons | 1 | 2005 |
| Cabbage production , output of 33,400,000 tons | 1 | 2014 |
| Carrot and turnip production , output of 8,395,500 tons | 1 | 2005 |
| Cauliflowers and broccoli production , output of 9,300,000 tons | 1 | 2014 |
| Chestnut production , output of 900,000 tons | 1 | 2015 |
| Cotton production , output of 11,400,000 tons | 1 | 2005 |
| Cucumber and gherkin production, output of 26,000,000 tons | 1 | 2005 |
| Eggplant production , output of 32,000,000 tons | 1 | 2016 |
| Fish production , output of 49,467,275 tons | 1 | 2005 |
| Fruit and vegetable production , output of 506,634,000 tons | 1 | 2004 |
| Garlic production , output of 21,200,000 tons | 1 | 2016 |
| Honey production , output of 298,000 tons | 1 | 2005 |
| Livestock of domestic sheep , 163,500,000 heads | 1 | 2019 |
| Livestock of domestic pig , 474,100,000 heads | 1 | 2014 |
| Livestock of donkeys , 8,499,000 heads | 1 | 2003 |
| Livestock of horses , 8,088,000 heads | 1 | 2003 |
| Livestock of mules , 4,194,000 heads | 1 | 2003 |
| Lettuce and chicory production , output of 11,005,000 tons | 1 | 2005 |
| Mushroom and truffle production , output of 1,410,540 tons | 1 | 2005 |
| Onion and shallot production , output of 17,793,000 tons | 1 | 2005 |
| Peach and nectarine production , output of 6,030,000 tons | 1 | 2005 |
| Peanut production , output of 16,500,000 tons | 1 | 2014 |
| Pear and quince production , output of 11,537,000 tons | 1 | 2005 |
| Persimmon production , output of 1,987,000 tons | 1 | 2006 |
| Plum and sloe production , output of 4,635,500 tons | 1 | 2005 |
| Potato production , output of 95.5 million metric tons | 1 | 2014 |
| Rapeseed production , output of 15.3 million metric tons | 2 | 2016 |
| Rice production , output of 206,500,000 tons | 1 | 2014 |
| Silk production , output of 290,003 tons | 1 | 2005 |
| Spinach production , output of 11,011,000 tons | 1 | 2005 |
| Tangerine production , output of 14,152,000 tons | 1 | 2007 |
| Tea production , output of 2,400,000 million tons | 1 | 2016 |
| Tobacco production , output of 2,298,800 tons | 1 | 2000 |
| Tomato production , output of 52,600,000 tons | 1 | 2016 |
| Walnut production , output of 1,602,373 tons | 1 | 2014 |
| Watermelon production , output of 79,200,000 tons | 1 | 2016 |
| Wheat production , output of 126.2 million metric tons | 1 | 2014 |
| Field | Rank | Date |
|---|---|---|
| Connectivity Scorecard (Nokia Siemens) [1] | 17 | 2009 |
| E-readiness (Economist Intelligence Unit) [2] | 56 | 2008 |
| Internet hosts , 20,602,000 [3] | 5 | 2013 |
| Broadband - fixed subscriptions per 100 inhabitants, 27 [4] | 22 | 2017 |
| Internet users , 1,051,140,000 [5] | 1 | 2022 |
| Internet users - percent of population (%) , 73.7% [5] | 74 | 2022 |
| Main line phones , 269,910,000 [6] | 1 | 2011 |
| Mobile phone users , 1,321,930,000 [7] | 1 | 2016 |
| Telephones - mobile cellular , 1,100,000,000 [8] | 1 | 2012 |
| Networked Readiness Index (WEF) [9] | 57 | 2008 |
| Space Competitiveness Index (Futron) [10] | 5 | 2012 |
| Field | Rank | Date |
|---|---|---|
| Car market, 13.64 million vehicles [11] | 1 | 2009 |
| Rice consumption , 156.3 million metric tons per year | 1 | 2009 |
| Field | Rank | Date |
|---|---|---|
| Human Development Index , 0.768 [12] | 79 | 2021 |
| Labour force , 781,731,676 [13] | 1 | 2022 |
| Life expectancy at birth - total, 77.1 [14] years | 70 | 2020 |
| Life expectancy at birth - female, 79.4 [15] years | 76 | 2020 |
| Life expectancy at birth - male, 75.0 [15] years | 62 | 2020 |
| Median age years, 39.8 [16] years | 62 | 2023 |
| Population , 1,409,670,000 people [17] | 2 | 2023 |
| Field | Rank | Date |
|---|---|---|
| GDP (nominal) | 2 | 2023 |
| GDP (nominal) per capita | 64 | 2023 |
| GDP (PPP) | 1 | 2023 |
| GDP (PPP) per capita | 73 | 2023 |
| GDP growth rate , 5.2% | 30 | 2023 |
| Exports , $3,593,601,000,000 | 1 | 2022 |
| Imports , $2,715,999,000,000 | 2 | 2022 |
| Current account balance , $162,500,000,000 | 3 | 2017 |
| Forex reserves , $3,400,780,000,000 | 1 | 2023 |
| Global Competitiveness Index , 73.9 | 28 | 2019 |
| Index of Economic Freedom , 48.0 | 158 | 2023 |
| Where-to-be-born Index , 5.99 | 49 | 2013 |
| Unemployment rate , 4.1% | 32 | 2013 |
| Gold reserves , 1842.6 metric tons | 6 | 2018 |
| Field | Rank | Date |
|---|---|---|
| Carbon dioxide emissions , 12,667,428,400 metric tons [18] | 1 | 2022 |
| Carbon dioxide emissions per capita , 8.85 metric tons per capita [18] | 26 | 2022 |
| Environmental Performance Index | 160 | 2022 |
| Hydroelectricity production , 1,303.1 TW•h per year | 1 | 2022 |
| Renewable energy production , 2,444.5 TW•h per year | 1 | 2021 |
| Field | Rank | Date |
|---|---|---|
| Countries bordered , 14 | 1 | 2023 |
| Land area | 2 | 2023 |
| Land border length , 22,117 km | 1 | 2023 |
| Total area | 4 | 2023 |
| Field | Rank | Date |
|---|---|---|
| Index of Globalization (KOF) [19] | 72 | 2014 |
| Field | Rank | Date |
|---|---|---|
| Aluminium production , 36,000,000 tons | 1 | 2019 |
| Antimony production , 100,000 tons | 1 | 2016 |
| Arsenic production , 25,000 tons | 1 | 2014 |
| Bismuth production , 7,500 tons | 1 | 2015 |
| Cadmium production , 3,000 tons | 1 | 2005 |
| Cement production , 2,500,000,000 tons | 1 | 2014 |
| Coal production , 3,411.0 million tons | 1 | 2016 |
| Fluorite production , 3,000,000 tons | 1 | 2006 |
| Gold production , 455 tonnes [20] | 1 | 2016 |
| Iron production , 375,000,000 tons | 3 | 2015 |
| Manganese production , 3,000,000 tons | 2 | 2015 |
| Mercury production , 1,150 tons | 1 | 2005 |
| Mica production , 89,000 tons | 1 | 2005 |
| Motor vehicle production , 29,015,434 vehicles [21] | 1 | 2017 |
| Shipbuilding , 25,160,000 GT | 1 | 2015 |
| Solar panel production [22] | 1 | 2009 |
| Steel production , 831,700,000 tons | 1 | 2017 |
| Strontium production , 700,000 tons | 1 | 2005 |
| Tin production , 120,000 tons | 1 | 2005 |
| Tin reserves , 1,500,000 tons | 1 | 2011 |
| Tungsten production , 46,900 tons | 1 | 2005 |
| Wind turbine production [22] | 1 | 2009 |
| Zinc production , 3,100,000 tons | 1 | 2009 |
| Field | Rank | Date |
|---|---|---|
| Active troops , 2.183 million troops [23] | 1 | 2010 |
| Defense spending , $292 billion [24] | 2 | 2022 |
| Frigates in operation , 50 | 1 | 2015 |
| Police forces , 2,000,000 officers [25] | 1 | 2018 |
| Organization | Survey | Year | Place | Out of | Value | Ref |
|---|---|---|---|---|---|---|
| Transparency International | Corruption Perceptions Index | 2023 | 76 | 180 | Score: 42 | [26] |
| The Economist Intelligence Unit | Democracy Index | 2023 | 148 | 167 | Overall score: 2.12 (Authoritarian) | [27] |
| Institute for Economics and Peace | Global Peace Index | 2023 | 80 | 163 | GPI score: 2.009 | [28] |
| Global Terrorism Index | 2024 | 73 | 163 | Very low impact of terrorism in 2024 | [29] | |
| Reporters Without Borders | Press Freedom Index | 2024 | 172 | 180 | Score: 23.36 (Very serious situation) | [30] [31] |
| Freedom House | Freedom in the World | 2023 | 173 | 195 | Score: 9 (Not free) | [32] |
| Freedom of the Press | 2017 | 187 | 199 | Score: 87 (Not free) | [33] [34] | |
| Organization | Survey | Year | Place | Out of | Value | Ref |
|---|---|---|---|---|---|---|
| World Economic Forum | Gender Gap Index | 2023 | 107 | 146 | Score: 0.678 | [35] |
| Save the Children | State of the World's Mothers | 2015 | 61 | 179 | [36] | |
| World Health Organization | Suicide rate | 2019 | 122 | 183 | Rate: 6.7 per 100,000 | [37] |
| Field | Rank | Date |
|---|---|---|
| Women's badminton Uber Cup , 14 wins | 1 | 2018 |
| World Badminton Championships , 63 gold medals won | 1 | 2018 |
| World Amateur Go Championship , 18 wins | 1 | 2009 |
| World Table Tennis Championships , 35 team wins | 1 | 2009 |
| World Weightlifting Championships (women), 314 gold medals, 423 total medals | 1 | 2007 |
| Field | Rank | Date |
|---|---|---|
| Total length of high-speed railways , 25,000 km | 1 | 2018 |
| Total length of waterways , 126,300 km | 1 | 2014 |
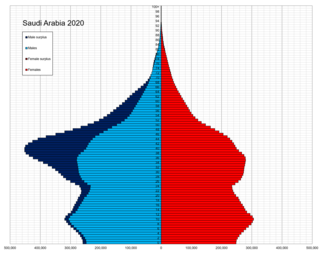
Saudi Arabia is the fourth largest state in the Arab world, with a reported population of 32,175,224 as of 2022. 41.6% of inhabitants are immigrants. Saudi Arabia has experienced a population explosion in the last 40 years, and continues to grow at a rate of 1.62% per year.
The economy of Tunisia is in the process of being liberalized after decades of heavy state direction and participation in the country's economy. Prudent economic and fiscal planning has resulted in moderate but sustained growth for over a decade. Tunisia's economic growth historically has depended on oil, phosphates, agri-food products, car parts manufacturing, and tourism. In the World Economic Forum Global Competitiveness Report for 2015–2016, Tunisia ranks in 92nd place.

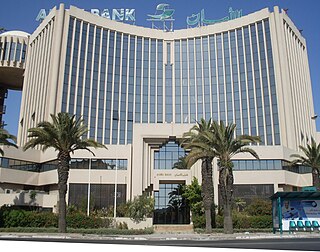
The economy of Bahrain is heavily dependent upon oil and gas. The Bahraini Dinar is the second-highest-valued currency unit in the world. Since the late 20th century, Bahrain has heavily invested in the banking and tourism sectors. The country's capital, Manama is home to many large financial structures. Bahrain's finance industry is very successful. In 2008, Bahrain was named the world's fastest growing financial center by the City of London's Global Financial Centres Index. Bahrain's banking and financial services sector, particularly Islamic banking, have benefited from the regional boom driven by demand for oil. Petroleum is Bahrain's most exported product, accounting for 60% of export receipts, 70% of government revenues, and 11% of GDP. Aluminium is the second most exported product, followed by finance and construction materials.
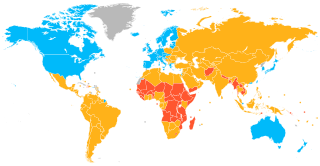
A developed country, or high-income country, is a sovereign state that has a high quality of life, developed economy, and advanced technological infrastructure relative to other less industrialized nations. Most commonly, the criteria for evaluating the degree of economic development are the gross domestic product (GDP), gross national product (GNP), the per capita income, level of industrialization, amount of widespread infrastructure and general standard of living. Which criteria are to be used and which countries can be classified as being developed are subjects of debate. Different definitions of developed countries are provided by the International Monetary Fund and the World Bank; moreover, HDI ranking is used to reflect the composite index of life expectancy, education, and income per capita. Another commonly used measure of a developed country is the threshold of GDP (PPP) per capita of at least US$22,000. In 2023, 40 countries fit all four criteria, while an additional 15 countries fit three out of four.
The following are links to some international rankings of the United States.
The following are international rankings of Japan.
The following are the international rankings of Taiwan.
These are the international rankings of Pakistan.
The following is a list of international rankings of Greece.
The following are international rankings of Afghanistan.
The following are international rankings of Vietnam.
The following are international rankings of the Philippines.
The following are international rankings of Cuba.
This is a list of international rankings of Colombia.
The following is a list of international rankings of Belarus.
The following are international rankings of Iceland.
The following are international rankings of Sri Lanka.
{{cite book}}: |website= ignored (help)