Measurement invariance

Last updated

Measurement invariance or measurement equivalence is a statistical property of measurement that indicates that the same construct is being measured across some specified groups. [1] For example, measurement invariance can be used to study whether a given measure is interpreted in a conceptually similar manner by respondents representing different genders or cultural backgrounds. Violations of measurement invariance may preclude meaningful interpretation of measurement data. Tests of measurement invariance are increasingly used in fields such as psychology to supplement evaluation of measurement quality rooted in classical test theory. [1]

Contents

Measurement invariance is often tested in the framework of multiple-group confirmatory factor analysis (CFA). [2] In the context of structural equation models, including CFA, measurement invariance is often termed factorial invariance. [3]

Definition

In the common factor model, measurement invariance may be defined as the following equality:

where is a distribution function, is an observed score, is a factor score, and s denotes group membership (e.g., Caucasian=0, African American=1). Therefore, measurement invariance entails that given a subject's factor score, his or her observed score is not dependent on his or her group membership. [4]

Types of invariance

Several different types of measurement invariance can be distinguished in the common factor model for continuous outcomes: [5]

1) Equal form: The number of factors and the pattern of factor-indicator relationships are identical across groups.
2) Equal loadings: Factor loadings are equal across groups.
3) Equal intercepts: When observed scores are regressed on each factor, the intercepts are equal across groups.
4) Equal residual variances: The residual variances of the observed scores not accounted for by the factors are equal across groups.

The same typology can be generalized to the discrete outcomes case:

1) Equal form: The number of factors and the pattern of factor-indicator relationships are identical across groups.
2) Equal loadings: Factor loadings are equal across groups.
3) Equal thresholds: When observed scores are regressed on each factor, the thresholds are equal across groups.
4) Equal residual variances: The residual variances of the observed scores not accounted for by the factors are equal across groups.

Each of these conditions corresponds to a multiple-group confirmatory factor model with specific constraints. The tenability of each model can be tested statistically by using a likelihood ratio test or other indices of fit. Meaningful comparisons between groups usually require that all four conditions are met, which is known as strict measurement invariance. However, strict measurement invariance rarely holds in applied context. [6] Usually, this is tested by sequentially introducing additional constraints starting from the equal form condition and eventually proceeding to the equal residuals condition if the fit of the model does not deteriorate in the meantime.

Tests for invariance

Although further research is necessary on the application of various invariance tests and their respective criteria across diverse testing conditions, two approaches are common among applied researchers. For each model being compared (e.g., Equal form, Equal Intercepts) a χ2 fit statistic is iteratively estimated from the minimization of the difference between the model implied mean and covariance matrices and the observed mean and covariance matrices. [7] As long as the models under comparison are nested, the difference between the χ2 values and their respective degrees of freedom of any two CFA models of varying levels of invariance follows a χ2 distribution (diff χ2) and as such, can be inspected for significance as an indication of whether increasingly restrictive models produce appreciable changes in model-data fit. [7] However, there is some evidence the diff χ2 is sensitive to factors unrelated to changes in invariance targeted constraints (e.g., sample size). [8] Consequently it is recommended that researchers also use the difference between the comparative fit index (ΔCFI) of two models specified to investigate measurement invariance. When the difference between the CFIs of two models of varying levels of measurement invariance (e.g., equal forms versus equal loadings) is below −0.01 (that is, it drops by more than 0.01), then invariance in likely untenable. [8] The CFI values being subtracted are expected to come from nested models as in the case of diff χ2 testing; [9] however, it seems that applied researchers rarely take this into consideration when applying the CFI test. [10]

Levels of Equivalence

Equivalence can also be categorized according to three hierarchical levels of measurement equivalence. [11] [12]

  1. Configural equivalence: The factor structure is the same across groups in a multi-group confirmatory factor analysis.
  2. Metric equivalence: Factor loadings are similar across groups. [11]
  3. Scalar equivalence: Values/Means are also equivalent across groups. [11]

Implementation

Tests of measurement invariance are available in the R programming language. [13] [14]

Criticism

The well-known political scientist Christian Welzel and his colleagues criticize the excessive reliance on invariance tests as criteria for the validity of cultural and psychological constructs in cross-cultural statistics. They have demonstrated that the invariance criteria favor constructs with low between-group variance, while constructs with high between-group variance fail these tests. A high between-group variance is indeed necessary for a construct to be useful in cross-cultural comparisons. The between-group variance is highest if some group means are near the extreme ends of the closed-ended scales, where the intra-group variance is necessarily low. Low intra-group variance yields low correlations and low factor loadings which scholars routinely interpret as an indication of inconsistency. Welzel and colleagues recommend instead to rely on nomological criteria of construct validity based on whether the construct correlates in expected ways with other measures of between-group differences. They offer several examples of cultural constructs that have high explanatory power and predictive power in cross-cultural comparisons, yet fail the tests for invariance. [15] [16] Proponents of invariance testing counter-argue that the reliance on nomological linkage ignores that such external validation hinges on the assumption of comparability. [17]

See also

Related Research Articles

Analysis of variance (ANOVA) is a collection of statistical models and their associated estimation procedures used to analyze the differences among means. ANOVA was developed by the statistician Ronald Fisher. ANOVA is based on the law of total variance, where the observed variance in a particular variable is partitioned into components attributable to different sources of variation. In its simplest form, ANOVA provides a statistical test of whether two or more population means are equal, and therefore generalizes the t-test beyond two means. In other words, the ANOVA is used to test the difference between two or more means.

Psychological statistics is application of formulas, theorems, numbers and laws to psychology. Statistical methods for psychology include development and application statistical theory and methods for modeling psychological data. These methods include psychometrics, factor analysis, experimental designs, and Bayesian statistics. The article also discusses journals in the same field.

Psychometrics is a field of study within psychology concerned with the theory and technique of measurement. Psychometrics generally covers specialized fields within psychology and education devoted to testing, measurement, assessment, and related activities. Psychometrics is concerned with the objective measurement of latent constructs that cannot be directly observed. Examples of latent constructs include intelligence, introversion, mental disorders, and educational achievement. The levels of individuals on nonobservable latent variables are inferred through mathematical modeling based on what is observed from individuals' responses to items on tests and scales.

Factor analysis is a statistical method used to describe variability among observed, correlated variables in terms of a potentially lower number of unobserved variables called factors. For example, it is possible that variations in six observed variables mainly reflect the variations in two unobserved (underlying) variables. Factor analysis searches for such joint variations in response to unobserved latent variables. The observed variables are modelled as linear combinations of the potential factors plus "error" terms, hence factor analysis can be thought of as a special case of errors-in-variables models.

<i>F</i>-test Statistical hypothesis test, mostly using multiple restrictions

An F-test is any statistical test used to compare the variances of two samples or the ratio of variances between multiple samples. The test statistic, random variable F, is used to determine if the tested data has an F-distribution under the true null hypothesis, and true customary assumptions about the error term (ε). It is most often used when comparing statistical models that have been fitted to a data set, in order to identify the model that best fits the population from which the data were sampled. Exact "F-tests" mainly arise when the models have been fitted to the data using least squares. The name was coined by George W. Snedecor, in honour of Ronald Fisher. Fisher initially developed the statistic as the variance ratio in the 1920s.

Analysis of covariance (ANCOVA) is a general linear model that blends ANOVA and regression. ANCOVA evaluates whether the means of a dependent variable (DV) are equal across levels of one or more categorical independent variables (IV) and across one or more continuous variables. For example, the categorical variable(s) might describe treatment and the continuous variable(s) might be covariates or nuisance variables; or vice versa. Mathematically, ANCOVA decomposes the variance in the DV into variance explained by the CV(s), variance explained by the categorical IV, and residual variance. Intuitively, ANCOVA can be thought of as 'adjusting' the DV by the group means of the CV(s).

In statistics, path analysis is used to describe the directed dependencies among a set of variables. This includes models equivalent to any form of multiple regression analysis, factor analysis, canonical correlation analysis, discriminant analysis, as well as more general families of models in the multivariate analysis of variance and covariance analyses.

<span class="mw-page-title-main">Coefficient of determination</span> Indicator for how well data points fit a line or curve

In statistics, the coefficient of determination, denoted R2 or r2 and pronounced "R squared", is the proportion of the variation in the dependent variable that is predictable from the independent variable(s).

<span class="mw-page-title-main">Structural equation modeling</span> Form of causal modeling that fit networks of constructs to data

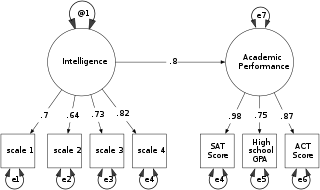
Structural equation modeling (SEM) is a diverse set of methods used by scientists doing both observational and experimental research. SEM is used mostly in the social and behavioral sciences but it is also used in epidemiology, business, and other fields. A definition of SEM is difficult without reference to technical language, but a good starting place is the name itself.

In statistics, the number of degrees of freedom is the number of values in the final calculation of a statistic that are free to vary.

In statistics, homogeneity and its opposite, heterogeneity, arise in describing the properties of a dataset, or several datasets. They relate to the validity of the often convenient assumption that the statistical properties of any one part of an overall dataset are the same as any other part. In meta-analysis, which combines the data from several studies, homogeneity measures the differences or similarities between the several studies.

In psychology, discriminant validity tests whether concepts or measurements that are not supposed to be related are actually unrelated.

In statistics, confirmatory factor analysis (CFA) is a special form of factor analysis, most commonly used in social science research. It is used to test whether measures of a construct are consistent with a researcher's understanding of the nature of that construct. As such, the objective of confirmatory factor analysis is to test whether the data fit a hypothesized measurement model. This hypothesized model is based on theory and/or previous analytic research. CFA was first developed by Jöreskog (1969) and has built upon and replaced older methods of analyzing construct validity such as the MTMM Matrix as described in Campbell & Fiske (1959).

The multitrait-multimethod (MTMM) matrix is an approach to examining construct validity developed by Campbell and Fiske (1959). It organizes convergent and discriminant validity evidence for comparison of how a measure relates to other measures. The conceptual approach has influenced experimental design and measurement theory in psychology, including applications in structural equation models.

Psychometric software is software that is used for psychometric analysis of data from tests, questionnaires, or inventories reflecting latent psychoeducational variables. While some psychometric analyses can be performed with standard statistical software like SPSS, most analyses require specialized tools.

<span class="mw-page-title-main">Exploratory factor analysis</span> Statistical method in psychology

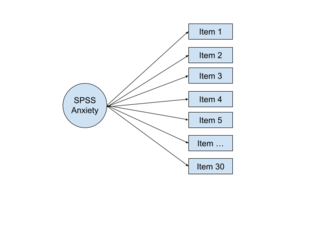
In multivariate statistics, exploratory factor analysis (EFA) is a statistical method used to uncover the underlying structure of a relatively large set of variables. EFA is a technique within factor analysis whose overarching goal is to identify the underlying relationships between measured variables. It is commonly used by researchers when developing a scale and serves to identify a set of latent constructs underlying a battery of measured variables. It should be used when the researcher has no a priori hypothesis about factors or patterns of measured variables. Measured variables are any one of several attributes of people that may be observed and measured. Examples of measured variables could be the physical height, weight, and pulse rate of a human being. Usually, researchers would have a large number of measured variables, which are assumed to be related to a smaller number of "unobserved" factors. Researchers must carefully consider the number of measured variables to include in the analysis. EFA procedures are more accurate when each factor is represented by multiple measured variables in the analysis.

<span class="mw-page-title-main">SmartPLS</span> Software

SmartPLS is a software with graphical user interface for variance-based structural equation modeling (SEM) using the partial least squares (PLS) path modeling method. Users can estimate models with their data by using basic PLS-SEM, weighted PLS-SEM (WPLS), consistent PLS-SEM (PLSc-SEM), and sumscores regression algorithms. The software computes standard results assessment criteria and it supports additional statistical analyses . Since SmartPLS is programmed in Java, it can be executed and run on different computer operating systems such as Windows and Mac.

In statistics, confirmatory composite analysis (CCA) is a sub-type of structural equation modeling (SEM). Although, historically, CCA emerged from a re-orientation and re-start of partial least squares path modeling (PLS-PM), it has become an independent approach and the two should not be confused. In many ways it is similar to, but also quite distinct from confirmatory factor analysis (CFA). It shares with CFA the process of model specification, model identification, model estimation, and model assessment. However, in contrast to CFA which always assumes the existence of latent variables, in CCA all variables can be observable, with their interrelationships expressed in terms of composites, i.e., linear compounds of subsets of the variables. The composites are treated as the fundamental objects and path diagrams can be used to illustrate their relationships. This makes CCA particularly useful for disciplines examining theoretical concepts that are designed to attain certain goals, so-called artifacts, and their interplay with theoretical concepts of behavioral sciences.

<span class="mw-page-title-main">Homoscedasticity and heteroscedasticity</span> Statistical property

In statistics, a sequence of random variables is homoscedastic if all its random variables have the same finite variance; this is also known as homogeneity of variance. The complementary notion is called heteroscedasticity, also known as heterogeneity of variance. The spellings homoskedasticity and heteroskedasticity are also frequently used. Assuming a variable is homoscedastic when in reality it is heteroscedastic results in unbiased but inefficient point estimates and in biased estimates of standard errors, and may result in overestimating the goodness of fit as measured by the Pearson coefficient.

Barbara M. Byrne was a Canadian quantitative psychologist known for her work in psychometrics, specifically regarding construct validity, structural equation modeling (SEM), and statistics. She held the position of Professor Emerita in the School of Psychology at the University of Ottawa and was a fellow of the International Testing Committee (ITC), International Association for Applied Psychology (IAAP), and American Psychological Association (APA) throughout her research career.

References

  1. 1 2 Vandenberg, Robert J.; Lance, Charles E. (2000). "A Review and Synthesis of the Measurement Invariance Literature: Suggestions, Practices, and Recommendations for Organizational Research". Organizational Research Methods. 3: 4–70. doi:10.1177/109442810031002. S2CID   145605476.
  2. Chen, Fang Fang; Sousa, Karen H.; West, Stephen G. (2005). "Testing Measurement Invariance of Second-Order Factor Models". Structural Equation Modeling. 12 (3): 471–492. doi:10.1207/s15328007sem1203_7. S2CID   120893307.
  3. Widaman, K. F.; Ferrer, E.; Conger, R. D. (2010). "Factorial Invariance within Longitudinal Structural Equation Models: Measuring the Same Construct across Time". Child Development Perspectives. 4 (1): 10–18. doi:10.1111/j.1750-8606.2009.00110.x. PMC   2848495 . PMID   20369028.
  4. Lubke, G. H.; et al. (2003). "On the relationship between sources of within- and between-group differences and measurement invariance in the common factor model". Intelligence. 31 (6): 543–566. doi:10.1016/s0160-2896(03)00051-5.
  5. Brown, T. (2015). Confirmatory Factor Analysis for Applied Research, Second Edition. The Guilford Press.
  6. Van De Schoot, Rens; Schmidt, Peter; De Beuckelaer, Alain; Lek, Kimberley; Zondervan-Zwijnenburg, Marielle (2015-01-01). "Editorial: Measurement Invariance". Frontiers in Psychology. 6: 1064. doi: 10.3389/fpsyg.2015.01064 . PMC   4516821 . PMID   26283995.
  7. 1 2 Loehlin, John (2004). Latent Variable Models: An Introduction to Factor, Path, and Structural Equation Analysis. Taylor & Francis. ISBN   9780805849103.
  8. 1 2 Cheung, G. W.; Rensvold, R. B. (2002). "Evaluating goodness-of-fit indexes for testing measurement invariance". Structural Equation Modeling. 9 (2): 233–255. doi:10.1207/s15328007sem0902_5. S2CID   32598448.
  9. Widaman, Keith F.; Thompson, Jane S. (2003-03-01). "On specifying the null model for incremental fit indices in structural equation modeling". Psychological Methods. 8 (1): 16–37. CiteSeerX   10.1.1.133.489 . doi:10.1037/1082-989x.8.1.16. ISSN   1082-989X. PMID   12741671.
  10. Kline, Rex (2011). Principles and Practice of Structural Equation Modeling. Guilford Press.
  11. 1 2 3 Steenkamp, Jan-Benedict E. M.; Baumgartner, Hans (1998-06-01). "Assessing Measurement Invariance in Cross-National Consumer Research". Journal of Consumer Research. 25 (1): 78–90. doi:10.1086/209528. ISSN   0093-5301. JSTOR   10.1086/209528.
  12. Ariely, Gal; Davidov, Eldad (2012-09-01). "Assessment of Measurement Equivalence with Cross-National and Longitudinal Surveys in Political Science". European Political Science. 11 (3): 363–377. doi: 10.1057/eps.2011.11 . ISSN   1680-4333.
  13. Hirschfeld, Gerrit; von Brachel, Ruth (2014). "Improving Multiple-Group confirmatory factor analysis in R – A tutorial in measurement invariance with continuous and ordinal indicators". Practical Assessment, Research & Evaluation. 19. doi:10.7275/qazy-2946.
  14. Kim, J. Y.; Newman, D. A.; Harms, P. D.; Wood, D. (2023). "Perceived weirdness: A multitrait-multisource study of self and other normality evaluations". Personality Science. 4. doi: 10.5964/ps.7399 .
  15. Welzel, Christian; Brunkert, Lennart; Kruse, Stefan; Inglehart, Ronald F. (2021). "Non-invariance? An Overstated Problem With Misconceived Causes". Sociological Methods & Research. 1 (33): 1368–1400. doi: 10.1177/0049124121995521 .
  16. Welzel, Christian; Kruse, Stefan; Brunkert, Lennart (2022). "Against the Mainstream: On the Limitations of Non-Invariance Diagnostics: Response to Fischer et al. and Meuleman et al". Sociological Methods & Research: 00491241221091754. doi: 10.1177/00491241221091754 .
  17. Meuleman, Bart; Żółtak, Tomasz (2022). "Why Measurement Invariance is Important in Comparative Research. A Response to Welzel et al. (2021)". Sociological Methods & Research: 00491241221091755. doi:10.1177/00491241221091755.