Business intelligence (BI) comprises the strategies and technologies used by enterprises for the data analysis and management of business information. Common functions of business intelligence technologies include reporting, online analytical processing, analytics, dashboard development, data mining, process mining, complex event processing, business performance management, benchmarking, text mining, predictive analytics, and prescriptive analytics.
Text mining, text data mining (TDM) or text analytics is the process of deriving high-quality information from text. It involves "the discovery by computer of new, previously unknown information, by automatically extracting information from different written resources." Written resources may include websites, books, emails, reviews, and articles. High-quality information is typically obtained by devising patterns and trends by means such as statistical pattern learning. According to Hotho et al. (2005) we can distinguish between three different perspectives of text mining: information extraction, data mining, and a knowledge discovery in databases (KDD) process. Text mining usually involves the process of structuring the input text, deriving patterns within the structured data, and finally evaluation and interpretation of the output. 'High quality' in text mining usually refers to some combination of relevance, novelty, and interest. Typical text mining tasks include text categorization, text clustering, concept/entity extraction, production of granular taxonomies, sentiment analysis, document summarization, and entity relation modeling.
Latent semantic analysis (LSA) is a technique in natural language processing, in particular distributional semantics, of analyzing relationships between a set of documents and the terms they contain by producing a set of concepts related to the documents and terms. LSA assumes that words that are close in meaning will occur in similar pieces of text. A matrix containing word counts per document is constructed from a large piece of text and a mathematical technique called singular value decomposition (SVD) is used to reduce the number of rows while preserving the similarity structure among columns. Documents are then compared by cosine similarity between any two columns. Values close to 1 represent very similar documents while values close to 0 represent very dissimilar documents.
A document-term matrix is a mathematical matrix that describes the frequency of terms that occur in a collection of documents. In a document-term matrix, rows correspond to documents in the collection and columns correspond to terms. This matrix is a specific instance of a document-feature matrix where "features" may refer to other properties of a document besides terms. It is also common to encounter the transpose, or term-document matrix where documents are the columns and terms are the rows. They are useful in the field of natural language processing and computational text analysis.
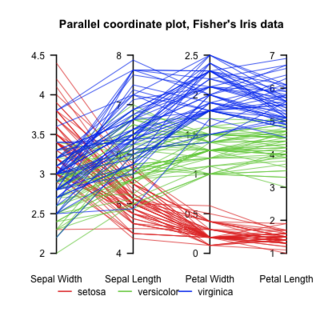
Parallel coordinates are a common way of visualizing and analyzing high-dimensional datasets.
Unstructured data is information that either does not have a pre-defined data model or is not organized in a pre-defined manner. Unstructured information is typically text-heavy, but may contain data such as dates, numbers, and facts as well. This results in irregularities and ambiguities that make it difficult to understand using traditional programs as compared to data stored in fielded form in databases or annotated in documents.

Data and information visualization is the practice of designing and creating easy-to-communicate and easy-to-understand graphic or visual representations of a large amount of complex quantitative and qualitative data and information with the help of static, dynamic or interactive visual items. Typically based on data and information collected from a certain domain of expertise, these visualizations are intended for a broader audience to help them visually explore and discover, quickly understand, interpret and gain important insights into otherwise difficult-to-identify structures, relationships, correlations, local and global patterns, trends, variations, constancy, clusters, outliers and unusual groupings within data. When intended for the general public to convey a concise version of known, specific information in a clear and engaging manner, it is typically called information graphics.
Concept mining is an activity that results in the extraction of concepts from artifacts. Solutions to the task typically involve aspects of artificial intelligence and statistics, such as data mining and text mining. Because artifacts are typically a loosely structured sequence of words and other symbols, the problem is nontrivial, but it can provide powerful insights into the meaning, provenance and similarity of documents.
Search engine indexing is the collecting, parsing, and storing of data to facilitate fast and accurate information retrieval. Index design incorporates interdisciplinary concepts from linguistics, cognitive psychology, mathematics, informatics, and computer science. An alternate name for the process, in the context of search engines designed to find web pages on the Internet, is web indexing.
The National Centre for Text Mining (NaCTeM) is a publicly funded text mining (TM) centre. It was established to provide support, advice, and information on TM technologies and to disseminate information from the larger TM community, while also providing tailored services and tools in response to the requirements of the United Kingdom academic community.
Enterprise search is the practice of making content from multiple enterprise-type sources, such as databases and intranets, searchable to a defined audience.
Document clustering is the application of cluster analysis to textual documents. It has applications in automatic document organization, topic extraction and fast information retrieval or filtering.
Digital history is the use of digital media to further historical analysis, presentation, and research. It is a branch of the digital humanities and an extension of quantitative history, cliometrics, and computing. Digital history is commonly digital public history, concerned primarily with engaging online audiences with historical content, or, digital research methods, that further academic research. Digital history outputs include: digital archives, online presentations, data visualizations, interactive maps, timelines, audio files, and virtual worlds to make history more accessible to the user. Recent digital history projects focus on creativity, collaboration, and technical innovation, text mining, corpus linguistics, network analysis, 3D modeling, and big data analysis. By utilizing these resources, the user can rapidly develop new analyses that can link to, extend, and bring to life existing histories

The Information Retrieval Facility (IRF), founded 2006 and located in Vienna, Austria, was a research platform for networking and collaboration for professionals in the field of information retrieval. It ceased operations in 2012.
A concept search is an automated information retrieval method that is used to search electronically stored unstructured text for information that is conceptually similar to the information provided in a search query. In other words, the ideas expressed in the information retrieved in response to a concept search query are relevant to the ideas contained in the text of the query.
WordStat is a content analysis and text mining software. It was first released in 1998 after being developed by Normand Peladeau from Provalis Research. The latest version 9 was released in 2021.

Word2vec is a technique for natural language processing (NLP) published in 2013. The word2vec algorithm uses a neural network model to learn word associations from a large corpus of text. Once trained, such a model can detect synonymous words or suggest additional words for a partial sentence. As the name implies, word2vec represents each distinct word with a particular list of numbers called a vector. The vectors are chosen carefully such that they capture the semantic and syntactic qualities of words; as such, a simple mathematical function can indicate the level of semantic similarity between the words represented by those vectors.
Patent analysis is the process of analyzing patent documents and other information from the patent lifecycle. The field of patent analytics uses patent analysis to obtain deeper insights into different technologies and innovation. Other terms are sometimes used as synonyms for patent analytics: patent landscaping, patent mapping, or cartography. However, there is no harmonized terminology in different languages, including in French and Spanish, while in some languages terms are borrowed from other languages. Patent analytics encompasses the analysis of patent data, analysis of the scientific literature, data cleaning, text mining, machine learning, geographic mapping, and data visualisation.

KH Coder is an open source software for computer assisted qualitative data analysis, particularly quantitative content analysis and text mining. It can be also used for computational linguistics. It supports processing and etymological information of text in several languages, such as Japanese, English, French, German, Italian, Portuguese and Spanish. Specifically, it can contribute factual examination co-event system hub structure, computerized arranging guide, multidimensional scaling and comparative calculations.
