Gas demand

The world gets almost one quarter of its energy from natural gas. The largest increments in future gas demand are expected to come from developing countries.[ citation needed ]
Peak gas is the point in time when the maximum global natural gas (fossil gas) production rate will be reached, after which the rate of production will enter its terminal decline. [1] Although demand is peaking in the United States [2] and Europe, [3] it continues to rise globally due to consumers in Asia, [4] especially China. [5] [6] Natural gas is a fossil fuel formed from plant matter over the course of millions of years. Natural gas derived from fossil fuels is a non-renewable energy source; however, methane can be renewable in other forms such as biogas. Peak coal was in 2013, and peak oil is forecast to occur before peak gas. [7] One forecast is for natural gas demand to peak in 2035. [8]
The concept of peak gas follows from Hubbert peak theory, which is most commonly associated with peak oil. Hubbert saw gas, coal and oil as natural resources, each of which would peak in production and eventually run out for a region, a country, or the world.
The world gets almost one quarter of its energy from natural gas. The largest increments in future gas demand are expected to come from developing countries.[ citation needed ]

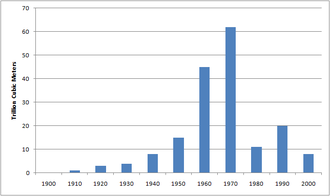
Hubbert’s original peak theory predicts that natural gas will experience three equally spaced events: first, the rate of discoveries will peak, then X years later reserves will peak, and finally X years after peak reserves, gas production will peak at the same rate as the previous peak of discoveries. For the United States, for instance, Hubbert projected that the natural gas discovery rate was peaking in 1962 at about 570 billion cubic metres (20 trillion cubic feet) per year. From his curves, he predicted that proved reserves would peak eight years later, in 1970, and that production would peak after another eight years, in 1978, at 570 billion cubic metres (20 trillion cubic feet) per year, about equal to the rate of peak discoveries. [9]
Of the three peaks, Hubbert found the peak in discoveries most difficult to define, because of large year-to-year scatter, and the phenomenon of “reserve growth.” Initial estimates of a discovery are usually much lower than ultimate recovery, especially if the conservative estimate of proven reserves is the measure. As the discovery is drilled out, estimates rise. Sometimes estimates of recoverable oil and gas in a discovery continue to rise for many years after the discovery. To find the peak in discoveries, Hubbert backdated reserve growth to the date of field discovery. [10]
According to David L. Goodstein, the worldwide rate of discovery peaked around 1960 and has been declining ever since. [11] Exxon Mobil Vice President, Harry J. Longwell places the peak of global gas discovery around 1970 and has observed a sharp decline in natural gas discovery rates since then. [12] The rate of discovery has fallen below the rate of consumption in 1980. [11] The gap has been widening ever since. Declining gas discovery rates foreshadow future production decline rates because gas production can only follow gas discoveries.
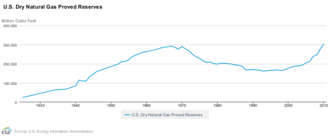
Despite the reported fall in new-field discoveries, world proved reserves of natural gas have continued to grow, from 19 billion cubic meters (bcm) in 1960, 45 bcm in 1970 and 84 bcm in 1980, to a record high 200 bcm in 2012. [13] A researcher for the US Energy Information Administration pointed out that after the first wave of discoveries in an area, most oil and natural gas reserve growth comes not from discoveries of new fields, but from extensions and additional gas found within existing fields. [14]
Dr. Anthony Hayward CCMI, chief executive of BP stated in October 2009 that proven natural gas reserves around the world have risen to 190 cubic kilometres (1.2 trillion barrels) of oil equivalent, enough for 60 years' supply if consumption is non-increasing, and that gas reserves are trending upward. [15] A similar situation exists with oil reserves in that they have increased despite the actual declines of worldwide discoveries for decades and despite increases in consumption. BP’s former Chief Petroleum Engineer Jeremy Gilbert stated in 2007 that the growth in oil reserves "results largely from distortions created by the..reporting rules of the US Securities and Exchange Commission" that force companies to be overly conservative in their calculation of reserves, but that "even this illusory growth is unlikely to last," because fewer oil reserves are coming under the control of SEC-regulated companies. [16] However, since Gilbert's statement, proven reserves of both oil and gas have continued to rise, proven oil reserves increasing 23%, from 1.20 trillion barrels in 2007, to 1.48 trillion barrels in 2012. [13]


Italy's gas consumption is presently third-highest in Europe, behind only Germany and the United Kingdom. [17] Gas consumption is growing at a steady rate, and gas consumption in 2001 was 50% greater than it was in 1990. [18]
Italy’s major oil and gas company is Eni. Formerly state-owned, it was privatized during the 1990s, but the government still retains around one-third of the shares. Natural gas reserves in Italy were 164 billion m3 at the beginning of 2007. Natural gas production in 2005 was 11.5 billion m3, while consumption was 82.6 billion m3. The difference was imported. The primary sources of imported gas are Algeria, Russia and the Netherlands.

The Netherlands government has stated that peak gas occurred in 2007–2008 and the country will have become a net importer of natural gas by 2025. [19]

Natural gas in Romania was discovered in 1909 in the Sărmăşel area. [20] In 1917, Turda became the first European town lit up with natural gas. Maximum production of 29.8 billion m3 was achieved in 1976. [21] Today, gas provides about 40% of the country's energy needs.

Gazprom, Russia's state-controlled gas monopoly, is a firm which holds 25% of the world's gas reserves. Gazprom produces the bulk of Russia's gas. [22] [23]

UK gets its natural gas almost entirely from the North Sea. The North Sea gas field peaked in 2000 and has been falling quickly since. Production in 2004 was 12% down from the peak. [24]

In 1952, Dr. Edward Steidle, Dean of the School of Mineral Industries at Pennsylvania State College, predicted that gas production would soon decline significantly from 1952 rates, so that gas would cease to be a significant energy source by 2002, and possibly as early as 1975. [25]
In 1956, Hubbert used an estimated ultimate recovery (EUR) of 850 trillion cubic feet (24,000 km3) (an amount postulated by geologist Wallace Pratt) to predict a US production peak of about 14 trillion cubic feet (400 km3) per year to occur "approximately 1970". [26] Pratt, in his EUR estimate (p. 96), explicitly included what he called the "phenomenal discovery rate" that the industry was then experiencing in the offshore Gulf of Mexico. [27]
In 1962, Hubbert pushed his predicted peak back a few years based on a more optimistic estimation of 1,000 trillion cubic feet of total original reserves. His new peak gas curve predicted a peak in 1978 at slightly more than 20 tcf per year. [28]
US gas production reached a peak in 1973 at about 24.1 trillion cubic feet (680 km3), and declined overall for the next decade. But even greater new discoveries in the offshore Gulf of Mexico than anticipated, and development of "unconventional reserves", [29] proved Pratt's EUR estimate to be too low as US gas production rose again.
In 1971, Hubbert revised his peak gas estimate based on updated reserve information. He revised his estimated ultimate recovery upward to 1,075 trillion cubic feet (30,400 km3) for the lower 48 states only, and predicted: "For natural gas, the peak of production will probably be reached between 1975 and 1980." [30] Gas production for the lower 48 states did peak in 1979, and declined for several years, but rose again, and once more Hubbert's assumed EUR of 1,075×1012 cu ft (30,400 km3) proved to be too low, as actual lower 48 state production from 1936 through 2012 has already exceeded 1,265×1012 cu ft (35,800 km3), 18% higher than the estimated EUR of 1,075. [31]
Economist Doug Reynolds predicted in 2005 that the North American gas peak would occur in 2007 [32] Reynolds revised his forecast in 2009 to include Southern Canada; he predicted that the combined US Lower 48-Southern Canadian gas production would peak in 2013. [33]
Although Hubbert had acknowledged multiple peaks in oil production in Illinois, he used single peak models for oil and gas production in the US as a whole. In 2008, Tad Patzek of the University of California rejected the single-peak model, and showed the multiple peaks of past US gas production as the sum of five different Hubbert curves. He concluded that new technology has more than doubled gas reserves. His figure 15 shows gas production declining steeply after a probable peak in known cycles in 2008. However, he refrained from predicting a date after which gas production would begin terminal decline, but noted: "The actual future of US natural gas production will be the sum of known Hubbert cycles, shown in this paper, and future Hubbert cycles." and warned: "The current drilling effort in the US cannot be sustained without major new advances to increase the productivity of tight formations." [34]
In 2005 Exxon's CEO Lee Raymond said to Reuters that "Gas production has peaked in North America." [35] The Reuters article continues to say "While the number of U.S. rigs drilling for natural gas has climbed about 20 percent over the last year and prices are at record highs, producers have been struggling to raise output." North American natural gas production indeed peaked in 2001 at 27.5×10¹² cu ft (780 km3) per year, and declined to 26.1×10¹² cu ft (740 km3) by 2005, but then rose again in 2006 and 2007 to a new high of 27.9×10¹² cu ft (790 km3)in 2007 [36] This would make the 2007 figure 1.45% higher than the 2001 figure, for an average annual increase of 0.24% per year during 2001–2007.
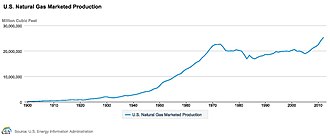
In December 2009 the US Energy Information Administration (EIA) projected US marketed gas production will have reached a first peak at 20.60×10¹² cu ft (583 km3) in 2009, decline to 18.90×10¹² cu ft (535 km3) in 2013, then rise again to 23.27×10¹² cu ft (659 km3) in 2035, the final year of their projection, for an average annual rate of increase of 0.47% per year during 2009–2035 [37] In its Annual Energy Outlook 2010 released in May 2010, EIA projected growth from 20.6×10¹² cu ft (580 km3) in 2008 (same amount as 2009) to 23.3 trillion cubic feet (660 km3) in 2035 in the Reference case, with Alternative case estimates ranging 17.4 to 25.9×10¹² cu ft (730 km3) in 2035. These represent productions of average annual growth rates between −0.63% (net decline) and 0.85% in the alternate cases, and 0.46% in the reference case. [38]
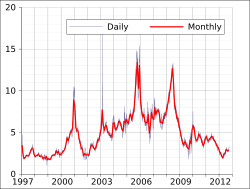
The natural gas crisis is typically described by upward price spikes of natural gas in North America from 2000 to 2008, [39] due to the decline in production and the increase in demand for electricity generation. Gas production in the U.S. fell from 20,570,295×106 cu ft (5.824859×10¹¹ m3) in 2001 to 18,950,734×106 cu ft (5.366250×10¹¹ m3) in 2005, before rising again in 2006 and 2007. [40]
The anticipated gas shortage in North America led some, such as former Federal Reserve Chairman Alan Greenspan, to advocate increased imports of liquefied natural gas (LNG). [41] However, record high natural gas production rates and proved reserves in the US have put LNG imports on hold, and even spawned projects for LNG exports from North America. As of April 2015, ten LNG export terminals had been approved and six are under construction in the US and Canada. [42]
The Potential Gas Committee, a non-profit group at the Colorado School of Mines, estimated US natural gas resources to be 43,200 cubic kilometres (1,525 trillion cubic feet) in 2007 (86 times current annual consumption) and in 2009 raised their estimate again to 63,600 km3 (2,247 trillion cu ft) (almost 100 times current annual consumption). The large increase over previous years' estimates was attributed to a surge in natural gas drilling and exploration spurred by a rise in prices and new technology allowing production from once uneconomic formations, such as shale and coal seams. [43] [44]
In 2002, R.W. Bentley (p. 189) predicted a global "decline in conventional gas production from about 2020." [45]
One forecast is for natural gas demand to peak in 2035. [46]
In their March 2013 report, "Fossil and Nuclear Fuels – The Supply Outlook", the Energy Watch Group predicted that global natural gas production "will peak around or even before the year 2020". [47] However, the same report (page 75) postulated that US natural gas production had peaked in 2012, and predicted that it would decline steeply after 2015. Instead, US gas production has continued to rise through 2017. [48]
The Hubbert curve is an approximation of the production rate of a resource over time. It is a symmetric logistic distribution curve, often confused with the "normal" gaussian function. It first appeared in "Nuclear Energy and the Fossil Fuels," geologist M. King Hubbert's 1956 presentation to the American Petroleum Institute, as an idealized symmetric curve, during his tenure at the Shell Oil Company. It has gained a high degree of popularity in the scientific community for predicting the depletion of various natural resources. The curve is the main component of Hubbert peak theory, which has led to the rise of peak oil concerns. Basing his calculations on the peak of oil well discovery in 1948, Hubbert used his model in 1956 to create a curve which predicted that oil production in the contiguous United States would peak around 1970.

The world economy or global economy is the economy of all humans of the world, referring to the global economic system, which includes all economic activities which are conducted both within and between nations, including production, consumption, economic management, work in general, exchange of financial values and trade of goods and services. In some contexts, the two terms are distinct "international" or "global economy" being measured separately and distinguished from national economies, while the "world economy" is simply an aggregate of the separate countries' measurements. Beyond the minimum standard concerning value in production, use and exchange, the definitions, representations, models and valuations of the world economy vary widely. It is inseparable from the geography and ecology of planet Earth.

Marion King Hubbert was an American geologist and geophysicist. He worked at the Shell research lab in Houston, Texas. He made several important contributions to geology, geophysics, and petroleum geology, most notably the Hubbert curve and Hubbert peak theory, with important political ramifications. He was often referred to as "M. King Hubbert" or "King Hubbert".

The Hubbert peak theory says that for any given geographical area, from an individual oil-producing region to the planet as a whole, the rate of petroleum production tends to follow a bell-shaped curve. It is one of the primary theories on peak oil.

Peak oil is the point in time when the maximum rate of global oil production is reached, after which production will begin an irreversible decline. It is related to the distinct concept of oil depletion; while global petroleum reserves are finite, the limiting factor is not whether the oil exists but whether it can be extracted economically at a given price. A secular decline in oil extraction could be caused both by depletion of accessible reserves and by reductions in demand that reduce the price relative to the cost of extraction, as might be induced to reduce carbon emissions.
Oil depletion is the decline in oil production of a well, oil field, or geographic area. The Hubbert peak theory makes predictions of production rates based on prior discovery rates and anticipated production rates. Hubbert curves predict that the production curves of non-renewing resources approximate a bell curve. Thus, according to this theory, when the peak of production is passed, production rates enter an irreversible decline.

Natural gas prices, as with other commodity prices, are mainly driven by supply and demand fundamentals. However, natural gas prices may also be linked to the price of crude oil and petroleum products, especially in continental Europe. Natural gas prices in the US had historically followed oil prices, but in the recent years, it has decoupled from oil and is now trending somewhat with coal prices.
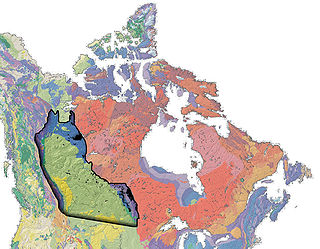
The Western Canadian Sedimentary Basin (WCSB) underlies 1.4 million square kilometres (540,000 sq mi) of Western Canada including southwestern Manitoba, southern Saskatchewan, Alberta, northeastern British Columbia and the southwest corner of the Northwest Territories. This vast sedimentary basin consists of a massive wedge of sedimentary rock extending from the Rocky Mountains in the west to the Canadian Shield in the east. This wedge is about 6 kilometres (3.7 mi) thick under the Rocky Mountains, but thins to zero at its eastern margins. The WCSB contains one of the world's largest reserves of petroleum and natural gas and supplies much of the North American market, producing more than 450 million cubic metres per day of gas in 2000. It also has huge reserves of coal. Of the provinces and territories within the WCSB, Alberta has most of the oil and gas reserves and almost all of the oil sands.

Iran has the fourth largest oil reserves and the 2nd largest natural gas reserves in the world. The nation is a member of OPEC, and generates approximately 50% of state revenue through oil exports.
Peak coal is the peak consumption or production of coal by a human community. The peak of coal's share in the global energy mix was in 2008, when coal accounted for 30% of global energy production. Coal consumption is declining in the United States and Europe, as well as developed economies in Asia. However, consumption is still increasing in countries such as China, Indonesia, India, Russia and Australia, which compensate for the falls in other regions. Global coal consumption reached an all time high in 2022 at 8.3 billion tonnes. Global coal demand is set to remain at record levels in 2023.

Peak oil is the point at which oil production, sometimes including unconventional oil sources, hits its maximum. Predicting the timing of peak oil involves estimation of future production from existing oil fields as well as future discoveries. The most influential production model is Hubbert peak theory, first proposed in the 1950s. The effect of peak oil on the world economy remains controversial.

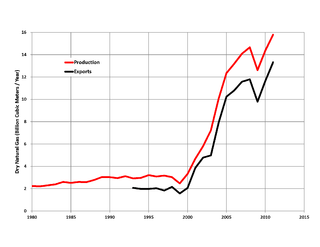
According to the Iran Petroleum Ministry, the proved natural gas reserves of Iran are about 1,201 trillion cubic feet (34.0 trillion cubic metres) or about 17.8% of world's total reserves, of which 33% are as associated gas and 67% is in non associated gas fields. It has the world's second largest reserves after Russia. As it takes approximately 5,850 cubic feet (166 m3) of gas to equal the energy content of 1-barrel (0.16 m3) of oil, Iran's gas reserves represent the equivalent of about 205 billion barrels (3.26×10¹⁰ m3) of oil.
As of 2005, Azerbaijan produced a range of metals and industrial minerals, including aluminum, lead, iron, and zinc.
West Australian Petroleum Pty Ltd (WAPET) was a pioneer oil and gas exploration and processing company in Western Australia.
The reserves-to-production ratio is the remaining amount of a non-renewable resource, expressed in time. While applicable to all natural resources, the RPR is most commonly applied to fossil fuels, particularly petroleum and natural gas. The reserve portion (numerator) of the ratio is the amount of a resource known to exist in an area and to be economically recoverable. The production portion (denominator) of the ratio is the amount of resource produced in one year at the current rate.

Sustainability measurement is a set of frameworks or indicators to measure how sustainable something is. This includes processes, products, services and businesses. Sustainability is difficult to quantify. It may even be impossible to measure. To measure sustainability, the indicators consider environmental, social and economic domains. The metrics are still evolving. They include indicators, benchmarks and audits. They include sustainability standards and certification systems like Fairtrade and Organic. They also involve indices and accounting. And they can include assessment, appraisal and other reporting systems. These metrics are used over a wide range of spatial and temporal scales. Sustainability measures include corporate sustainability reporting, Triple Bottom Line accounting. They include estimates of the quality of sustainability governance for individual countries. These use the Environmental Sustainability Index and Environmental Performance Index. Some methods let us track sustainable development. These include the UN Human Development Index and ecological footprints.
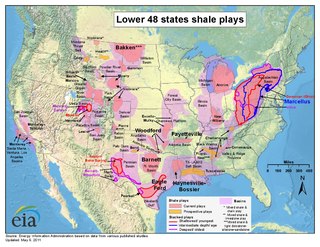
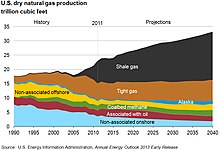
Shale gas in the United States is an available source of unconventional natural gas. Led by new applications of hydraulic fracturing technology and horizontal drilling, development of new sources of shale gas has offset declines in production from conventional gas reservoirs, and has led to major increases in reserves of U.S. natural gas. Largely due to shale gas discoveries, estimated reserves of natural gas in the United States in 2008 were 35% higher than in 2006.
Natural gas in Bolivia is one of the nation's main energy sources and export products. Bolivia's proved natural gas reserves are estimated to be 10.7 (TCF) .. Most of these reserves are located in the eastern region of the country. The major export pipelines in Bolivia transport the gas to Argentina and Brazil.
Shale gas is an unconventional natural gas produced from shale, a type of sedimentary rock. Shale gas has become an increasingly important source of natural gas in the United States over the past decade, and interest has spread to potential gas shales in Canada, Europe, Asia, and Australia. One analyst expects shale gas to supply as much as half the natural gas production in North America by 2020.

Natural gas was the United States' largest source of energy production in 2016, representing 33 percent of all energy produced in the country. Natural gas has been the largest source of electrical generation in the United States since July 2015.
{{cite journal}}: Cite journal requires |journal= (help){{cite journal}}: Cite journal requires |journal= (help)| Major topics | |
|---|---|
| Society and population | |
| Publications | |
| Lists | |
Events and organizations |
|
| Related topics | |