Peak water

Last updated

Peak water is a concept that underlines the growing constraints on the availability, quality, and use of freshwater resources. Peak water was defined in 2010 by Peter Gleick and Meena Palaniappan. [1] They distinguish between peak renewable, peak non-renewable, and peak ecological water to demonstrate the fact that although there is a vast amount of water on the planet, sustainably managed water is becoming scarce. [2]

Contents

Lester R. Brown, president of the Earth Policy Institute, wrote in 2013 that although there was extensive literature on peak oil, it was peak water that is "the real threat to our future". [3] An assessment was published in August 2011 in the Stockholm International Water Institute's journal. [4] Much of the world's water in underground aquifers [5] and in lakes can be depleted and thus resembles a finite resource. [6] The phrase peak water sparks debates similar to those about peak oil. In 2010, New York Times chose "peak water" as one of its 33 "Words of the Year". [7]

There are concerns about impending peak water in several areas around the world:

If present trends[ which? ] continue, 1.8 billion people will be living with absolute water scarcity by 2025, and two-thirds of the world could be subject to water stress. [8] Ultimately, peak water is not about running out of freshwater, but about reaching physical, economic, and environmental limits on meeting human demands for water and the subsequent decline of water availability and use.

Comparison with peak oil

The Hubbert curve has become popular in the scientific community for predicting the depletion of various natural resources. M. King Hubbert created this measurement device in 1956 for a variety of finite resources such as coal, oil, natural gas and uranium. [9] Hubbert's curve was not applied to resources such as water originally, since water is a renewable resource. Some forms of water, however, such as fossil water, exhibit similar characteristics to oil, and overpumping (faster than the rate of natural recharge of groundwater) can theoretically result in a Hubbert-type peak. A modified Hubbert curve applies to any resource that can be harvested faster than it can be replaced. [10] Like peak oil, peak water is inevitable given the rate of extraction of certain water systems. A current argument is that growing populations and demands for water will inevitably lead to non-renewable use of water resources. [11]

Water supply

Fresh water is a renewable resource, yet the world's supply of clean, fresh water is under increasing demand for human activities. [12] The world has an estimated 1.34 billion cubic kilometers of water, but 96.5% of it is salty. [13] Almost 70% of fresh water can be found in the ice caps of Antarctica and Greenland. Less than 1% of this water on Earth is accessible to humans, the rest is contained in soil moisture or deep underground. Accessible freshwater is located in lakes, rivers, reservoirs and shallow underground sources. Rainwater and snowfall do very little to replenish many underground sources. [14]

Freshwater sources (top 15 countries) [15]
Total freshwater supply
Country(km3/yr)Year
Flag of Brazil.svg  Brazil 8,2332000
Flag of Russia.svg  Russia 4,5082011
Flag of the United States.svg  USA 3,0691985
Flag of Canada (Pantone).svg  Canada 2,9022011
Flag of the People's Republic of China.svg  China 2,7392008
Flag of Colombia.svg  Colombia 2,1322000
Flag of Indonesia.svg  Indonesia 2,0192011
Flag of Peru.svg  Peru 1,9132000
Flag of India.svg  India 1,9112011
Flag of the Democratic Republic of the Congo.svg  DR Congo 1,2832001
Flag of Venezuela.svg  Venezuela 1,2332000
Flag of Bangladesh.svg  Bangladesh 1,2271999
Flag of Myanmar.svg  Myanmar 1,1682011
Flag of Chile.svg  Chile 9222000
Flag of Vietnam.svg  Vietnam 8842011

The amount of available freshwater supply in some regions is decreasing because of (i) climate change, which has caused receding glaciers, reduced stream and river flow, and shrinking lakes; (ii) contamination of water by human and industrial wastes; and (iii) overuse of non-renewable groundwater aquifers. Many aquifers have been over-pumped and are not recharging quickly. Although the total freshwater supply is not used up, much has become polluted, salted, unsuitable or otherwise unavailable for drinking, industry, and agriculture.

Water demand

Water demand already exceeds supply in many parts of the world, and as the world population continues to rise, many more areas are expected to experience this imbalance in the near future.

Agriculture represents 70% of freshwater use worldwide. [16]

Agriculture, industrialization and urbanization all serve to increase water consumption.

Freshwater withdrawal by country

The largest total use of water comes from India, China and the United States, countries with large populations, extensive agricultural irrigation, and demand for food. See the following table:

Freshwater withdrawal by country and sector (top 20 countries) [17]
CountryTotal freshwater withdrawal (km3/yr)Per capita withdrawal (m3/p/yr)Domestic use (m3/p/yr)(in %)Industrial use (m3/p/yr)(in %)Agricultural use (m3/p/yr)(in %)
Flag of India.svg  India 76162746 (7%)14 (2%)567 (90%)
Flag of the People's Republic of China.svg  China 578.942552 (12%)99 (23%)272 (64%)
Flag of the United States.svg  United States 482.21,518193 (13%)699 (46%)626 (41%)
Flag of Pakistan.svg  Pakistan 183.599352 (5%)8 (1%)933 (94%)
Flag of Indonesia.svg  Indonesia 113.348758 (12%)34 (7%)400 (82%)
Flag of Iran.svg  Iran 93.31,24385 (7%)12 (1%)1143 (92%)
Flag of Japan.svg  Japan 90709135 (19%)127 (18%)446 (63%)
Flag of Vietnam.svg  Vietnam 829219 (1%)37 (4%)875 (95%)
Flag of Mexico.svg  Mexico 80.4727102 (14%)67 (9%)557 (77%)
Flag of Russia.svg  Russia 76.68546109 (20%)328 (60%)109 (20%)
Flag of Egypt.svg  Egypt 68.392374 (8%)55 (6%)794 (86%)
Flag of Iraq.svg  Iraq 662,097147 (7%)315 (15%)1657 (79%)
Flag of Australia (converted).svg  Australia 59.842,782445 (16%)306 (11%)2058 (74%)
Flag of Brazil.svg  Brazil 58.0729783 (28%)52 (17%)162 (55%)
Flag of Thailand.svg  Thailand 57.3184140 (5%)41 (5%)760 (90%)
Flag of Uzbekistan.svg  Uzbekistan 562,015141 (7%)60 (3%)1813 (90%)
Flag of Italy.svg  Italy 45.4755151 (20%)272 (36%)332 (44%)
Flag of Canada (Pantone).svg  Canada 45.081,330260 (20%)913 (69%)157 (12%)
Flag of Turkey.svg  Turkey 40.153074 (15%)58 (11%)393 (74%)
Flag of Bangladesh.svg  Bangladesh 35.8725325 (10%)5 (2%)222 (88%)

India

Working rice paddies Le labourage a l'aide de buffles.jpg
Working rice paddies

India has 20 percent of the Earth's population, but only four percent of its water. Water tables are dropping rapidly in some of India's main agricultural areas.

India has the largest water withdrawal out of all the countries in the world. Eighty-six percent of that water supports agriculture. [17] That heavy use is dictated in large part by what people eat. People in India consume a lot of rice. Rice farmers in India typically get less than half the yield per unit area while using ten times more water than their Chinese counterparts. Economic development can make things worse because as people's living standards rise, they tend to eat more meat, which requires much water to produce. Growing a tonne of grain requires 1,000 tonnes of water; producing a tonne of beef requires 15,000 tonnes. To make a single hamburger requires around 4,940 liters (1,300 gallons) of water. [18] To produce a glass of orange juice requires 850 liters (225 gallons) of freshwater. [19]

China

China, the world's most populous country, has the second largest water withdrawal; 68% supports agriculture while its growing industrial base consumes 26%. [17] China is facing a water crisis where water resources are overallocated, used inefficiently, and severely polluted by human and industrial wastes. One-third of China's population lacks access to safe drinking water. Rivers and lakes are dead and dying, groundwater aquifers are over-pumped, uncounted species of aquatic life have been driven to extinction, and direct adverse impacts on both human and ecosystem health are widespread and growing.

In western China's Qinghai, through which the Yellow River’s main stream flows, more than 2,000 lakes have disappeared over the last 20 years. There were once 4,077 lakes. [20] Global climate change is responsible for the reduction in flow of the (Huang He) Yellow River over the past several decades. The source of the Yellow River is the Qinghai-Xizang Tibetan plateau where the glaciers are receding sharply. [21]

In Hebei, which surrounds Beijing, the situation is much worse. Hebei is one of China's major wheat and corn growing provinces. The water tables have been falling fast throughout Hebei. The region has lost 969 of its 1,052 lakes. [20] About 500,000 people are affected by a shortage of drinking water due to continuing droughts. Hydro-power generation is also impacted. [22] Beijing and Tianjin depend on Hebei Province to supply their water from the Yangtze River. Beijing gets its water via the newly constructed South-North Water Transfer Project. [23] The river originates in a glacier on the eastern part of the Tibetan Plateau.

United States

Ship canal terminus Ship canal terminus.jpg
Ship canal terminus

The United States has about 5% of the world's population, yet it uses almost as much water as India (~1/5 of world) or China (1/5 of world) because substantial amounts of water are used to grow food exported to the rest of the world. The United States agricultural sector consumes more water than the industrial sector, though substantial quantities of water are withdrawn (but not consumed) for power plant cooling systems. [17] 40 out of 50 state water managers expect some degree of water stress in their state in the next 10 years. [24]

The Ogallala Aquifer in the southern high plains (Texas and New Mexico) is being mined at a rate that far exceeds replenishment—a classic example of peak non-renewable water. Portions of the aquifer will not naturally recharge due to layers of clay between the surface and the water-bearing formation, and because rainfall rates simply do not match rates of extraction for irrigation. [25] The term fossil water is sometimes used to describe water in aquifers that was stored over centuries to millennia. Use of this water is not sustainable when the recharge rate is slower than the rate of groundwater extraction.

In California, large amounts of groundwater are also being withdrawn from Central Valley groundwater aquifers. [26] California's Central Valley is home to one-sixth of all irrigated land in the United States, and the state leads the nation in agricultural production and exports. The inability to sustain groundwater withdrawals over time may lead to adverse impacts on the region's agricultural productivity.

The Central Arizona Project (CAP) is a 336-mile (541 km) long canal that diverts 489 billion US gallons (1.85×10⁹ m3) a year from the Colorado River to irrigate more than 300,000 acres (1,200 km2) of farmland. The CAP project also provides drinking water for Phoenix and Tucson. It has been estimated that Lake Mead, which dams the Colorado, has a 50-50 chance of running dry by 2021. [27]

The Ipswich River near Boston now runs dry in some years due to heavy pumping of groundwater for irrigation. Maryland, Virginia and the District of Columbia have been fighting over the Potomac River. In drought years like 1999 or 2003, and on hot summer days the region consumes up to 85 percent of the river's flow. [28]

Per capita withdrawal of water

Turkmenistan, Australia and Guyana use the most water per capita. See the table below:

Freshwater withdrawal by country and sector (top 15 countries, per capita) [29]
Per capita withdrawalTotal freshwater withdrawalDomestic useIndustrial useAgricultural use
Country(km3/yr)(m3/p/yr)(%)(%)(%)
Flag of Turkmenistan.svg  Turkmenistan 5,409283394
Flag of Australia (converted).svg  Australia 2,78259.84161174
Flag of Guyana.svg  Guyana 2,1541.642198
Flag of Iraq.svg  Iraq 2,0976671579
Flag of Uzbekistan.svg  Uzbekistan 2,015567390
Flag of Tajikistan.svg  Tajikistan 1,62511.55491
Flag of Chile.svg  Chile 1,55826.741086
Flag of the United States.svg  USA 1,518482.2134641
Flag of Kyrgyzstan (2023).svg  Kyrgyzstan 1,44183493
Flag of Azerbaijan.svg  Azerbaijan 1,3671,48942076
Flag of Estonia.svg  Estonia 1,3441.83961
Flag of Canada (Pantone).svg  Canada 1,33045.08206911
Flag of Suriname.svg  Suriname 1,2780.674393
Flag of Iran.svg  Iran 1,24393.37192
Flag of New Zealand.svg  New Zealand 1,1154.822474
Flag of Uruguay.svg  Uruguay 1,0973.711287
Flag of East Timor.svg  Timor-Leste 1,0641.178191

Turkmenistan

Orphaned ship in former Aral Sea, near Aral, Kazakhstan Aralship2.jpg
Orphaned ship in former Aral Sea, near Aral, Kazakhstan

Turkmenistan gets most of its water from the Amu Darya River. The Qaraqum Canal is a canal system that takes water from the Amu Darya River and distributes the water out over the desert for irrigation of its orchard crops and cotton. [30] Turkmenistan uses the most water per capita in the world because only 55% of the water delivered to the fields actually reaches the crops. [17] [31]

Kazakhstan and Uzbekistan

The two rivers feeding the Aral Sea were dammed up and the water was diverted to irrigate the desert so that cotton could be produced. As a result, the Aral Sea's water has become much saltier and the sea's water level has decreased by over 60%. Drinking water is now contaminated with pesticides and other agricultural chemicals and contains bacteria and viruses. The climate has become more extreme in the area surrounding it. [32]

Water shortfall by country

Saudi Arabia, Libya, Yemen and United Arab Emirates have hit peaks in water production and are depleting their water supply. See the table below:

Freshwater shortfall by country (top 15 countries) [33]
Total freshwater withdrawalTotal freshwater supplyTotal freshwater shortfall
Region and country(km3/yr)(km3/yr)(km3/yr)
Flag of Saudi Arabia.svg  Saudi Arabia 17.322.414.9
Flag of Libya.svg  Libya 4.270.63.7
Flag of Yemen.svg  Yemen 6.634.12.5
Flag of the United Arab Emirates.svg  United Arab Emirates 2.30.22.2
Flag of Kuwait.svg  Kuwait 0.440.020.4
Flag of Oman.svg  Oman 1.361.00.4
Flag of Israel.svg  Israel 2.051.70.4
Flag of Qatar.svg  Qatar 0.290.10.2
Flag of Bahrain.svg  Bahrain 0.30.10.2
Flag of Jordan.svg  Jordan 1.010.90.1
Flag of Barbados.svg  Barbados 0.090.10.0
Flag of Maldives.svg  Maldives 0.0030.030.0
Antigua and Barbuda 0.0050.10.0
Flag of Malta.svg  Malta 0.020.07-0.1
Flag of Cyprus.svg  Cyprus 0.210.4-0.2

Saudi Arabia

Water supply in Saudi Arabia, 1980-2000, in millions of cubic meters. SaudiArabiaWaterSupply1980-2000inMCM.png
Water supply in Saudi Arabia, 1980–2000, in millions of cubic meters.

According to Walid A. Abderrahman (2001), "Water Demand Management in Saudi Arabia", Saudi Arabia reached peak water in the early 1990s, at more than 30 billion cubic meters per year, and declined afterward. The peak had arrived at about midpoint, as expected for a Hubbert curve. [35] Today, the water production is about half the peak rate. Saudi Arabian food production has been based on "fossil water"—water from ancient aquifers that is being recharged very slowly, if at all. Like oil, fossil water is non-renewable, and it is bound to run out someday. Saudi Arabia has abandoned its self-sufficient food production and is now importing virtually all of its food. [34] Saudi Arabia has built desalination plants to provide about half the country's freshwater. The remainder comes from groundwater (40%), surface water (9%) and reclaimed wastewater (1%).

Libya

Libya is working on a network of water pipelines to import water, called the Great Manmade River. It carries water from wells tapping fossil water in the Sahara desert to the cities of Tripoli, Benghazi, Sirte and others. Their water also comes from desalination plants. [36]

Yemen

Peak water has occurred in Yemen. [37] [38] Sustainability is no longer attainable in Yemen, according to the government's five-year water plan for 2005–2009. [39] The aquifer that supplies Sana'a, the capital of Yemen, could be depleted as early as 2017. "Sana'a running out of water with no plan to save it". The Global Urbanist. 23 March 2010. Retrieved 3 October 2017. In its search for water in the basin, the Yemeni government has drilled test wells that are 2 kilometers (1.2 mi) deep, depths normally associated with the oil industry, but it has failed to find water. Yemen must soon choose between relocating the city and building a pipeline to coastal desalination plants. [40] The pipeline option is complicated by Sana'a's altitude of 2,250 m (7,380 ft).

As of 2010, the threat of running out of water was considered greater than that of Al-Qaeda or instability. There was speculation that Yemenis would have to abandon mountain cities, including Sana'a, and move to the coast. The cultivation of khat and poor water regulation by the government were partly blamed. [41]

United Arab Emirates

Desalination plant in Ras al-Khaimah, UAE Desalination plant RAK.jpg
Desalination plant in Ras al-Khaimah, UAE

The United Arab Emirates have a rapidly growing economy and very little water to support it. The UAE requires more water than is naturally available, thus, it has reached peak water. To solve this, the UAE has a desalination plant near Ruwais and ships its water via pipeline to Abu Dhabi. [42]

Consequences

Famine

Water shortage may cause famine in Pakistan. [43] [44] Pakistan has approximately 35 million acres (140,000 km2) of arable land irrigated by canals and tube wells, mostly using water from the Indus River. Dams were constructed at Chashma, Mangla, and Tarbela to feed the irrigation system. Since the completion of the Tarbela Dam in 1976 no new capacity has been added despite astronomical growth in population. The gross capacity of the three dams has decreased because of sedimentation, a continual process. Per-capita surface-water availability for irrigation was 5,260 cubic meters per year in 1951. This has been reduced to a mere 1,100 cubic meters per year in 2006.

Health problems

The quality of drinking water is vital for human health. Peak water constraints result in people not having access to safe water for basic personal hygiene. "Infectious waterborne diseases such as diarrhea, typhoid, and cholera are responsible for 80 percent of illnesses and deaths in the developing world, many of them children. One child dies every eight seconds from a waterborne disease; 15 million children a year." [45]

Vital aquifers everywhere are becoming contaminated with toxins. Once an aquifer is contaminated, it is not likely that it can ever recover. Contaminants are more likely to cause chronic health effects. Water can be contaminated from pathogens such as bacteria, viruses, and parasites. Also, toxic organic chemicals can be a source of water contamination. Inorganic contaminants include toxic metals like arsenic, barium, chromium, lead, mercury, and silver. Nitrates are another source of inorganic contamination. Finally, leaching radioactive elements into the water supply can contaminate it. [46]

Human conflicts over water

Some conflicts of the future may be fought over the availability, quality, and control of water. Water has also been used as a tool in conflicts or as a target during conflicts that start for other reasons. [47] Water shortages may well result in water conflicts over this precious resource. [48]

In West Africa and other places like Nepal, Bangladesh, India (such as the Ganges Delta), and Peru, major changes in the rivers generate a significant risk of violent conflict in coming years. Water management and control could play a part in future resource wars over scarce resources. [49]

Solutions

Freshwater usage has great potential for better conservation and management as it is used inefficiently nearly everywhere, but until actual scarcity hits, people tend to take access to freshwater for granted.

Water conservation

There are several ways to reduce the use of water. [50] For example, most irrigation systems waste water; typically, only between 35% and 50% of water withdrawn for irrigated agriculture ever reaches the crops. Most soaks into unlined canals, leaks out of pipes, or evaporates before reaching (or after being applied to) the fields. Swales and cisterns can be used to catch and store excess rainwater.

Water should be used more efficiently in industry, which should use a closed water cycle if possible. Also, industry should prevent polluting water so that it can be returned into the water cycle. Whenever possible, gray wastewater should be used to irrigate trees or lawns. Water drawn from aquifers should be recharged by treating the wastewater and returning it to the aquifer. [51]

Water can be conserved by not allowing freshwater to be used to irrigate luxuries such as golf courses. Luxury goods should not be produced in areas where freshwater has been depleted. For example, 1,500 liters of water is used on average for the manufacturing of a single computer and monitor. [52]

In Ladakh, a high plateau behind the Himalaya, villagers helped by an engineer and school students build ice stupa as water storage to favour water at spring as natural glaciers retreat. [53]

Water management

Sustainable water management involves the scientific planning, developing, distribution and optimization of water resources under defined water policies and regulations. Examples of policies that improve water management include the use of technology for efficiency monitoring and use of water, innovative water prices and markets, irrigation efficiency techniques, and much more. [54]

Experience shows that higher water prices lead to improvements in the efficiency of use—a classical argument in economics, pricing, and markets. For example, Clark County, Nevada, raised its water rates in 2008 to encourage conservation. [55] Economists propose to encourage conservation by adopting a system of progressive pricing whereby the price per unit of water used would start out very small, and then rise substantially for each additional unit of water used. This tiered-rate approach has been used for many years in many places, and is becoming more widespread. [56] A Freakonomics column in the New York Times similarly suggested that people would respond to higher water prices by using less of it, just as they respond to higher gasoline prices by using less of it. [57] The Christian Science Monitor has also reported on arguments that higher water prices curb waste and consumption. [58]

In his book The Ultimate Resource 2, Julian Simon claimed that there is a strong correlation between government corruption and lack of sufficient supplies of safe, clean water. Simon wrote, "there is complete agreement among water economists that all it takes to ensure an adequate supply for agriculture as well as for households in rich countries is that there be a rational structure of water law and market pricing. The problem is not too many people but rather defective laws and bureaucratic interventions; freeing up markets in water would eliminate just about all water problems forever... In poor water-short countries the problem with water supply—as with so many other matters—is lack of wealth to create systems to supply water efficiently enough. As these countries become richer, their water problems will become less difficult". [59] This theoretical argument, however, ignores real-world conditions, including strong barriers to open water markets, the difficulty of moving water from one region to another, inability of some populations to pay for water, and grossly imperfect information on water use. Actual experience with peak water constraints in some wealthy, but water-short countries and regions still suggests serious difficulties in reducing water challenges.[ citation needed ]

Climate change

Extensive research has shown the direct links between water resources, the hydrologic cycle, and climatic change. As climate changes, there will be substantial impacts on water demands, precipitation patterns, storm frequency and intensity, snowfall and snowmelt dynamics, and more. Evidence from the IPCC to Working Group II, has shown climate change is already having a direct effect on animals, plants and water resources and systems. A 2007 report by the Intergovernmental Panel on Climate Change counted 75 million to 250 million people across Africa who could face water shortages by 2020. [60] Crop yields could increase by 20% in East and Southeast Asia, but decrease by up to 30% in Central and South Asia. Agriculture fed by rainfall could drop by 50% in some African countries by 2020. [61] A wide range of other impacts could affect peak water constraints.

Loss of biodiversity can be attributed largely to the appropriation of land for agroforestry and the effects of climate change. The 2008 IUCN Red List warns that long-term droughts and extreme weather puts additional stress on key habitats and, for example, lists 1,226 bird species as threatened with extinction, which is one-in-eight of all bird species. [62] [63]

Backstop water sources

The concept of a "backstop" resource is a resource that is sufficiently abundant and sustainable to replace non-renewable resources. Thus, solar and other renewable energy sources are considered "backstop" energy options for unsustainable fossil fuels. Similarly, Gleick and Palaniappan defined "backstop water sources" to be those resources that can replace unsustainable and non-renewable use of water, albeit typically at a higher cost. [1] The classic backstop water source is desalination of seawater. If the rate of water production is not sufficient in one area, another "backstop" could be increased interbasin transfers, such as pipelines to carry freshwater from where it is abundant to an area where water is needed. [50] Water can be imported into an area using water trucks. [50] The most expensive and last resort measures of getting water to a community such as desalination, water transfers are called "backstop" water sources. [10] Fog catchers are the most extreme of backstop methods.

To produce that fresh water, it can be obtained from ocean water through desalination. [50] A 17 January 2008 article in The Wall Street Journal stated, "World-wide, 13,080 desalination plants produce more than 12 billion US gallons (45,000,000 m3) of water a day, according to the International Desalination Association". [64] In 2005 Israel was desalinizing water at a cost of US$0.53 per cubic meter. [65] In 2006 Singapore was desalinizing water for US$0.49 per cubic meter. [66] In 2008 after being desalinized at Jubail, Saudi Arabia, water was pumped 200 miles (320 km) inland though a pipeline to the capital city of Riyadh. [67]

However, several factors prevent desalination from being a panacea for water shortages: [68]

Nevertheless, some countries like Spain increasingly rely on desalination because costs of the technology continue to drop. [69]

At last resort, it is possible in some particular regions to harvest water from fog using nets. The water from the nets drips into a tube. The tubes from several nets lead to a holding tank. Using this method, small communities on the edge of deserts can get water for drinking, gardening, showering and clothes washing. [70] Critics say that fog catchers work in theory but have not succeeded as well in practice. This is due to the high expense of the nets and pipe, high maintenance costs and low quality of water. [71]

An alternative approach is that of the Seawater Greenhouse, which desalinates seawater inside a greenhouse, using evaporation and condensation powered by solar energy. Successful pilots have been conducted growing crops in desert locations.

See also

Other resource peaks

Related Research Articles

<span class="mw-page-title-main">Resource depletion</span> Depletion of natural organic and inorganic resources

Resource depletion is the consumption of a resource faster than it can be replenished. Natural resources are commonly divided between renewable resources and non-renewable resources. The use of either of these forms of resources beyond their rate of replacement is considered to be resource depletion. The value of a resource is a direct result of its availability in nature and the cost of extracting the resource. The more a resource is depleted the more the value of the resource increases. There are several types of resource depletion, including but not limited to: mining for fossil fuels and minerals, deforestation, pollution or contamination of resources, wetland and ecosystem degradation, soil erosion, overconsumption, aquifer depletion, and the excessive or unnecessary use of resources. Resource depletion is most commonly used in reference to farming, fishing, mining, water usage, and the consumption of fossil fuels. Depletion of wildlife populations is called defaunation.

<span class="mw-page-title-main">Water extraction</span> Process of taking water from any source

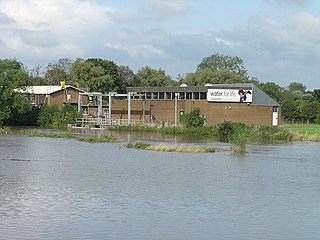
Water extraction is the process of taking water from any source, either temporarily or permanently, for flood control or to obtain water for, for example, irrigation. The extracted water could also be used as drinking water after suitable treatment.

<span class="mw-page-title-main">Groundwater</span> Water located beneath the ground surface

Groundwater is the water present beneath Earth's surface in rock and soil pore spaces and in the fractures of rock formations. About 30 percent of all readily available freshwater in the world is groundwater. A unit of rock or an unconsolidated deposit is called an aquifer when it can yield a usable quantity of water. The depth at which soil pore spaces or fractures and voids in rock become completely saturated with water is called the water table. Groundwater is recharged from the surface; it may discharge from the surface naturally at springs and seeps, and can form oases or wetlands. Groundwater is also often withdrawn for agricultural, municipal, and industrial use by constructing and operating extraction wells. The study of the distribution and movement of groundwater is hydrogeology, also called groundwater hydrology.

<span class="mw-page-title-main">Groundwater recharge</span> Groundwater that recharges an aquifer

Groundwater recharge or deep drainage or deep percolation is a hydrologic process, where water moves downward from surface water to groundwater. Recharge is the primary method through which water enters an aquifer. This process usually occurs in the vadose zone below plant roots and is often expressed as a flux to the water table surface. Groundwater recharge also encompasses water moving away from the water table farther into the saturated zone. Recharge occurs both naturally and through anthropogenic processes, where rainwater and/or reclaimed water is routed to the subsurface.

<span class="mw-page-title-main">Overdrafting</span> Unsustainable extraction of groundwater

Overdrafting is the process of extracting groundwater beyond the equilibrium yield of an aquifer. Groundwater is one of the largest sources of fresh water and is found underground. The primary cause of groundwater depletion is the excessive pumping of groundwater up from underground aquifers.

<span class="mw-page-title-main">Surface water</span> Water located on top of land forming terrestrial bodies of water

Surface water is water located on top of land, forming terrestrial waterbodies, and may also be referred to as blue water, opposed to the seawater and waterbodies like the ocean.

<span class="mw-page-title-main">Water supply and sanitation in Saudi Arabia</span>

Water supply and sanitation in Saudi Arabia is characterized by challenges and achievements. One of the main challenges is water scarcity. In order to overcome water scarcity, substantial investments have been undertaken in seawater desalination, water distribution, sewerage and wastewater treatment. Today about 50% of drinking water comes from desalination, 40% from the mining of non-renewable groundwater and only 10% from surface water in the mountainous southwest of the country. The capital Riyadh, located in the heart of the country, is supplied with desalinated water pumped from the Persian Gulf over a distance of 467 km. Water is provided almost for free to residential users. Despite improvements, service quality remains poor, for example in terms of continuity of supply. Another challenge is weak institutional capacity and governance, reflecting general characteristics of the public sector in Saudi Arabia. Among the achievements is a significant increases in desalination, and in access to water, the expansion of wastewater treatment, as well as the use of treated effluent for the irrigation of urban green spaces, and for agriculture.

<span class="mw-page-title-main">Water scarcity</span> Lack of fresh water resources to meet water demand

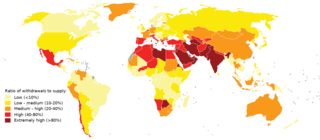
Water scarcity is the lack of fresh water resources to meet the standard water demand. There are two type of water scarcity namely physical and economic water scarcity. Physical water scarcity is where there is not enough water to meet all demands, including that needed for ecosystems to function. Arid areas for example Central Asia, West Asia, and North Africa often experience physical water scarcity. Economic water scarcity on the other hand, is the result of lack of investment in infrastructure or technology to draw water from rivers, aquifers, or other water sources. It also results from weak human capacity to meet water demand. Much of Sub-Saharan Africa experiences economic water scarcity.

<span class="mw-page-title-main">Water resources</span> Sources of water that are potentially useful

Water resources are natural resources of water that are potentially useful for humans, for example as a source of drinking water supply or irrigation water. 97% of the water on Earth is salt water and only three percent is fresh water; slightly over two-thirds of this is frozen in glaciers and polar ice caps. The remaining unfrozen freshwater is found mainly as groundwater, with only a small fraction present above ground or in the air. Natural sources of fresh water include surface water, under river flow, groundwater and frozen water. Artificial sources of fresh water can include treated wastewater and desalinated seawater. Human uses of water resources include agricultural, industrial, household, recreational and environmental activities.

Water supply and sanitation in Israel are intricately linked to the historical development of Israel. Because rain falls only in the winter, and largely in the northern part of the country, irrigation and water engineering are considered vital to the country's economic survival and growth. Large scale projects to desalinate seawater, direct water from rivers and reservoirs in the north, make optimal use of groundwater, and reclaim flood overflow and sewage have been undertaken. Among them is the National Water Carrier, carrying water from the country's biggest freshwater lake, the Sea of Galilee, to the northern part of the Negev desert through channels, pipes and tunnels. Israel's water demand today outstrips available conventional water resources. Thus, in an average year, Israel relies for about half of its water supply on unconventional water resources, including reclaimed water and desalination. A particularly long drought in 1998–2002 had prompted the government to promote large-scale seawater desalination. In 2022, 85% of the country's drinkable water was produced through desalination of saltwater and brackish water.

The water resources management system in Uruguay has been influenced by the general sense of water as an abundant resource in the country. Average annual rainfall is 1,182 mm, representing a contribution of 210 km3 annually throughout its territory. In 2002, the per capita renewable water resources was 41,065 cubic meters, way above the world average 8,467 m3 in 2006. Uruguay also shares one of the largest groundwater reserves in the world, the Guarani Aquifer, with Brazil, Argentina, Paraguay. The Guarani aquifer covers 1,200,000 square kilometers and has a storage capacity of 40,000 km3.

<span class="mw-page-title-main">Water resources management in Argentina</span>

Water resources management (WRM) functions in Argentina are handled by multiple institutions operating at the national, provincial, and river basin level, with a variety of functions and jurisdictions. On the national level, the National Institute for Water and the Environment (INA) and the National Water and Sanitation Utility (AySA) are charged with the duties of researching, water resources preservation, developing services, and implementing water projects.

<span class="mw-page-title-main">Water resources management in Syria</span>

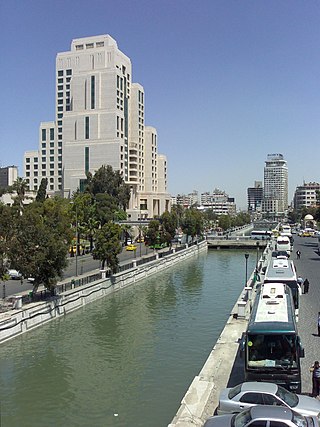
Water resources management in Syria is confronted with numerous challenges. First, all of the country's major rivers are shared with neighboring countries, and Syria depends to a large extent on the inflow of water from Turkey through the Euphrates and its tributaries. Second, high population growth and urbanisation increase the pressure on water resources, resulting in localized groundwater depletion and pollution, for example in the Ghouta near Damascus. Third, there is no legal framework for integrated water resources management. Finally, the institutions in charge of water resources management are weak, being both highly centralized and fragmented between sectors, and they often lack the power to enforce regulations. Water resources policies have been focused on the construction of dams, the development of irrigated agriculture and occasional interbasin transfers, such as a pipeline to supply drinking water to Aleppo from the Euphrates. There are 165 dams in Syria with a total storage capacity of 19.6 km3. Demand management through metering, higher tariffs, more efficient irrigation technologies and the reduction of non-revenue water in drinking water supply has received less emphasis than supply management. The government implements a large program for the construction of wastewater treatment plants including the use of reclaimed water for irrigation.

The three cities of Abu Dhabi Emirate within the United Arab Emirates – the coastal city Abu Dhabi itself as well as the inland oases Al Ain and Liwa – receive their drinking water supply entirely from desalinated seawater.

<span class="mw-page-title-main">Water supply and sanitation in Namibia</span>

Namibia is an arid country that is regularly afflicted by droughts. Large rivers flow only along its northern and southern borders, but they are far from the population centers. They are also far from the country's mines, which are large water users. In order to confront this challenge, the country has built dams to capture the flow from ephemeral rivers, constructed pipelines to transport water over large distances, pioneered potable water reuse in its capital Windhoek located in the central part of Namibia, and built Sub-Saharan Africa's first large seawater desalination plant to supply a uranium mine and the city of Swakopmund with water. A large scheme to bring water from the Okavango River in the North to Windhoek, the Eastern National Water Carrier, was only partially completed during the 1980s.

<span class="mw-page-title-main">Water scarcity in Iran</span> Water shortage of Iran

Water scarcity in Iran is caused by high climatic variability, uneven distribution of water, over exploitation of available water resources,and prioritization of economic development. Water scarcity in Iran is further exacerbated by climate change.

<span class="mw-page-title-main">Environmental issues in Israel</span>

The State of Israel is one of the smallest countries in the world, around 20,000 sq. km, and has relatively few natural resources. Due to its limited space, semi-arid climate, high population growth and resource scarcity, Israel is highly susceptible to environmental crises. These include water shortages and pollution, shrinking of the Dead Sea, waste production and disposal, air pollution and population density. As a result, resource development, in particular water, has benefited from relatively high government support throughout most of the country's history. For example, Israel's water conservation and reclamation infrastructure is one of the most advanced in the world, with approximately half its water supply derived from reclaimed and treated waste water, brackish water and desalinated water.

<span class="mw-page-title-main">Fresh water</span> Naturally occurring water with low amounts of dissolved salts

Fresh water or freshwater is any naturally occurring liquid or frozen water containing low concentrations of dissolved salts and other total dissolved solids. Although the term specifically excludes seawater and brackish water, it does include non-salty mineral-rich waters such as chalybeate springs. Fresh water may encompass frozen and meltwater in ice sheets, ice caps, glaciers, snowfields and icebergs, natural precipitations such as rainfall, snowfall, hail/sleet and graupel, and surface runoffs that form inland bodies of water such as wetlands, ponds, lakes, rivers, streams, as well as groundwater contained in aquifers, subterranean rivers and lakes. Fresh water is the water resource that is of the most and immediate use to humans.

References

  1. 1 2 3 Gleick, P.H., M. Palaniappan. (June 2010). "Peak Water: Conceptual and Practical Limits to Freshwater Withdrawal and Use". Proceedings of the National Academy of Sciences . 107 (25): 11155–11162. doi: 10.1073/pnas.1004812107 . PMC   2895062 . PMID   20498082.{{cite journal}}: CS1 maint: multiple names: authors list (link)
  2. "The World's Water 2008-2009: The Biennial Report of Freshwater Resources (Pacific Institute)". Island Press, Washington D.C. 2009. Retrieved 26 January 2009.
  3. Brown, Lester R. (9 July 2013). "Plan B Updates - 115: Peak Water: What Happens When the Wells Go Dry?". earth-policy.org. Earth Policy Institute. Retrieved 8 February 2023.
  4. Gleick, P. & M. Palaniappan. (August 2011). "On the Waterfront" (PDF). Water Resources . 2: 41–49.
  5. "World's largest aquifer going dry". US Water News. February 2006. Archived from the original on 13 September 2006. Retrieved 26 January 2009.
  6. "Disappearing Lakes, Shrinking Seas: Selected Examples". Earth Policy Institute. Archived from the original on 3 September 2006. Retrieved 26 January 2009.
  7. Sifton, Sam & Grant Barrett. (18 December 2010). "The Words of the Year". The New York Times .
  8. "Global Environmental Outlook - GEO4 environment for development" (PDF). United Nations Environment Programme. 2007. p. 97. Archived from the original (PDF) on 31 October 2007. Retrieved 1 February 2009.
  9. M. King Hubbert (June 1956). "Nuclear Energy and the Fossil Fuels 'Drilling and Production Practice'" (PDF). API. p. 36. Archived from the original (PDF) on 27 May 2008. Retrieved 18 April 2008.
  10. 1 2 Meena Palaniappan & Peter H. Gleick (2008). "The World's Water 2008-2009, Ch 1" (PDF). Pacific Institute. Archived from the original (PDF) on 20 March 2009. Retrieved 31 January 2009.
  11. "Peak Water".[ permanent dead link ]
  12. Forecast of water usage as a percentage of renewable water resources broken down by World Bank regions from International Futures
  13. Igor Shiklomanov (1993). Peter H. Gleick (ed.). World fresh water resources, in Water in Crisis: A Guide to the World's Fresh Water Resources. Oxford University Press. pp. 13–24.
  14. Van Ginkel, J. A. (2002). Human Development and the Environment: Challenges for the United Nations in the New Millennium. United Nations University Press. pp. 198–199. ISBN   978-9280810691. Archived from the original on 25 April 2016.
  15. "The World's Water". Pacific Institute. 2014. pp. tables 1. Retrieved 10 November 2019.
  16. Pimentel, D., B. Berger, D. Filberto, M. Newton, B. Wolfe, E. Karabinakis, S. Clark, E. Poon, E. Abbett, and S. Nandagopal. (October 2004). "Water Resources: Agricultural and Environmental Issues". BioScience . 54 (10): 909–918. doi: 10.1641/0006-3568(2004)054[0909:WRAAEI]2.0.CO;2 .{{cite journal}}: CS1 maint: multiple names: authors list (link)
  17. 1 2 3 4 5 Peter H. Gleick (2008). "The World's Water 2008-2009". Island Press, Washington, D.C. pp. Table 2. Retrieved 28 January 2009.
  18. Vince Beiser (7 November 2007). "Earth: Worldwide Water Worries". PBS Wired Science. Archived from the original on 5 June 2008. Retrieved 1 February 2009.
  19. Lewis, Leo (22 January 2009). "Ecologists warn the planet is running short of water". The Times . London. Retrieved 1 February 2009.
  20. 1 2 Lester R. Brown (2006). Plan B 2.0: Rescuing a Planet Under Stress and a Civilization in Trouble. W. W. Norton & Company. Archived from the original on 31 March 2009. Retrieved 29 January 2009.
  21. David Cowhig (November 2006). "Research information bearing on the Yellow River ecological crisis". China Digital Times . Retrieved 29 January 2009.
  22. staff (21 April 2007). "Hebei province hit by drinking water shortage". China Daily . Retrieved 29 January 2009.
  23. staff (2008). "Hebei water to help Beijing tackle shortage". gsean. Archived from the original on 31 March 2009. Retrieved 29 January 2009.
  24. "Freshwater: Supply Concerns Continue, and Uncertainties Complicate Planning" (PDF). gao.gov. United States Government Accountability Office. May 2014. p. 33/100. Retrieved 9 March 2015. Specifically, 40 of 50 state water managers responding to our 2013 survey expected shortages in some portion of their states under average conditions in the next 10 years
  25. Nativ, Ronit (January 1992). "Recharge into Southern High Plains aquifer—possible mechanisms, unresolved questions". Environmental Geology . 19 (1): 21–32. Bibcode:1992EnGeo..19...21N. doi:10.1007/BF01740574. ISSN   0943-0105. S2CID   129219597.
  26. "NASA Data Reveal Major Groundwater Loss in California". NASA. 19 December 2009. Retrieved 9 January 2010.
  27. Matthew Power (21 April 2008). "Peak Water: Aquifers and Rivers Are Running Dry. How Three Regions Are Coping". Wired. Retrieved 27 January 2009.
  28. Bill McKibben (1 January 2006). "The End of Plenty - Getting Resourceful About Resources". The Washington Post . Retrieved 27 January 2009.
  29. "Freshwater Withdrawal, by Country and Sector (2013 Update)" (PDF).
  30. "Assessment of Water Resources". UNEP/GRID-Arendal . Retrieved 1 February 2009.
  31. "Turkmenistan Agriculture". Country-Studies.com. Retrieved 1 February 2009.
  32. "History of the Aral Sea". Oriental Express Central Asia . Retrieved 27 January 2009.
  33. "The World's Water". Pacific Institute. 2008. pp. tables 1 and 2. Retrieved 28 January 2009.
  34. 1 2 Walid A. Abderrahman (2001). "Water demand management in Saudi Arabia". IDRC. Archived from the original on 10 May 2009. Retrieved 1 February 2009.
  35. "The Oil Drum: Europe | Peak water in Saudi Arabia".
  36. Omar Salem (April 2007). "Water Resources Management in Libya" (PDF). Global Water Partnership Mediterranean. Retrieved 6 February 2009.
  37. Qahtan Yehya A.M. Al-Asbahi (20 June 2005). "Water Resources Information in Yemen" (PDF). United Nations. Retrieved 1 February 2009.
  38. "Water Resources available in Yemen". Food and Agriculture Organization. Archived from the original on 28 December 2008. Retrieved 24 March 2009.
  39. staff (24 January 2006). "YEMEN: Water shortages a looming disaster, say experts". IRIN - humanitarian news and analysis, UN Office for the Coordination of Humanitarian Affairs. Retrieved 1 February 2009.
  40. Lester R. Brown (9 August 2002). "Water deficits growing in many countries - Water Shortages May Cause Food Shortages". Great Lakes Directory. Archived from the original on 13 July 2009. Retrieved 7 February 2009.
  41. "Yemen's water crisis eclipses al Qaeda threat". Reuters. 17 February 2010.
  42. "Shuweihat Water Transmission Scheme, United Arab Emirates". water-technology.net. Retrieved 10 December 2017.
  43. "Water shortage may cause famine in Pakistan: STWC". Pakistan Defence. Archived from the original on 23 December 2011. Retrieved 7 March 2009.
  44. Altaf A. Memon (1 July 2004). "Evaluation of Impacts on the Lower Indus River Basin Due to Upstream Water Storage and Diversion". Proceedings, World Water & Environmental Resources Congress 2004, American Society of Civil Engineers, Environmental and Water Resources Institute, Salt Lake City, Utah. Archived from the original (Word) on 20 March 2009. Retrieved 7 March 2009.
  45. Hillary Mayell (5 June 2003). "UN Highlights World Water Crisis". National Geographic News. Archived from the original on 15 February 2004. Retrieved 7 February 2009.
  46. Sandra A. Zaslow & Glenda M. Herman (March 1996). "Health Effects of Drinking Water Contaminants". North Carolina State University. Archived from the original on 17 January 2008. Retrieved 8 February 2008.
  47. "Water Conflict Chronology: maps, list, chronology, sources". Pacific Institute. 2010. Retrieved 4 October 2010.
  48. http://news.bbc.co.uk/2/hi/africa/7959814.stm |publisher=BBC |date=19 August 2008 |accessdate=26 March 2009
  49. Leo Lewis (22 January 2009). "Ecologists warn the planet is running short of water". The Times . London. Retrieved 27 January 2009.
  50. 1 2 3 4 Michael Milstein (November 2009). "Radical Solutions for U.S. Southwest's Peak Water Problem". Popular Mechanics . Archived from the original on 23 February 2009. Retrieved 31 January 2009.
  51. "Artificial recharge of aquifers". Organization of American States . Retrieved 31 January 2009.
  52. Martyn Williams (7 March 2004). "UN Study: Think Upgrade Before Buying A New PC". IDG News Service . Retrieved 3 February 2009.
  53. Arati Kumar-Rao (16 June 2020). "One way to fight climate change: Make your own glaciers". National Geographic . Archived from the original on 16 June 2020. Retrieved 16 June 2020.
  54. Gleick, P.H. (28 November 2003). "Global Freshwater Resources: Soft-Path Solutions for the 21st Century". Science . 302 (5650): 1524–1528. Bibcode:2003Sci...302.1524G. CiteSeerX   10.1.1.362.9670 . doi:10.1126/science.1089967. PMID   14645837. S2CID   46191102.
  55. "Water: The more you use, the more you'll have to pay". Las Vegas Sun . 8 April 2008. Retrieved 24 March 2009.
  56. "The Water Shortage Myth". Forbes . 15 July 2008. Retrieved 24 March 2009.
  57. "Is Water Too Cheap?". The New York Times . 17 July 2008. Retrieved 24 March 2009.
  58. "Is water becoming 'the new oil'?". The Christian Science Monitor . 29 May 2008. Archived from the original on 12 March 2009. Retrieved 24 March 2009.
  59. "The Ultimate Resource II: People, Materials, and Environment". juliansimon.com. Retrieved 8 February 2023.
  60. Intergovernmental Panel on Climate Change (2007). Parry, M. L.; Canziani, O. F.; Palutikof, J. P.; van der Linden, P. J.; Hanson, C. E. (eds.). Climate Change 2007: Impacts, Adaptation and Vulnerability. Cambridge, UK: Cambridge University Press. Archived from the original on 5 October 2018. Retrieved 9 October 2014.
  61. "Billions face climate change risk". BBC News. 6 April 2007. Retrieved 22 May 2010.
  62. Kinver, Mark (19 May 2008). "Climate 'accelerating bird loss'". BBC News. Retrieved 22 May 2010.
  63. "Climate 'hitting Europe's birds'". BBC News. 4 March 2009. Retrieved 22 May 2010.
  64. Kranhold, Kathryn (17 January 2008). "Water, Water, Everywhere..." The Wall Street Journal. Retrieved 24 March 2009.
  65. Sitbon, Shirli (28 December 2005). "French-run water plant launched in Israel". European Jewish Press via ejpress.org. Archived from the original on 13 December 2009. Retrieved 24 March 2009.
  66. "Black & Veatch-Designed Desalination Plant Wins Global Water Distinction (Press release)". Black & Veatch Ltd., via edie.net. 4 May 2006. Archived from the original on 24 March 2010. Retrieved 24 March 2009.
  67. "Desalination is the Solution to Water Shortages". redOrbit. 2 May 2008. Retrieved 24 March 2009.{{cite journal}}: Cite journal requires |journal= (help)
  68. H. Cooley; P.H. Gleick; G. Wolff (2006). "Desalination, With a Grain of Salt". Pacific Institute, Oakland, California. Archived from the original on 17 October 2010. Retrieved 4 October 2010.
  69. J. Martínez Beltrán and S. Koo-Oshima Eds. (26 April 2004). "Water desalination for agricultural applications" (PDF). Food and Agriculture Organization. Archived from the original (PDF) on 6 July 2017. Retrieved 24 March 2009.
  70. "People living on desert edge catch water from fog clouds". CNN. 27 August 1996. Retrieved 3 February 2009.
  71. David Brooks (2002). "Water / Part 2. The Approaches". IDRC. Archived from the original on 1 April 2009. Retrieved 3 February 2009.

Books

Audio books