Poverty in Poland

Last updated

Poverty Headcount (% of population) living at below $4 (purchasing power adjusted) per day in Central and Eastern Europe, 1992-2009 (missing years were linearly interpolated). Poland is represented by the yellow line. Poverty rates in Central and Eastern Europe.png
Poverty Headcount (% of population) living at below $4 (purchasing power adjusted) per day in Central and Eastern Europe, 1992-2009 (missing years were linearly interpolated). Poland is represented by the yellow line.

Poverty in Poland has been relatively stable in the past decades, affecting (depending on measure) about 6.5% of the society. In the last decade there has been a lowering trend, as in general Polish society is becoming wealthier and the economy is enjoying one of the highest growth rates in Europe. There have been noticeable increases in poverty around the turns of the decades, offset by decreases in poverty in the years following those periods.

Contents

GDP per capita estimates for Western and Eastern Europe for 1937, as percent of UK GDP per capita. GDP per head Europe 1937.png
GDP per capita estimates for Western and Eastern Europe for 1937, as percent of UK GDP per capita.
Food distribution to poor people in Galicia (Sanok) Jan Gniewosz, Rozdawanie posilkow w Sanoku, 24.10.1847 r..jpg
Food distribution to poor people in Galicia (Sanok)
Distribution of loaves to the poor at Christmas Time in Poland (2015) 02015 1769 Weihnachten 2015 in Polen. Brot fur Bedurftige.JPG
Distribution of loaves to the poor at Christmas Time in Poland (2015)

Before WWII

During the Second Polish Republic, deep poverty characterized the country's farmers, who made up 70% of the population, a feature that worsened with the Great Depression. [2] [3] Per capita GNP in 1929 was lower than that of the neighboring Baltic states, [2] although, in 1937, higher than in Portugal or Greece. [1] While farm productivity was high in western Poland, it was much lower in southern and eastern areas, due to high population levels and relatively small farm size. In the country's central, southern and eastern regions, 6.5 million people were unable to satisfy their basic food needs by 1934–1935. In 1930–1931, farm laborers earned 54% of their low wages of two years earlier, with one noting his family's diet consisted of unseasoned potatoes, that the unaffordable price of soap meant they were covered in lice, and that a slice of bread was only for special occasions. An observer described the south as "a nightmare of degradation and poverty". By late 1934, rural Poles had an estimated purchasing capacity at 43% of the 1928 level. Urban consumers were aided by falling food prices, but jobs became scarcer, with industrial production in 1932 at 58% of the pre-depression level, and unemployment above 40% in 1932–1934. [2]

Poverty was acute among Polish Jews, who had among the highest rates of natural increase in Europe and were often unable to feed their children. [4] After the Peace treaty of Riga, the already numerous Jewish minority of the Second Polish Republic was joined by several hundred thousand refugees escaping pogroms in the East. More than 75 per cent of them lived in the urban areas, with higher than average number of women, children and the elderly. [5] Poland was struggling with remnants of devastating economic exploitation by the partitioners and their ensuing trade embargos (see also: German–Polish customs war). New job opportunities were mostly nonexistent before Poland's industrialization of the mid-1930s – although Jewish per capita income among the working population was more than 40% higher in 1929 than that of Polish non-Jews. [6] [7] [8] [9] The impoverished families relied on local Jewish charity, which had reached universally unprecedented proportions in 1929, providing services such as religion, education, health and other services to the amount of 200 million zlotys a year. [10]

Communist era

Under the communist regime state labour policy, income equalizing policies and subsidies to energy, food and housing helped to relieve poverty and made it less visible. [11] Rural workers' incomes were consistently lower than that of their urban counterparts, and poverty affected larger families living in the countryside with high numbers of children; but it also touched town dwellers: unskilled workers, pensioners, single and disabled people, single-parent families, families tied to alcoholism and crime, and young intelligentsia couples just starting independent lives. Family dysfunctions such as serious illness, elderly loneliness, abuse and alcoholism were correlated with poverty, as well as dramatic incidents in people's lives. Those living in poverty tended to have substandard housing, an inability to seek help from institutions, low education levels; they sometimes turned to crime and excessive drinking. [12]

The most common site of poverty was among retirees and those receiving disability payments; one 1979 estimate indicates that 40-50% of pensioners and disabled families lived at or below the social minimum. Next came workers in the lowest income categories (agricultural and unskilled workers, as well as labourers). In 1974, 48% of workers were in low income groups, while in 1979, 10% of people in workers' families were below the social minimum level. A dissenting view is that poverty did not affect employed individuals and their families, as full employment guaranteed subsistence, if at a modest standard. Families with several children came next; in 1974, 60% of children lived in families below the social minimum. [12]

Poverty was sometimes very deep, close to the subsistence minimum; this was the case for single, old and disabled pensioners; other times, it was partial, not affecting people's entire lives. For instance, a lack of adequate accommodation could impact a family's finances. The most common response to money troubles was to take on additional jobs, whether formal or informal, legal or illegal. One innovation was to wait in a queue on behalf of someone else, for a fee. Such practices meant that serious time shortages often came with poverty. As people started doing more at home to save or earn cash (producing food and clothing, repairing, painting apartments), time pressure damaged family life, so that lack of leisure time was a very widespread phenomenon among poor families. [13]

Concurrently, the state tended to neglect the problem: a 1983 work claims that social assistance fulfilled 14% of poor people's needs. Institutions were not proactively interested in bettering people's lives, while the poor had little awareness of their rights. Official ideology saw poverty as a marginal phenomenon caused by unusual life events and pathology, rather than being a usual part of life. In the 1980s, as economic depression and the shortage economy took hold, poverty changed from afflicting the marginalized and the maladapted, to include those willing and able to work. [14]

There are various estimates of poverty's extent in Communist Poland. Using the social minimum level as a measure, the following figures are cited: 20% at the end of the 1960s; 28%, mostly employees, in 1975 (a secret official estimate); about 30% at the end of the 1980s; 14.2% in 1981, 27.2% in 1983, 25.3% in 1987 and 16.3% in 1989, according to the World Bank. One researcher found that the number of the poor increased from 3.3 million in 1978 to 8.6 million in 1987. By a stricter definition of poverty, figures for the end of the 1980s include 5-7%, 6% and 5-10%. [15]

Polish sociologists began analysing poverty almost as soon as sociology was established there. Early research institutions, such as the Institute of Social Economy in the Warsaw School of Economics, analysed poverty, unemployment and the interwar economic migrations. Aside from census data and family budget inquiries, poverty was documented by independent investigations and autobiographical materials. The advent of communism interrupted this research tradition; poverty became a political issue, a social, political and ideological taboo. It was dismissed as a remnant of the previous regime or a byproduct of transitional difficulties; poverty and the poor were labeled with euphemisms such as "sphere of deficiency" or "low-income groups". Book or report titles prior to 1989 never used the term "poverty", while the neglect it received can also be seen in the lack of policies or related legislation. Scientific investigations were limited, with the most important research taking place in periods of relative openness: the time after the Polish October, the early 1970s, and 1980–81. A number of important studies were published in spite of the prevailing ideology, but their publication was either seriously restricted or banned. [11]

Early post-communist era

It has been estimated that Poland began its transformation from communist to capitalist economy with about 20% of its population in poverty. [16] Poverty in Poland rose briefly in the period of 1990-1992 and has been largely diminishing since; it did however rise again in the late 1990s, following the slowdown in economic growth. [16] [17] In the years 1994–2001, the subjective poverty line remained relatively stable at about 33%; and the relative poverty line (poverty threshold) rose from 13.5% to 17%. [16] Absolute poverty - as defined by the World Bank, the percentage of population living on less than $4.30 per day - in the period 1997-1999 affected 8.4% of Polish population. [16] Estimates by other sources vary, however. According to Brzeziński (2011), in the years 1998-2003 absolute poverty in Poland has risen by about 8%, reaching (according to the Central Statistical Office (GUS) estimate) 18.1% in 2005, and dropping to 10.6% in 2008; an alternate measure suggests that in the period 2005-2008 absolute poverty fell from 12.3% to 5.6%. [18] Brzeziński (2011) notes that any rise in poverty in the period 1998-2005 was outdone by the drop in poverty in the years 2005–2008. [18]

The poverty headcount ratio as a function of the poverty line. The graphs show that regardless of the absolute poverty threshold chosen, poverty in Poland increased from 1992 to 1998, stayed constant until 2006 and then dropped from 2006 to 2009. Poverty in Poland.png
The poverty headcount ratio as a function of the poverty line. The graphs show that regardless of the absolute poverty threshold chosen, poverty in Poland increased from 1992 to 1998, stayed constant until 2006 and then dropped from 2006 to 2009.

According to the Polish Central Statistical Office (GUS) 2011 report, the poverty line in Poland has been decreasing in the last few years, down to about 6.5% in 2011. [19] The report notes, however, that this is mostly due to the fact that the nominal value of the poverty line in Poland has not changed since 2006, thus ignoring inflation. [19] If the poverty line were indexed to inflation, the report estimated that 11.4% of Polish households would be below it. [19] The poverty threshold was estimated at 16.7%. [19] Percent of population receiving less than the living wage was estimated at 6.7%. [19] Poverty has decreased as compared to a 2005 report, which had reported both poverty line and poverty threshold at 18.1%, and the percentage of population receiving less than the living wage at 12.3%. [20] In 2003, about 23% of households believed they lived below the poverty line (declaring that they saw their income as insufficient for basic needs). [20]

Overall, the levels of poverty in Poland have been reported as stable [19] [21] or on the decrease in the past years, but it is still a significant concern. [18] [22] The reduction in poverty slowed down or was partially reversed again in early 2010s, although as of early 2013 the datasets are still mostly preliminary and usually cover the period only up to 2011. [19] [23] [24]

Modern era since government shift in 2015

The Law and Justice party won the 2015 parliamentary election, first ever time with an outright majority—something no Polish party had done since the fall of communism, and with the emphasis on lowering income inequality in Poland. The party was founded in 2001 as a centrist and Christian democratic party. Initially the party was broadly pro-market. [25] It has adopted the social market economy rhetoric similar to that of western European Christian democratic parties. [26] [25] However, one of the major themes in the PiS party is balanced social structure and fighting the income inequality. Shortly after assuming power it is launched successful 500+ programme giving monthly monetary benefit of 500zł per child to all families with two or more children. While this is not a social welfare program since it has no conditions like income level nor "any other strings attached", it has most benefited low income families for whom this monetary transfer is significant boost to their disposable income and as such represents transfer of wealth between social groups in the society.

The 500+ program enjoys broad support in the society and in 2019 PiS has both extended the eligibility and added more programs aimed at lowering poverty. This has attracted significant criticism especially from the main opposition liberal party Platforma Obywatelska, and some international media, as the way to buy votes and as populist, anti-liberal agenda. [27] [28] [29] [30] PiS supports state provided universal health care, which is free to all citizens, however it is supplemented by growing private medical care with lower queues. [31]

Structural breakdown

Poverty in Poland has been described as "shallow", referring to the fact that few poor live significantly below the poverty line (as defined by World Bank); the at risk of poverty gap in Poland is estimated at 21%. [32]

In terms of geography, poverty was more likely to affect households in small towns and rural areas, as well as households in the east and north, with the highest poverty reported in Warmia-Mazury Voivodeship, Podlaskie Voivodeship, Lubelskie Voivodeship and Świętokrzyskie Voivodeship (see also: Poland A and B). [19]

Poverty was most prevalent for households suffering from unemployment, disability, and with multiple children. [19] The young are more likely to be affected by the poverty than the old, who are relatively well off due to generous pension system. [16] [19] [33] As such, poverty in Poland is relatively similar, in terms of structure, to that found in most other European countries. [16] Beblo et al. (2002) note that poverty in Poland is primarily caused by unemployment, insufficient aid to families with multiple children or from marginalized groups, and poor earnings in agricultural sector. [16] Brzeziński (2011) notes that the rise in poverty in late 1990s and early 2000s can be attributed to stagnant wages and pensions, and growing unemployment, and its subsequent decline, to economic growth and welfare policies. [18]

Poverty in Poland - international ranking

Population living under 1.90 and
3.20 dollar (PPP) a day (%)
(International poverty line)
Population living below national poverty line (%)
Country< $1.90 [34] < $3.20 [34] Year
Flag of Poland.svg  Poland 0.020.032017
Country World
Bank
[35]
Year CIA [36] YearOtherYear
Flag of Poland.svg  Poland 10.62008172003 est.

Income inequality

Income and consumption inequality in Poland, 1985-2009, as measured by the Gini Index. Income and consumption inequality in Poland, Gini index.png
Income and consumption inequality in Poland, 1985–2009, as measured by the Gini Index.

Since fall of communism in Poland in 1990, income inequality has substantially increased. [33] This has been caused by rising prosperity and to a lesser extent, impoverishment. [33] Rutkowski (1998) notes that "those who have gained from income changes are outnumbered by those who have lost. However, while the gains have been significant, the losses have been relatively small." [33] Those who have gained the most were well-educated, highly skilled white-collar workers and entrepreneurs. [33] Overall, families are more dependent on state assistance than before the transition, with family allowance and unemployment benefits being most important in reducing inequality. [33]

There is a widespread perception of widening wealth gap in Poland, although Rutkowski (1998) argues that it has more to do with social structure changes than actual gap in income distribution. [33]

Income inequality in Poland - international ranking

Key:
R/P 10%: The ratio of the average income of the richest 10% to the poorest 10%
R/P 20%: The ratio of average income of the richest 20% to the poorest 20%
Gini: Gini index, a quantified representation of a nation's Lorenz curve

UN: Data from the United Nations Development Programme.
CIA: Data from the Central Intelligence Agency's The World Factbook.
GPI: Data from the Global Peace Index.


CountryUN R/P
10% [38]
UN R/P
20% [39]
World Bank
Gini (%) [40]
WB Gini
(year)
CIA R/P
10% [41]
YearCIA Gini
(%) [42]
CIA Gini
(year)
GPI Gini
(%) [43]
Flag of Poland.svg  Poland 8.85.634.120098.7200234.22008

See also

Related Research Articles

<span class="mw-page-title-main">Gini coefficient</span> Measure of inequality of a distribution

In economics, the Gini coefficient, also known as the Gini index or Gini ratio, is a measure of statistical dispersion intended to represent the income inequality, the wealth inequality, or the consumption inequality within a nation or a social group. It was developed by Italian statistician and sociologist Corrado Gini.

<span class="mw-page-title-main">Poland</span> Country in Central Europe

Poland, officially the Republic of Poland, is a country in Central Europe. It is divided into 16 administrative voivodeship provinces, covering an area of 312,696 km2 (120,733 sq mi). Poland has a population of over 38 million and is the fifth-most populous member state of the European Union. Warsaw is the nation's capital and largest metropolis. Other major cities include Kraków, Wrocław, Łódź, Poznań, and Gdańsk.

<span class="mw-page-title-main">Economy of Poland</span>

The economy of Poland is an industrialised, mixed economy with a developed market that serves as the sixth-largest in the European Union by nominal GDP and fifth-largest by GDP (PPP). Poland boasts the extensive public services characteristic of most developed economies. Since 1988, Poland has pursued a policy of economic liberalisation but retained an advanced public welfare system. This includes universal free public healthcare and education, extensive provisions of free public childcare, and parental leave. The country is considered by many to be a successful post-communist state. It is classified as a high-income economy by the World Bank, ranking 20th worldwide in terms of GDP (PPP), 21st in terms of GDP (nominal), and 21st in the 2023 Economic Complexity Index.

In economics, shock therapy is a group of policies intended to be implemented simultaneously in order to liberalize the economy, including liberalization of all prices, privatization, trade liberalization, and stabilization via tight monetary policies and fiscal policies. In the case of post-Communist states, it was implemented in order to transition from a command economy to a market economy.

<span class="mw-page-title-main">Economic inequality</span> Distribution of income or wealth between different groups

Economic inequality is an umbrella term for a) income inequality or distribution of income, b) wealth inequality or distribution of wealth, and c) consumption inequality. Each of these can be measured between two or more nations, within a single nation, or between and within sub-populations.

<span class="mw-page-title-main">Income distribution</span> How a countrys total GDP is distributed amongst its population

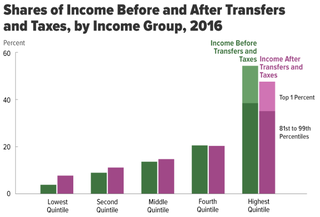
In economics, income distribution covers how a country's total GDP is distributed amongst its population. Economic theory and economic policy have long seen income and its distribution as a central concern. Unequal distribution of income causes economic inequality which is a concern in almost all countries around the world.

A transition economy or transitional economy is an economy which is changing from a centrally planned economy to a market economy. Transition economies undergo a set of structural transformations intended to develop market-based institutions. These include economic liberalization, where prices are set by market forces rather than by a central planning organization. In addition to this trade barriers are removed, there is a push to privatize state-owned enterprises and resources, state and collectively run enterprises are restructured as businesses, and a financial sector is created to facilitate macroeconomic stabilization and the movement of private capital. The process has been applied in China, the former Soviet Union and Eastern bloc countries of Europe and some Third world countries, and detailed work has been undertaken on its economic and social effects.

<span class="mw-page-title-main">Mława riot</span> 1991 riot in Mława, Poland

The Mława riot, or Mława incident, or Mława pogrom, was a series of violent devastations and looting incidents on 26–27 June 1991 when a group of youth estimated at 200 individuals, including young females, invaded the homes of Roma residents of the Polish town of Mława causing them to flee. Not a single Roma person was injured in the riot, but the material losses were substantial, affecting up to 40% of residences. Many perpetrators were arrested on-site; a number of them sentenced to jail after a trial. The violence was described as motivated by racism and jealousy. The incident that triggered the riot was the killing of a Polish pedestrian struck along with his companion in a hit-and-run by a Romani male driver.

<span class="mw-page-title-main">Income inequality in the United States</span>

Income inequality has fluctuated considerably in the United States since measurements began around 1915, moving in an arc between peaks in the 1920s and 2000s, with a 30-year period of relatively lower inequality between 1950 and 1980.

Poverty in Canada refers to the state or condition in which a person or household lacks essential resources—financial or otherwise—to maintain a modest standard of living in their community.

Michał Rutkowski is a Polish economist and a World Bank Regional Director for Human Development in the Europe and Central Asia region of the World Bank. Before July 1, 2023, he was Global Director for Social Protection, and Jobs in the World Bank. Before this position, he was Director for Multilateral Organizations (2015–16), and earlier he was World Bank Country Director for the Russian Federation and a Resident Representative in Moscow (2012–15). He is a former Director for human development in the South Asia region of the World Bank. He is the highest-ranked Polish official at the World Bank headquarters in Washington, DC, and also a former Director of the Office for Social Security Reform in the Government of Poland (1996–97), as well as a co-author of the design of the new Polish pension system. A graduate of the Warsaw School of Economics, with post-graduate studies at the London School of Economics (1989–90) and Harvard Business School (1999). Before joining the World Bank in 1990 Rutkowski was an assistant professor at the Warsaw School of Economics and did research work in the area of labor economics, macroeconomics, education, business development and productivity in the Centre for Labour Economics and the Centre for Economic Performance at the London School of Economics. As a member of the secretariat of the Consultative Economic Council to the Polish government he also advised on early issues of economic and social transition to a market economy in Poland. He was also involved in interdisciplinary development endeavors as a member of the Polish Association for the Club of Rome and the British Association for the Club of Rome.

<span class="mw-page-title-main">Welfare's effect on poverty</span>

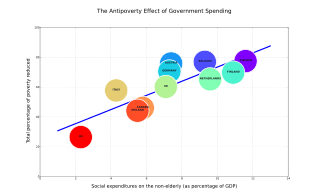
The effects of social welfare on poverty have been the subject of various studies.

<span class="mw-page-title-main">Welfare in Poland</span> Overview of welfare in Poland

Welfare in Poland is part of the social security system in Poland. It constitutes about 20% of government spending, and has been roughly stable in the past several decades. The Constitution of Poland states that all citizens have the right to social security in case of being unable to find a job, reaching the retirement age, or suffering from inability to work due to illness or disability. In detail, the law on welfare in Poland is covered by a 2003 law, updated several times, including in 2012.

<span class="mw-page-title-main">Unemployment in Poland</span> Overview of unemployment in Poland

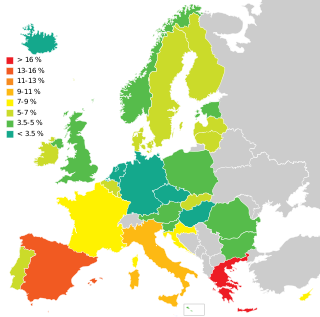
Unemployment in Poland appeared in the 19th century during industrialization, and was particularly severe during the Great Depression. Under communist rule Poland officially had close to full employment, although hidden unemployment existed. After Poland's transition to a market economy the unemployment rate sharply increased, peaking at above 16% in 1993, then dropped afterwards, but remained well above pre-1993 levels. Another period of high unemployment occurred in the early 2000s when the rate reached 20%. As Poland entered the European Union (EU) and its job market in 2004, the high unemployment set off a wave of emigration, and as a result domestic unemployment started a downward trend that continued until the onset of the 2008 Great Recession. Recent years have seen an increase in the unemployment rate from below 8% to above 10% (Eurostat) or from below 10% to 13% (GUS). The rate began dropping again in late 2013. Polish government (GUS) reported 9.6% registered unemployment in November 2015, while European Union's Eurostat gave 7.2%. According to Eurostat data, since 2008, unemployment in Poland has been constantly below the EU average. Significant regional differences in the unemployment rate exist across Poland.

Poverty in Cyprus is not well documented, yet is still considered a major problem by the Cypriot government. Due to strong kinship bonds among extended families, poverty in Cyprus primarily affects those outside kinship networks, such as immigrants, divorcees and singles from small families. One study found a strong correlation between increased poverty and small family size. Poverty is also more likely to affect the elderly than the young, as a result of income to pensions raising the dependency levels.

<span class="mw-page-title-main">Romani people in Poland</span> Ethnic minority group in Poland of Indo-Aryan origins

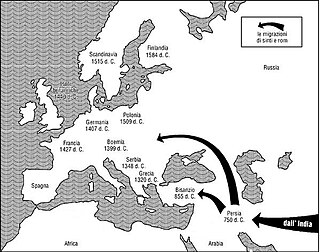
The Romani people, also known as the Roma, qualify as an ethnic minority group in Poland of Indo-Aryan origins. The Council of Europe regards the endonym "Roma" more appropriate when referencing the people, and "Romani" when referencing cultural characteristics. The term Cyganie is considered an exonym in Poland.

<span class="mw-page-title-main">Migrations from Poland since EU accession</span>

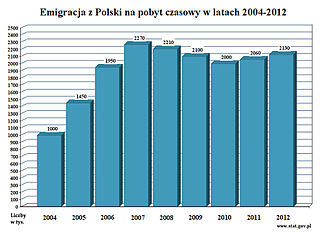
Since the fall of communism in 1989, the nature of migration to and from Poland has been in flux. After Poland's accession to the European Union and accession to the Schengen Area in particular, a significant number of Poles, estimated at over two million, have emigrated, primarily to the United Kingdom, Germany, France and Ireland. The majority of them, according to the Central Statistical Office of Poland, left in search of better work opportunities abroad while retaining permanent resident status in Poland itself.

Sweden enjoys a relatively low income inequality and a high standard of living. Unemployment as of 2017 was estimated to be 6.6% by the CIA World Fact Book, lower than in other European Union countries. The Nordic model of a social welfare society exemplified by Sweden and its near neighbours has often been considered a European success story compared internationally with the socioeconomic structures of other developed industrial nations. This model of state provided social welfare includes many unemployment benefits for the poor, and amply funded health, housing and social security provision. within essentially corruption free nations subscribing to principles of a measure of openness of information about government activity. The Income inequality in Sweden ranks low in the Gini coefficient, being 25.2 as of 2015 which is one of the lowest in the world, and ranking similarly to the other Nordic countries; although inequality has recently been on the rise and several central European countries now have a lower Gini coefficient than Sweden.

References

  1. 1 2 Harrison, Mark (1994). "GDPs of the USSR and Eastern Europe: Towards an Interwar Comparison" (PDF). Europe-Asia Studies. 46 (2): 243–259. CiteSeerX   10.1.1.587.4823 . doi:10.1080/09668139408412160.
  2. 1 2 3 Tim Rooth (1993). British Protectionism and the International Economy: Overseas Commercial Policy in the 1930s. Cambridge University Press. pp. 203–4. ISBN   978-0-5214-1608-5 . Retrieved 5 March 2013.
  3. Halik Kochanski (2012). The Eagle Unbowed: Poland and the Poles in the Second World War. Harvard University Press. p. 28. ISBN   978-0-6740-6816-2 . Retrieved 5 March 2013.
  4. Josef Marcus (1983). Social and Political History of the Jews in Poland, 1919-1939. Walter de Gruyter. p. 165. ISBN   978-9-0279-3239-6 . Retrieved 5 March 2013.
  5. Joseph Marcus, Social and political history of the Jews in Poland, 1919–1939 (ibidem) page 34
  6. Yehuda Bauer: A History of the American Jewish Joint Distribution Committee 1929–1939. Ibidem. Chapter 1. A Time of Crisis: 1929–1932
  7. T. Ron Jasinski-Herbert, Confrontation among neighbors Archived 2009-11-14 at the Wayback Machine , Conference at the U.S. Holocaust Memorial Museum, Washington
  8. "Trudności i osiągnięcia gospodarcze i kulturalne Polski okresu międzywojennego. 2). Odbudowa gospodarki". Serwis prawno-historyczny © 2006–2009. Archived from the original on 9 January 2010. Retrieved 13 June 2013.
  9. Joseph Marcus, Social and political history of the Jews in Poland, 1919–1939 (ibidem) page 41
  10. Joseph Marcus , Social and political history of the Jews in Poland, 1919–1939, (ibidem) page 47
  11. 1 2 Elżbieta Tarkowska (2001), in Rebecca Jean Emigh and Iván Szelényi (eds.). Poverty, Ethnicity, and Gender in Eastern Europe During the Market Transition . Greenwood Publishing Group. p. 85. ISBN   978-0-2759-6881-6. Retrieved 6 March 2013.
  12. 1 2 Elżbieta Tarkowska (2001), in Rebecca Jean Emigh and Iván Szelényi (eds.). Poverty, Ethnicity, and Gender in Eastern Europe During the Market Transition . Greenwood Publishing Group. p. 87. ISBN   978-0-2759-6881-6. Retrieved 6 March 2013.
  13. Elżbieta Tarkowska (2001), in Rebecca Jean Emigh and Iván Szelényi (eds.). Poverty, Ethnicity, and Gender in Eastern Europe During the Market Transition . Greenwood Publishing Group. p. 83. ISBN   978-0-2759-6881-6. Retrieved 6 March 2013.
  14. Elżbieta Tarkowska (2001), in Rebecca Jean Emigh and Iván Szelényi (eds.). Poverty, Ethnicity, and Gender in Eastern Europe During the Market Transition . Greenwood Publishing Group. p. 88. ISBN   978-0-2759-6881-6. Retrieved 6 March 2013.
  15. Elżbieta Tarkowska (2001), in Rebecca Jean Emigh and Iván Szelényi (eds.). Poverty, Ethnicity, and Gender in Eastern Europe During the Market Transition . Greenwood Publishing Group. p. 86-7. ISBN   978-0-2759-6881-6. Retrieved 6 March 2013.
  16. 1 2 3 4 5 6 7 Miriam Beblo, Stanisława Golinowska, Charlotte Lauer, Katarzyna Piętka, Agnieszka Sowa, Poverty Dynamics in Poland Selected quantitative analyses, CASE – Center for Social and Economic Research, Warsaw 2002, 2002. P. 30-31, 34-45
  17. Jan J. Rutkowski (1998). Welfare and the Labor Market in Poland: Social Policy During Economic Transition. World Bank Publications. p. 64. ISBN   978-0-8213-4318-0 . Retrieved 3 March 2013.
  18. 1 2 3 4 Michał Brzeziński, Accounting for recent trends in absolute poverty in Poland: A decomposition analysis, Working Paper, 2011 "Accounting for recent trends in absolute poverty in Poland: A decomposition analysis" (PDF). www.wne.uw.edu.pl. Retrieved 11 September 2023.
  19. 1 2 3 4 5 6 7 8 9 10 "GUS - Główny Urząd Statystyczny - Ubóstwo w Polsce w 2011r" (in Polish). Stat.gov.pl. 31 May 2012. Retrieved 3 March 2013.
  20. 1 2 "GUS - Główny Urząd Statystyczny - Zasięg ubóstwa materialnego w 2005 r" (in Polish). Stat.gov.pl. 18 July 2006. Retrieved 3 March 2013.
  21. "Interpelacja nr 5181 - tekst odpowiedzi". Sejm.gov.pl. Retrieved 3 March 2013.
  22. "Poland". Socialwatch.eu. Retrieved 3 March 2013.
  23. "Po latach spadków poziom ubóstwa w Polsce znów rośnie | Forsal.pl - Giełda, Waluty, Finanse". Forsal.pl. 20 June 2012. Retrieved 3 March 2013.
  24. Kasat Sp. z o.o. (1 June 2012). "Ubóstwo w Polsce 2011 - eGospodarka.pl - Raporty i prognozy". eGospodarka.pl. Retrieved 3 March 2013.
  25. 1 2 Tiersky, Ronald; Jones, Erik (2007). Europe Today: a Twenty-first Century Introduction . Lanham: Rowman & Littlefield. p.  392. ISBN   978-0-7425-5501-3.
  26. Bale, Tim; Szczerbiak, Aleks (December 2006). "Why is there no Christian Democracy in Poland (and why does this matter)?". SEI Working Paper (91). Sussex European Institute.{{cite journal}}: Cite journal requires |journal= (help)
  27. Stijn van Kessel (2015). Populist Parties in Europe: Agents of Discontent?. Palgrave Macmillan UK. p. 145. ISBN   978-1-137-41411-3.
  28. Łukasz Warzecha (20 April 2018). "PiS, Czyli Populizm i Socjalizm" [PiS means Populism and Socialism] (in Polish). Retrieved 29 May 2019.
  29. Traub, James (2 November 2016). "The Party That Wants to Make Poland Great Again". The New York Times Magazine .
  30. Adekoya, Remi (25 October 2016). "Xenophobic, authoritarian – and generous on welfare: how Poland's right rules". The Guardian .
  31. "PiS wygrywa: koniec NFZ, system budżetowy i sieć szpitali? - Polityka zdrowotna". www.rynekzdrowia.pl.
  32. Jan J. Rutkowski (1998). Welfare and the Labor Market in Poland: Social Policy During Economic Transition. World Bank Publications. pp. 61–62. ISBN   978-0-8213-4318-0 . Retrieved 3 March 2013.
  33. 1 2 3 4 5 6 7 Jan J. Rutkowski (1998). Welfare and the Labor Market in Poland: Social Policy During Economic Transition. World Bank Publications. pp. 77–78. ISBN   978-0-8213-4318-0 . Retrieved 3 March 2013.
  34. 1 2 "World Development Indicators". World Bank. 9 July 2012. Retrieved 25 July 2012.
  35. "World Databank". Databank.worldbank.org. Retrieved 17 November 2012.
  36. Population below poverty line, The World Factbook, CIA, accessed on July 25, 2012.
  37. PovCalNet. PovcalNet: the on-line tool for poverty measurement developed by the Development Research Group of the World Bank.
  38. Data show the ratio of the income or expenditure share of the richest group to that of the poorest. Human Development Report 2009, UNDP, accessed on July 30, 2011.
  39. Data show the ratio of the income or expenditure share of the richest group to that of the poorest. Human Development Report 20087-2008, UNDP, accessed on February 3, 2008.
  40. World Bank GINI index, accessed on November 24, 2011.
  41. Data show the ratio of the household income or consumption share of the richest group to that of the poorest. Household income or consumption by percentage share (%), The World Factbook, CIA, updated on January 24, 2008. Note: To calculate the value given in the table for this article, the highest 10% value was divided by the lowest 10% value.
  42. Distribution of family income - Gini index, The World Factbook, CIA, accessed on November 24, 2011.
  43. Global Peace Index calculation incorporates UN Gini scores where available, so countries with a UN Gini calculation are left blank in this column. At "Vision of Humanity". Archived from the original on 30 March 2010. Retrieved 3 March 2013. click on each country to see its Gini coefficient. Year is not given. "There are, nevertheless, some problems with the Gini-coefficient; there is a considerable lag in the publication of statistics for many countries suffers, forcing the Economist Intelligence Unit to estimate the coefficient for a sizeable proportion of the 153 countries in the GPI. These problems of measurement look likely to persist for the foreseeable future, and the use of other measures of income inequality may be more effective."

Further reading