Quantitative proteomics

Last updated
Quantitative mass spectrometry. Quantitative mass spectrometry.svg
Quantitative mass spectrometry.

Quantitative proteomics is an analytical chemistry technique for determining the amount of proteins in a sample. [1] [2] [3] [4] The methods for protein identification are identical to those used in general (i.e. qualitative) proteomics, but include quantification as an additional dimension. Rather than just providing lists of proteins identified in a certain sample, quantitative proteomics yields information about the physiological differences between two biological samples. For example, this approach can be used to compare samples from healthy and diseased patients. Quantitative proteomics is mainly performed by two-dimensional gel electrophoresis (2-DE), preparative native PAGE, or mass spectrometry (MS). However, a recent developed method of quantitative dot blot (QDB) analysis is able to measure both the absolute and relative quantity of an individual proteins in the sample in high throughput format, thus open a new direction for proteomic research. In contrast to 2-DE, which requires MS for the downstream protein identification, MS technology can identify and quantify the changes.

Contents

Quantification using spectrophotometry

The concentration of a certain protein in a sample may be determined using spectrophotometric procedures. [5] The concentration of a protein can be determined by measuring the OD at 280 nm on a spectrophotometer, which can be used with a standard curve assay to quantify the presence of tryptophan, tyrosine, and phenylalanine. [6] However, this method is not the most accurate because the composition of proteins can vary greatly and this method would not be able to quantify proteins that do not contain the aforementioned amino acids. This method is also inaccurate due to the possibility of nucleic acid contamination. Other more accurate spectrophotometric procedures for protein quantification include the Biuret, Lowry, BCA, and Bradford methods. An alternative method for label free protein quantification in clear liquid is cuvette-based SPR technique, that simultaneously measures the refractive index ranging 1.0 to 1.6 nD and concentration of the protein ranging from 0.5 µL to 2 mL in volume. This system consists of the calibrated optical filter with very high angular resolution and the interaction of light with this crystal forms a resonance at a wavelength which correlates to concentration and refractive index near the crystal. [7]

Quantification using two dimensional electrophoresis

Two-dimensional gel electrophoresis (2-DE) represents one of the main technologies for quantitative proteomics with advantages and disadvantages. 2-DE provides information about the protein quantity, charge, and mass of the intact protein. It has limitations for the analysis of proteins larger than 150 kDa or smaller than 5kDa and low solubility proteins. Quantitative MS has higher sensitivity but does not provide information about the intact protein.

Classical 2-DE based on post-electrophoretic dye staining has limitations: at least three technical replicates are required to verify the reproducibility.[ citation needed ] Difference gel electrophoresis (DIGE) uses fluorescence-based labeling of the proteins prior to separation has increased the precision of quantification as well as the sensitivity in the protein detection.[ citation needed ] Therefore, DIGE represents the current main approach for the 2-DE based study of proteomes.[ citation needed ]

Quantification using mass spectrometry

Examples of quantitative proteomic workflows. Red represents physiological sample of interest, while blue represents control sample. White boxes represent areas where errors are most likely to occur, and purple boxes represent where the samples have been mixed. Mass Spectrometry Quantitative Proteomic Workflows.png
Examples of quantitative proteomic workflows. Red represents physiological sample of interest, while blue represents control sample. White boxes represent areas where errors are most likely to occur, and purple boxes represent where the samples have been mixed.

Mass spectrometry (MS) represents one of the main technologies for quantitative proteomics with advantages and disadvantages. [4] Quantitative MS has higher sensitivity but can provide only limited information about the intact protein. Quantitative MS has been used for both discovery and targeted proteomic analysis to understand global proteomic dynamics in populations of cells (bulk analysis) [9] or in individual cells (single-cell analysis). [10] [11]

Early approaches developed in the 1990s applied isotope-coded affinity tags (ICAT), which uses two reagents with heavy and light isotopes, respectively, and a biotin affinity tag to modify cysteine containing peptides. This technology has been used to label whole Saccharomyces cerevisiae cells, [12] and, in conjunction with mass spectrometry, helped lay the foundation of quantitative proteomics. This approach has been superseded by isobaric mass tags, [9] which are also used for single-cell protein analysis. [13]

Relative and absolute quantification

Mass spectrometry is not inherently quantitative because of differences in the ionization efficiency and/or detectability of the many peptides in a given sample, which has sparked the development of methods to determine relative and absolute abundance of proteins in samples. [3] [4] The intensity of a peak in a mass spectrum is not a good indicator of the amount of the analyte in the sample, although differences in peak intensity of the same analyte between multiple samples accurately reflect relative differences in its abundance.

Stable isotope labeling in mass spectrometry

Stable isotope labels

An approach for relative quantification that is more costly and time-consuming, though less sensitive to experimental bias than label-free quantification, entails labeling the samples with stable isotope labels that allow the mass spectrometer to distinguish between identical proteins in separate samples. One type of label, isotopic tags, consist of stable isotopes incorporated into protein crosslinkers that causes a known mass shift of the labeled protein or peptide in the mass spectrum. Differentially labeled samples are combined and analyzed together, and the differences in the peak intensities of the isotope pairs accurately reflect difference in the abundance of the corresponding proteins.

Absolute proteomic quantification using isotopic peptides entails spiking known concentrations of synthetic, heavy isotopologues of target peptides into an experimental sample and then performing LC-MS/MS. As with relative quantification using isotopic labels, peptides of equal chemistry co-elute and are analyzed by MS simultaneously. Unlike relative quantification, though, the abundance of the target peptide in the experimental sample is compared to that of the heavy peptide and back-calculated to the initial concentration of the standard using a pre-determined standard curve to yield the absolute quantification of the target peptide.

Relative quantification methods include isotope-coded affinity tags (ICAT), isobaric labeling (tandem mass tags (TMT) and isobaric tags for relative and absolute quantification (iTRAQ)), label-free quantification metal-coded tags (MeCAT), N-terminal labelling, stable isotope labeling with amino acids in cell culture (SILAC), and terminal amine isotopic labeling of substrates (TAILS). A mathematically rigorous approach that integrates peptide intensities and peptide-measurement agreement into confidence intervals for protein ratios has emerged. [14]

Absolute quantification is performed using selected reaction monitoring (SRM).

Metal-coded tags

Metal-coded tags (MeCAT) method is based on chemical labeling, but rather than using stable isotopes, different lanthanide ions in macrocyclic complexes are used. The quantitative information comes from inductively coupled plasma MS measurements of the labeled peptides. MeCAT can be used in combination with elemental mass spectrometry ICP-MS allowing first-time absolute quantification of the metal bound by MeCAT reagent to a protein or biomolecule. Thus it is possible to determine the absolute amount of protein down to attomole range using external calibration by metal standard solution. It is compatible to protein separation by 2D electrophoresis and chromatography in multiplex experiments. Protein identification and relative quantification can be performed by MALDI-MS/MS and ESI-MS/MS.

Mass spectrometers have a limited capacity to detect low-abundance peptides in samples with a high dynamic range. The limited duty cycle of mass spectrometers also restricts the collision rate, resulting in an undersampling. [15] Sample preparation protocols represent sources of experimental bias.

Stable isotope labeling with amino acids in cell culture

Stable isotope labeling with amino acids in cell culture (SILAC) is a method that involves metabolic incorporation of “heavy” C- or N-labeled amino acids into proteins followed by MS analysis. SILAC requires growing cells in specialized media supplemented with light or heavy forms of essential amino acids, lysine or arginine. One cell population is grown in media containing light amino acids while the experimental condition is grown in the presence of heavy amino acids. The heavy and light amino acids are incorporated into proteins through cellular protein synthesis. Following cell lysis, equal amounts of protein from both conditions are combined and subjected to proteotypic digestion. Arginine and lysine amino acids were chosen, because trypsin, the predominant enzyme used to generate proteotypic peptides for MS analysis, cleaves at the C-terminus of lysine and arginine. Following digestion with trypsin, all the tryptic peptides from cells grown in SILAC media would have at least one labeled amino acid, resulting in a constant mass shift from the labeled sample over non-labeled. Because the peptides containing heavy and light amino acids are chemically identical, they co-elute during reverse-phase column fractionation and are detected simultaneously during MS analysis. The relative protein abundance is determined by the relative peak intensities of the isotopically distinct peptides.

Traditionally the level of multiplexing in SILAC was limited due to the number of SILAC isotopes available. Recently, a new technique called NeuCode SILAC, [16] has augmented the level of multiplexing achievable with metabolic labeling (up to 4). The NeuCode amino acid method is similar to SILAC but differs in that the labeling only utilizes heavy amino acids. The use of only heavy amino acids eliminates the need for 100% incorporation of amino acids needed for SILAC. The increased multiplexing capability of NeuCode amino acids is from the use of mass defects from extra neutrons in the stable isotopes. These small mass differences however need to be resolved on high resolution mass spectrometers.

One of the main benefits of SILAC is the level of quantitation bias from processing errors is low because heavy and light samples are combined before sample preparation for MS analysis. SILAC and NeuCode SILAC are excellent techniques for detecting small changes in protein levels or post-translational modifications between experimental groups.

Isobaric labeling

Isobaric mass tags (tandem mass tags) are tags that have identical mass and chemical properties that allow heavy and light isotopologues to co-elute together. All mass tags consist of a mass reporter that has a unique number of 13C substitutions, a mass normalizer that has a unique mass that balances the mass of the tag to make all the tags equal in mass and a reactive moiety that crosslinks to the peptides. These tags are designed to cleave at a specific linker region upon high-energy CID, yielding different-sized tags that are then quantitated by LC-MS/MS. Protein or peptide samples prepared from cells, tissues or biological fluids are labeled in parallel with the isobaric mass tags and combined for analysis. Protein quantitation is accomplished by comparing the intensities of the reporter ions in the MS/MS spectra. Three types of tandem mass tags are available with different reactivity: (1) reactive NHS ester which provides high-efficiency, amine-specific labeling (TMTduplex, TMTsixplex, TMT10plex and TMT11plex), (2) reactive iodacetyl function group which labels sulfhydryl-(-SH) groups (iodoTMT) and (3) reactive alkoxyamine functional group which provides covalent labeling of carbonyl-containing compounds (aminoxyTMT).

A key benefit of isobaric labeling over other quantification techniques (e.g. SILAC, ICAT, Label-free) is the increased multiplex capabilities and thus increased throughput potential. The ability to combine and analyze several samples simultaneously in one LC-MS run eliminates the need to analyze multiple data sets and eliminates run-to-run variation. Multiplexing reduces sample processing variability, improves specificity by quantifying the proteins from each condition simultaneously, and reduces turnaround time for multiple samples. The current available isobaric chemical tags facilitate the simultaneous analysis of up to 11 experimental samples.

Label-free quantification in mass spectrometry

One approach for relative quantification is to separately analyze samples by MS and compare the spectra to determine peptide abundance in one sample relative to another, as in label-free strategies. It is generally accepted, that while label-free quantification is the least accurate of the quantification paradigms, it is also inexpensive and reliable when put under heavy statistical validation. There are two different methods of quantification in label-free quantitative proteomics: AUC (area under the curve) and spectral counting.

Methods of label-free quantification

AUC is a method by which for a given peptide spectrum in an LC-MS run, the area under the spectral peak is calculated. AUC peak measurements are linearly proportional to the concentration of protein in a given analyte mixture. Quantification is achieved through ion counts, the measurement of the amount of an ion at a specific retention time. [17] Discretion is required for the standardization of the raw data. [18] High-resolution spectrometer can alleviate problems that arise when trying to make data reproducible, however much of the work regarding normalizing data can be done through software such as OpenMS, and MassView. [19]

Spectral counting involves counting the spectra of an identified protein and then standardizing using some form of normalization. [20] Typically this is done with an abundant peptide mass selection (MS) that is then fragmented and then MS/MS spectra are counted. [17] Multiple samplings of the protein peak is required for accurate estimation of the protein abundance because of the complex physiochemical nature of peptides. Thus, optimization for MS/MS experiments is a constant concern. One alternative to get around this problems is use a data independent technique that cycles between high and low collision energies. Thus a large survey of all possible precursor and product ions is collected. This is limited, however, by the mass spectrometry software's ability to recognize and match peptide patterns of associations between the precursor and product ions.

Applications

Work flow of the Quantification of the physiological differences in a and b cells in mice using computer prediction (A) and SILAC isotope-label quantification (B). (C) is the candidate list of kinases that indicate physiological differences in a and b cells. Journal.pone.0095194.g001.TIF
Work flow of the Quantification of the physiological differences in α and β cells in mice using computer prediction (A) and SILAC isotope-label quantification (B). (C) is the candidate list of kinases that indicate physiological differences in α and β cells.

Biomedical applications

Quantitative proteomics has distinct applications in the medical field. Especially in the fields of drug and biomarker discovery. LC-MS/MS techniques have started to over take more traditional methods like the western blot and ELISA due to the cumbersome nature of labeling different and separating proteins using these methods and the more global analysis of protein quantification. Mass spectrometry methods are more sensitive to difference in protein structure like post-translational modification and thus can quantify differing modifications to proteins. Quantitative proteomics can circumvent these issues, only needing sequence information to be performed. It can be applied on a global proteome level, or on specifically isolating binding partners in pull-down or affinity purification experiments. [4] [22] Disadvantages, however, in sensitivity and analysis time must be kept in consideration. [23]

Drug discovery

Quantitative proteomics has the largest applications in the protein target identification, protein target validation, and toxicity profiling of drug discovery. [24] Drug discovery has been used to investigate protein-protein interaction and, more recently, drug-small molecule interactions, a field of study called chemoproteomics. Thus, it has shown great promise in monitoring side-effects of small drug-like molecules and understanding the efficacy and therapeutic effect of one drug target over another. [25] [26] One of the more typical methodologies for absolute protein quantification in drug discovery is the use of LC-MS/MS with multiple reaction monitoring (MRM). The mass spectrometry is typically done by a triple quadrupole MS. [24]

See also

Related Research Articles

<span class="mw-page-title-main">Proteomics</span> Large-scale study of proteins

Proteomics is the large-scale study of proteins. Proteins are vital parts of living organisms, with many functions such as the formation of structural fibers of muscle tissue, enzymatic digestion of food, or synthesis and replication of DNA. In addition, other kinds of proteins include antibodies that protect an organism from infection, and hormones that send important signals throughout the body.

<span class="mw-page-title-main">Tandem mass spectrometry</span> Type of mass spectrometry

Tandem mass spectrometry, also known as MS/MS or MS2, is a technique in instrumental analysis where two or more stages of analysis using one or more mass analyzer are performed with an additional reaction step in between these analyses to increase their abilities to analyse chemical samples. A common use of tandem MS is the analysis of biomolecules, such as proteins and peptides.

<span class="mw-page-title-main">Protein sequencing</span> Sequencing of amino acid arrangement in a protein

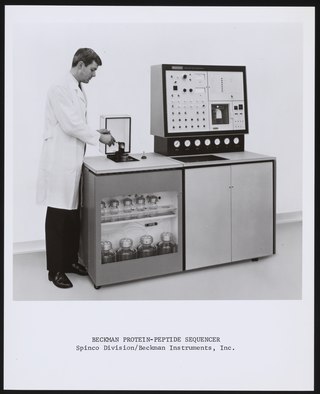
Protein sequencing is the practical process of determining the amino acid sequence of all or part of a protein or peptide. This may serve to identify the protein or characterize its post-translational modifications. Typically, partial sequencing of a protein provides sufficient information to identify it with reference to databases of protein sequences derived from the conceptual translation of genes.

<span class="mw-page-title-main">Stable isotope labeling by amino acids in cell culture</span>

Stable isotope labeling by/with amino acids in cell culture (SILAC) is a technique based on mass spectrometry that detects differences in protein abundance among samples using non-radioactive isotopic labeling. It is a popular method for quantitative proteomics.

<span class="mw-page-title-main">Matthias Mann</span> German physicist and biochemist (born 1959)

Matthias Mann is a German physicist and biochemist. He is doing research in the area of mass spectrometry and proteomics.

Phosphoproteomics is a branch of proteomics that identifies, catalogs, and characterizes proteins containing a phosphate group as a posttranslational modification. Phosphorylation is a key reversible modification that regulates protein function, subcellular localization, complex formation, degradation of proteins and therefore cell signaling networks. With all of these modification results, it is estimated that between 30–65% of all proteins may be phosphorylated, some multiple times. Based on statistical estimates from many datasets, 230,000, 156,000 and 40,000 phosphorylation sites should exist in human, mouse, and yeast, respectively.

A tandem mass tag (TMT) is a chemical label that facilitates sample multiplexing in mass spectrometry (MS)-based quantification and identification of biological macromolecules such as proteins, peptides and nucleic acids. TMT belongs to a family of reagents referred to as isobaric mass tags which are a set of molecules with the same mass, but yield reporter ions of differing mass after fragmentation. The relative ratio of the measured reporter ions represents the relative abundance of the tagged molecule, although ion suppression has a detrimental effect on accuracy. Despite these complications, TMT-based proteomics has been shown to afford higher precision than Label-free quantification. In addition to aiding in protein quantification, TMT tags can also increase the detection sensitivity of certain highly hydrophilic analytes, such as phosphopeptides, in RPLC-MS analyses.

<span class="mw-page-title-main">Protein mass spectrometry</span> Application of mass spectrometry

Protein mass spectrometry refers to the application of mass spectrometry to the study of proteins. Mass spectrometry is an important method for the accurate mass determination and characterization of proteins, and a variety of methods and instrumentations have been developed for its many uses. Its applications include the identification of proteins and their post-translational modifications, the elucidation of protein complexes, their subunits and functional interactions, as well as the global measurement of proteins in proteomics. It can also be used to localize proteins to the various organelles, and determine the interactions between different proteins as well as with membrane lipids.

<span class="mw-page-title-main">Isobaric tag for relative and absolute quantitation</span>

Isobaric tags for relative and absolute quantitation (iTRAQ) is an isobaric labeling method used in quantitative proteomics by tandem mass spectrometry to determine the amount of proteins from different sources in a single experiment. It uses stable isotope labeled molecules that can be covalent bonded to the N-terminus and side chain amines of proteins.

Label-free quantification is a method in mass spectrometry that aims to determine the relative amount of proteins in two or more biological samples. Unlike other methods for protein quantification, label-free quantification does not use a stable isotope containing compound to chemically bind to and thus label the protein.

An isotope-coded affinity tag (ICAT) is an in-vitro isotopic labeling method used for quantitative proteomics by mass spectrometry that uses chemical labeling reagents. These chemical probes consist of three elements: a reactive group for labeling an amino acid side chain, an isotopically coded linker, and a tag for the affinity isolation of labeled proteins/peptides. The samples are combined and then separated through chromatography, then sent through a mass spectrometer to determine the mass-to-charge ratio between the proteins. Only cysteine containing peptides can be analysed. Since only cysteine containing peptides are analysed, often the post translational modification is lost.

<span class="mw-page-title-main">Selected reaction monitoring</span> Tandem mass spectrometry method

Selected reaction monitoring (SRM), also called multiple reaction monitoring (MRM), is a method used in tandem mass spectrometry in which an ion of a particular mass is selected in the first stage of a tandem mass spectrometer and an ion product of a fragmentation reaction of the precursor ions is selected in the second mass spectrometer stage for detection.

<span class="mw-page-title-main">Isobaric labeling</span>

Isobaric labeling is a mass spectrometry strategy used in quantitative proteomics. Peptides or proteins are labeled with chemical groups that have identical mass (isobaric), but vary in terms of distribution of heavy isotopes in their structure. These tags, commonly referred to as tandem mass tags, are designed so that the mass tag is cleaved at a specific linker region upon high-energy CID (HCD) during tandem mass spectrometry yielding reporter ions of different masses. The most common isobaric tags are amine-reactive tags. However, tags that react with cysteine residues and carbonyl groups have also been described. These amine-reactive groups go through N-hydroxysuccinimide (NHS) reactions, which are based around three types of functional groups. Isobaric labeling methods include tandem mass tags (TMT), isobaric tags for relative and absolute quantification (iTRAQ), mass differential tags for absolute and relative quantification, and dimethyl labeling. TMTs and iTRAQ methods are most common and developed of these methods. Tandem mass tags have a mass reporter region, a cleavable linker region, a mass normalization region, and a protein reactive group and have the same total mass.

Secretomics is a type of proteomics which involves the analysis of the secretome—all the secreted proteins of a cell, tissue or organism. Secreted proteins are involved in a variety of physiological processes, including cell signaling and matrix remodeling, but are also integral to invasion and metastasis of malignant cells. Secretomics has thus been especially important in the discovery of biomarkers for cancer and understanding molecular basis of pathogenesis. The analysis of the insoluble fraction of the secretome has been termed matrisomics.

Terminal amine isotopic labeling of substrates (TAILS) is a method in quantitative proteomics that identifies the protein content of samples based on N-terminal fragments of each protein and detects differences in protein abundance among samples.

<span class="mw-page-title-main">Single-cell analysis</span> Testbg biochemical processes and reactions in an individual cell

In the field of cellular biology, single-cell analysis and subcellular analysis is the study of genomics, transcriptomics, proteomics, metabolomics and cell–cell interactions at the single cell level. The concept of single-cell analysis originated in the 1970s. Before the discovery of heterogeneity, single-cell analysis mainly referred to the analysis or manipulation of an individual cell in a bulk population of cells at a particular condition using optical or electronic microscope. To date, due to the heterogeneity seen in both eukaryotic and prokaryotic cell populations, analyzing a single cell makes it possible to discover mechanisms not seen when studying a bulk population of cells. Technologies such as fluorescence-activated cell sorting (FACS) allow the precise isolation of selected single cells from complex samples, while high throughput single cell partitioning technologies, enable the simultaneous molecular analysis of hundreds or thousands of single unsorted cells; this is particularly useful for the analysis of transcriptome variation in genotypically identical cells, allowing the definition of otherwise undetectable cell subtypes. The development of new technologies is increasing our ability to analyze the genome and transcriptome of single cells, as well as to quantify their proteome and metabolome. Mass spectrometry techniques have become important analytical tools for proteomic and metabolomic analysis of single cells. Recent advances have enabled quantifying thousands of protein across hundreds of single cells, and thus make possible new types of analysis. In situ sequencing and fluorescence in situ hybridization (FISH) do not require that cells be isolated and are increasingly being used for analysis of tissues.

<span class="mw-page-title-main">Degradomics</span> Sub-discipline of biology

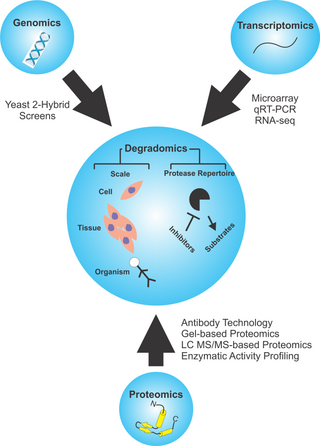
Degradomics is a sub-discipline of biology encompassing all the genomic and proteomic approaches devoted to the study of proteases, their inhibitors, and their substrates on a system-wide scale. This includes the analysis of the protease and protease-substrate repertoires, also called "protease degradomes". The scope of these degradomes can range from cell, tissue, and organism-wide scales.

Stable isotope standards and capture by anti-peptide antibodies (SISCAPA) is a mass spectrometry method for measuring the amount of a protein in a biological sample.

<span class="mw-page-title-main">Translatomics</span>

Translatomics is the study of all open reading frames (ORFs) that are being actively translated in a cell or organism. This collection of ORFs is called the translatome. Characterizing a cell's translatome can give insight into the array of biological pathways that are active in the cell. According to the central dogma of molecular biology, the DNA in a cell is transcribed to produce RNA, which is then translated to produce a protein. Thousands of proteins are encoded in an organism's genome, and the proteins present in a cell cooperatively carry out many functions to support the life of the cell. Under various conditions, such as during stress or specific timepoints in development, the cell may require different biological pathways to be active, and therefore require a different collection of proteins. Depending on intrinsic and environmental conditions, the collection of proteins being made at one time varies. Translatomic techniques can be used to take a "snapshot" of this collection of actively translating ORFs, which can give information about which biological pathways the cell is activating under the present conditions.

Lingjun Li is a Professor in the School of Pharmacy and Department of Chemistry at University of Wisconsin-Madison. She develops mass spectrometry based tools to study neuropeptides, peptide hormones and neurotransmitters.

References

  1. Ong SE, Mann M (October 2005). "Mass spectrometry-based proteomics turns quantitative". Nature Chemical Biology. 1 (5): 252–62. doi:10.1038/nchembio736. PMID   16408053. S2CID   32054251.
  2. Bantscheff M, Schirle M, Sweetman G, Rick J, Kuster B (October 2007). "Quantitative mass spectrometry in proteomics: a critical review". Analytical and Bioanalytical Chemistry. 389 (4): 1017–31. doi: 10.1007/s00216-007-1486-6 . PMID   17668192.
  3. 1 2 Nikolov M, Schmidt C, Urlaub H (2012). "Quantitative mass spectrometry-based proteomics: an overview". In Marcus K (ed.). Quantitative Methods in Proteomics. Methods in Molecular Biology. Vol. 893. Humana Press. pp. 85–100. doi:10.1007/978-1-61779-885-6_7. hdl:11858/00-001M-0000-000F-C327-D. ISBN   978-1-61779-884-9. PMID   22665296. S2CID   33009117.
  4. 1 2 3 4 Rozanova, Svitlana; Barkovits, Katalin; Nikolov, Miroslav; Schmidt, Carla; Urlaub, Henning; Marcus, Katrin (2021). "Quantitative Mass Spectrometry-Based Proteomics: An Overview". In Marcus, Katrin; Eisenacher, Martin; Sitek, Barbara (eds.). Quantitative Methods in Proteomics. Methods in Molecular Biology. Vol. 2228. New York, NY: Springer US. pp. 85–116. doi: 10.1007/978-1-0716-1024-4_8 . ISBN   978-1-0716-1023-7. PMID   33950486.
  5. Ninfa, Ballou, Benore. Fundamental Approaches to Biochemistry and Biotechnology, 2nd edition 2010. Fitzgerald Science Press, Bethesda, MD.
  6. Whitaker JR, Granum PE (November 1980). "An absolute method for protein determination based on difference in absorbance at 235 and 280 nm". Analytical Biochemistry. 109 (1): 156–159. doi:10.1016/0003-2697(80)90024-x. PMID   7469012.
  7. Hermannsson, Pétur G.; Vannahme, Christoph; Smith, Cameron L. C.; Sørensen, Kristian T.; Kristensen, Anders (2015). "Refractive index dispersion sensing using an array of photonic crystal resonant reflectors" (PDF). Applied Physics Letters. 107 (6): 061101. Bibcode:2015ApPhL.107f1101H. doi:10.1063/1.4928548. S2CID   62897708.
  8. Engholm-Keller K, Larsen MR (March 2013). "Technologies and challenges in large-scale phosphoproteomics". Proteomics. 13 (6): 910–931. doi:10.1002/pmic.201200484. PMID   23404676. S2CID   11166402.
  9. 1 2 Aebersold R, Mann M (September 2016). "Mass-spectrometric exploration of proteome structure and function". Nature. 537 (7620): 347–355. Bibcode:2016Natur.537..347A. doi:10.1038/nature19949. PMID   27629641. S2CID   4448087.
  10. Specht H, Emmott E, Petelski A, Huffman RG, Perlman DH, Serra M, Kharchenko P, Koller A, Slavov N (2021-01-27). "Single-cell proteomic and transcriptomic analysis of macrophage heterogeneity using SCoPE2". Genome Biology. 22 (1). 50. doi: 10.1186/s13059-021-02267-5 . PMC   7839219 . PMID   33504367. S2CID   195403321.
  11. Slavov N (June 2020). "Single-cell protein analysis by mass spectrometry". Current Opinion in Chemical Biology. 60: 1–9. arXiv: 2004.02069 . doi:10.1016/j.cbpa.2020.04.018. PMC   7767890 . PMID   32599342. S2CID   219966629.
  12. Oda Y, Huang K, Cross FR, Cowburn D, Chait BT (June 1999). "Accurate quantitation of protein expression and site-specific phosphorylation". Proceedings of the National Academy of Sciences of the United States of America. 96 (12): 6591–6. Bibcode:1999PNAS...96.6591O. doi: 10.1073/pnas.96.12.6591 . PMC   21959 . PMID   10359756.
  13. Slavov N (January 2020). "Unpicking the proteome in single cells". Science. 367 (6477): 512–513. Bibcode:2020Sci...367..512S. doi:10.1126/science.aaz6695. PMC   7029782 . PMID   32001644.
  14. Peshkin L, Ryazanova L, Wuhr M, et al. (2017). "Bayesian Confidence Intervals for Multiplexed Proteomics Integrate Ion-Statistics with Peptide Quantification Concordance.". bioRxiv   10.1101/210476 .
  15. Prakash A, Piening B, Whiteaker J, Zhang H, Shaffer SA, Martin D, et al. (October 2007). "Assessing bias in experiment design for large scale mass spectrometry-based quantitative proteomics". Molecular & Cellular Proteomics. 6 (10): 1741–8. doi: 10.1074/mcp.M600470-MCP200 . PMID   17617667.
  16. Merrill AE, Hebert AS, MacGilvray ME, Rose CM, Bailey DJ, Bradley JC, et al. (September 2014). "NeuCode labels for relative protein quantification". Molecular & Cellular Proteomics. 13 (9): 2503–12. doi: 10.1074/mcp.M114.040287 . PMC   4159665 . PMID   24938287.
  17. 1 2 Neilson KA, Ali NA, Muralidharan S, Mirzaei M, Mariani M, Assadourian G, et al. (February 2011). "Less label, more free: approaches in label-free quantitative mass spectrometry". Proteomics. 11 (4): 535–53. doi: 10.1002/pmic.201000553 . PMID   21243637. S2CID   34809291.
  18. America AH, Cordewener JH (February 2008). "Comparative LC-MS: a landscape of peaks and valleys". Proteomics. 8 (4): 731–49. doi: 10.1002/pmic.200700694 . PMID   18297651. S2CID   13022870.
  19. Wang W, Zhou H, Lin H, Roy S, Shaler TA, Hill LR, et al. (September 2003). "Quantification of proteins and metabolites by mass spectrometry without isotopic labeling or spiked standards". Analytical Chemistry. 75 (18): 4818–26. doi:10.1021/ac026468x. PMID   14674459.
  20. Lundgren DH, Hwang SI, Wu L, Han DK (February 2010). "Role of spectral counting in quantitative proteomics". Expert Review of Proteomics. 7 (1): 39–53. doi:10.1586/epr.09.69. PMID   20121475. S2CID   29355269.
  21. Choudhary A, Hu He K, Mertins P, Udeshi ND, Dančík V, Fomina-Yadlin D, et al. (2014-04-23). "Quantitative-proteomic comparison of alpha and Beta cells to uncover novel targets for lineage reprogramming". PLOS ONE. 9 (4): e95194. Bibcode:2014PLoSO...995194C. doi: 10.1371/journal.pone.0095194 . PMC   3997365 . PMID   24759943.
  22. Shema-Yaacoby, Efrat; Nikolov, Miroslav; Haj-Yahya, Mahmood; Siman, Peter; Allemand, Eric; Yamaguchi, Yuki; Muchardt, Christian; Urlaub, Henning; Brik, Ashraf; Oren, Moshe; Fischle, Wolfgang (2013-08-15). "Systematic Identification of Proteins Binding to Chromatin-Embedded Ubiquitylated H2B Reveals Recruitment of SWI/SNF to Regulate Transcription". Cell Reports. 4 (3): 601–608. doi: 10.1016/j.celrep.2013.07.014 . hdl: 11858/00-001M-0000-0014-4E3E-6 . PMID   23933260.
  23. Bantscheff M, Lemeer S, Savitski MM, Kuster B (September 2012). "Quantitative mass spectrometry in proteomics: critical review update from 2007 to the present". Analytical and Bioanalytical Chemistry. 404 (4): 939–965. doi:10.1007/s00216-012-6203-4. PMID   22772140. S2CID   21085313.
  24. 1 2 Ohtsuki S, Uchida Y, Kubo Y, Terasaki T (September 2011). "Quantitative targeted absolute proteomics-based ADME research as a new path to drug discovery and development: methodology, advantages, strategy, and prospects". Journal of Pharmaceutical Sciences. 100 (9): 3547–59. doi: 10.1002/jps.22612 . PMID   21560129.
  25. Rix U, Superti-Furga G (September 2009). "Target profiling of small molecules by chemical proteomics". Nature Chemical Biology. 5 (9): 616–24. doi:10.1038/nchembio.216. PMID   19690537.
  26. Schenone M, Dančík V, Wagner BK, Clemons PA (April 2013). "Target identification and mechanism of action in chemical biology and drug discovery". Nature Chemical Biology. 9 (4): 232–40. doi:10.1038/nchembio.1199. PMC   5543995 . PMID   23508189.