
Benoit B.Mandelbrot was a Polish-born French-American mathematician and polymath with broad interests in the practical sciences, especially regarding what he labeled as "the art of roughness" of physical phenomena and "the uncontrolled element in life". He referred to himself as a "fractalist" and is recognized for his contribution to the field of fractal geometry, which included coining the word "fractal", as well as developing a theory of "roughness and self-similarity" in nature.

In probability theory and statistics, skewness is a measure of the asymmetry of the probability distribution of a real-valued random variable about its mean. The skewness value can be positive, zero, negative, or undefined.
Financial economics, also known as finance, is the branch of economics characterized by a "concentration on monetary activities", in which "money of one type or another is likely to appear on both sides of a trade". Its concern is thus the interrelation of financial variables, such as share prices, interest rates and exchange rates, as opposed to those concerning the real economy. It has two main areas of focus: asset pricing, commonly known as "Investments", and corporate finance; the first being the perspective of providers of capital, i.e. investors, and the second of users of capital. It thus provides the theoretical underpinning for much of finance.
The Black–Scholes or Black–Scholes–Merton model is a mathematical model for the dynamics of a financial market containing derivative investment instruments. From the parabolic partial differential equation in the model, known as the Black–Scholes equation, one can deduce the Black–Scholes formula, which gives a theoretical estimate of the price of European-style options and shows that the option has a unique price given the risk of the security and its expected return. The equation and model are named after economists Fischer Black and Myron Scholes; Robert C. Merton, who first wrote an academic paper on the subject, is sometimes also credited.
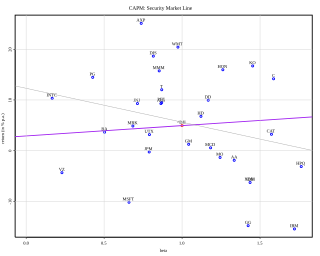
In finance, the capital asset pricing model (CAPM) is a model used to determine a theoretically appropriate required rate of return of an asset, to make decisions about adding assets to a well-diversified portfolio.
In financial mathematics, the implied volatility (IV) of an option contract is that value of the volatility of the underlying instrument which, when input in an option pricing model, will return a theoretical value equal to the current market price of said option. A non-option financial instrument that has embedded optionality, such as an interest rate cap, can also have an implied volatility. Implied volatility, a forward-looking and subjective measure, differs from historical volatility because the latter is calculated from known past returns of a security. To understand where implied volatility stands in terms of the underlying, implied volatility rank is used to understand its implied volatility from a one-year high and low IV.
Market risk is the risk of losses in positions arising from movements in market variables like prices and volatility. There is no unique classification as each classification may refer to different aspects of market risk. Nevertheless, the most commonly used types of market risk are:

In statistics, a multimodaldistribution is a probability distribution with more than one mode. These appear as distinct peaks in the probability density function, as shown in Figures 1 and 2. Categorical, continuous, and discrete data can all form multimodal distributions. Among univariate analyses, multimodal distributions are commonly bimodal.
This glossary of statistics and probability is a list of definitions of terms and concepts used in the mathematical sciences of statistics and probability, their sub-disciplines, and related fields. For additional related terms, see Glossary of mathematics and Glossary of experimental design.

A stock trader or equity trader or share trader, also called a stock investor, is a person or company involved in trading equity securities and attempting to profit from the purchase and sale of those securities. Stock traders may be an investor, agent, hedger, arbitrageur, speculator, or stockbroker. Such equity trading in large publicly traded companies may be through a stock exchange. Stock shares in smaller public companies may be bought and sold in over-the-counter (OTC) markets or in some instances in equity crowdfunding platforms.
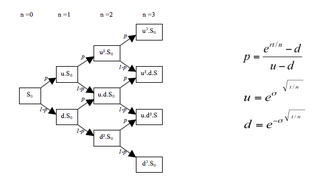
In finance, a lattice model is a technique applied to the valuation of derivatives, where a discrete time model is required. For equity options, a typical example would be pricing an American option, where a decision as to option exercise is required at "all" times before and including maturity. A continuous model, on the other hand, such as Black–Scholes, would only allow for the valuation of European options, where exercise is on the option's maturity date. For interest rate derivatives lattices are additionally useful in that they address many of the issues encountered with continuous models, such as pull to par. The method is also used for valuing certain exotic options, where because of path dependence in the payoff, Monte Carlo methods for option pricing fail to account for optimal decisions to terminate the derivative by early exercise, though methods now exist for solving this problem.
A fat-tailed distribution is a probability distribution that exhibits a large skewness or kurtosis, relative to that of either a normal distribution or an exponential distribution. In common usage, the terms fat-tailed and heavy-tailed are sometimes synonymous; fat-tailed is sometimes also defined as a subset of heavy-tailed. Different research communities favor one or the other largely for historical reasons, and may have differences in the precise definition of either.
Financial risk modeling is the use of formal econometric techniques to determine the aggregate risk in a financial portfolio. Risk modeling is one of many subtasks within the broader area of financial modeling.
In statistics and decision theory, kurtosis risk is the risk that results when a statistical model assumes the normal distribution, but is applied to observations that have a tendency to occasionally be much farther from the average than is expected for a normal distribution.
In statistics, normality tests are used to determine if a data set is well-modeled by a normal distribution and to compute how likely it is for a random variable underlying the data set to be normally distributed.

In statistics, the 68–95–99.7 rule, also known as the empirical rule, is a shorthand used to remember the percentage of values that lie within an interval estimate in a normal distribution: 68%, 95%, and 99.7% of the values lie within one, two, and three standard deviations of the mean, respectively.

In statistics, data transformation is the application of a deterministic mathematical function to each point in a data set—that is, each data point zi is replaced with the transformed value yi = f(zi), where f is a function. Transforms are usually applied so that the data appear to more closely meet the assumptions of a statistical inference procedure that is to be applied, or to improve the interpretability or appearance of graphs.
Post-Modern Portfolio Theory (‘’'PMPT) is an extension of the traditional Modern Portfolio Theory (MPT, an application of mean-variance analysis. Both theories propose how rational investors can use diversification to optimize their portfolios.

The seven states of randomness in probability theory, fractals and risk analysis are extensions of the concept of randomness as modeled by the normal distribution. These seven states were first introduced by Benoît Mandelbrot in his 1997 book Fractals and Scaling in Finance, which applied fractal analysis to the study of risk and randomness. This classification builds upon the three main states of randomness: mild, slow, and wild.

Mathematical finance, also known as quantitative finance and financial mathematics, is a field of applied mathematics, concerned with mathematical modeling of financial markets.