This article needs to be updated.(February 2023) |
| ||||||||||||||||||||||||||||||||||
All 60 seats in the Oregon House of Representatives 31 seats needed for a majority | ||||||||||||||||||||||||||||||||||
---|---|---|---|---|---|---|---|---|---|---|---|---|---|---|---|---|---|---|---|---|---|---|---|---|---|---|---|---|---|---|---|---|---|---|
| ||||||||||||||||||||||||||||||||||
Results: Democratic gain Republican gain Democratic hold Republican hold | ||||||||||||||||||||||||||||||||||
|
Elections in Oregon |
---|
The 2022 Oregon House of Representatives election was held on Tuesday, November 8, 2022. Primary elections were held on Tuesday, May 17, 2022. [1] Voters in the 60 districts of the Oregon House of Representatives elected their representatives. The elections coincided with the elections for other offices, including for State Senate.
The Democratic Party had controlled the Oregon House of Representatives since 2013.
Source | Ranking | As of |
---|---|---|
Sabato's Crystal Ball [4] | Likely D | May 19, 2022 |
Affiliation | Candidates | Votes | Vote % | Seats Won | |
---|---|---|---|---|---|
Democratic | 55 | 981,568 | 52.33% | 35 | |
Republican | 60 | 878,962 | 46.86% | 25 | |
Libertarian | 4 | 6,085 | 0.32% | 0 | |
Constitution | 2 | 1,073 | 0.06% | 0 | |
Progressive | 1 | 2,837 | 0.15% | 0 | |
Write-in | N/A | 5,028 | 0.27% | 0 | |
Total | 122 | 1,875,553 | 100% | 60 |
Districts where the margin of victory was under 10%:
Party | Candidate | Votes | % | |
---|---|---|---|---|
Democratic | Bret Cecil | 4,078 | 96.48 | |
Write-in | 149 | 3.52 | ||
Total votes | 4,227 | 100% |
Party | Candidate | Votes | % | |
---|---|---|---|---|
Republican | David Brock Smith (incumbent) | 8,444 | 98.07 | |
Write-in | 166 | 1.93 | ||
Total votes | 8,610 | 100% |
Party | Candidate | Votes | % | |
---|---|---|---|---|
Republican | David Brock Smith (incumbent) | 25,451 | 70.53 | |
Democratic | Bret Cecil | 10,536 | 29.20 | |
Write-in | 96 | 0.27 | ||
Total votes | 36,083 | 100% |
Party | Candidate | Votes | % | |
---|---|---|---|---|
Democratic | Rainey S. Lambert | 3,251 | 95.96 | |
Write-in | 137 | 4.04 | ||
Total votes | 3,388 | 100% |
Party | Candidate | Votes | % | |
---|---|---|---|---|
Republican | Virgle Osborne | 8,362 | 98.09 | |
Write-in | 163 | 1.91 | ||
Total votes | 8,525 | 100% |
Party | Candidate | Votes | % | |
---|---|---|---|---|
Republican | Virgle Osborne | 23,500 | 70.06 | |
Democratic | Rainey S. Lambert | 9,123 | 27.20 | |
Constitution | Edward Renfroe | 841 | 2.51 | |
Write-in | 78 | 0.23 | ||
Total votes | 33,542 | 100% |
Party | Candidate | Votes | % | |
---|---|---|---|---|
Democratic | Bradley W. Keister | 3,887 | 97.35 | |
Write-in | 106 | 2.65 | ||
Total votes | 3,993 | 100% |
Party | Candidate | Votes | % | |
---|---|---|---|---|
Republican | Lily Morgan (incumbent) | 7,897 | 97.12 | |
Write-in | 234 | 2.88 | ||
Total votes | 8,131 | 100% |
Party | Candidate | Votes | % | |
---|---|---|---|---|
Republican | Lily Morgan (incumbent) | 22,206 | 68.16 | |
Democratic | Bradley W. Keister | 10,311 | 31.65 | |
Write-in | 63 | 0.19 | ||
Total votes | 32,580 | 100% |
Party | Candidate | Votes | % | |
---|---|---|---|---|
Democratic | Christine Goodwin (write-in) | 48 | 15.00 | |
Write-in | 272 | 85.00 | ||
Total votes | 320 | 100% |
Party | Candidate | Votes | % | |
---|---|---|---|---|
Republican | Christine Goodwin (incumbent) | 7,940 | 97.95 | |
Write-in | 166 | 2.05 | ||
Total votes | 8,106 | 100% |
Party | Candidate | Votes | % | |
---|---|---|---|---|
Republican | Christine Goodwin (incumbent) | 23,634 | 97.16 | |
Write-in | 691 | 2.84 | ||
Total votes | 24,325 | 100% |
Party | Candidate | Votes | % | |
---|---|---|---|---|
Democratic | Pam Marsh (incumbent) | 10,071 | 99.63 | |
Write-in | 37 | 0.37 | ||
Total votes | 10,108 | 100% |
Party | Candidate | Votes | % | |
---|---|---|---|---|
Republican | Sandra A. Abercrombie | 3,972 | 98.29 | |
Write-in | 69 | 1.71 | ||
Total votes | 4,041 | 100% |
Party | Candidate | Votes | % | |
---|---|---|---|---|
Democratic | Pam Marsh (incumbent) | 23,063 | 64.36 | |
Republican | Sandra A. Abercrombie | 12,740 | 35.55 | |
Write-in | 29 | 0.08 | ||
Total votes | 35,832 | 100% |
Party | Candidate | Votes | % | |
---|---|---|---|---|
Democratic | Dan Davis | 3,466 | 97.03 | |
Write-in | 106 | 2.97 | ||
Total votes | 3,572 | 100% |
Party | Candidate | Votes | % | |
---|---|---|---|---|
Republican | Kim Wallan (incumbent) | 5,282 | 98.90 | |
Write-in | 59 | 1.10 | ||
Total votes | 5,341 | 100% |
Party | Candidate | Votes | % | |
---|---|---|---|---|
Republican | Kim Wallan (incumbent) | 16,683 | 60.21 | |
Democratic | Dan Davis | 10,996 | 39.69 | |
Write-in | 29 | 0.10 | ||
Total votes | 27,708 | 100% |
Party | Candidate | Votes | % | |
---|---|---|---|---|
Democratic | John Lively (incumbent) | 5,513 | 97.78 | |
Write-in | 125 | 2.22 | ||
Total votes | 5,638 | 100% |
Party | Candidate | Votes | % | |
---|---|---|---|---|
Republican | Alan Stout | 3,549 | 82.59 | |
Republican | Raiph Huber | 707 | 16.45 | |
Write-in | 41 | 0.95 | ||
Total votes | 4,297 | 100% |
Party | Candidate | Votes | % | |
---|---|---|---|---|
Democratic | John Lively (incumbent) | 15,141 | 51.72 | |
Republican | Alan Stout | 13,934 | 47.59 | |
Write-in | 202 | 0.69 | ||
Total votes | 29,277 | 100% |
Party | Candidate | Votes | % | |
---|---|---|---|---|
Democratic | Paul R. Holvey (incumbent) | 9,267 | 99.05 | |
Write-in | 89 | 0.95 | ||
Total votes | 9,356 | 100% |
Party | Candidate | Votes | % | |
---|---|---|---|---|
Republican | Michael F. Moore | 904 | 95.46 | |
Write-in | 43 | 4.54 | ||
Total votes | 947 | 100% |
Party | Candidate | Votes | % | |
---|---|---|---|---|
Democratic | Paul R. Holvey (incumbent) | 24,696 | 84.73 | |
Republican | Michael F. Moore | 4,376 | 15.01 | |
Write-in | 75 | 0.25 | ||
Total votes | 29,147 | 100% |
Party | Candidate | Votes | % | |
---|---|---|---|---|
Democratic | Jerry Rust (write-in) | 397 | 30.94 | |
Write-in | 886 | 69.06 | ||
Total votes | 1,283 | 100% |
Party | Candidate | Votes | % | |
---|---|---|---|---|
Republican | Boomer Wright (incumbent) | 7,241 | 99.14 | |
Write-in | 63 | 0.86 | ||
Total votes | 7,304 | 100% |
Party | Candidate | Votes | % | |
---|---|---|---|---|
Republican | Boomer Wright (incumbent) | 20,686 | 60.07 | |
Democratic | Jerry Rust | 13,705 | 39.80 | |
Write-in | 45 | 0.13 | ||
Total votes | 34,436 | 100% |
Party | Candidate | Votes | % | |
---|---|---|---|---|
Democratic | David Gomberg (incumbent) | 8,376 | 98.40 | |
Write-in | 136 | 1.60 | ||
Total votes | 8,512 | 100% |
Party | Candidate | Votes | % | |
---|---|---|---|---|
Republican | Celeste McEntee | 5,368 | 98.28 | |
Write-in | 94 | 1.72 | ||
Total votes | 5,462 | 100% |
Party | Candidate | Votes | % | |
---|---|---|---|---|
Democratic | David Gomberg (incumbent) | 21,158 | 56.69 | |
Republican | Celeste McEntee | 16,115 | 43.18 | |
Write-in | 50 | 0.13 | ||
Total votes | 37,323 | 100% |
Party | Candidate | Votes | % | |
---|---|---|---|---|
Democratic | Mary K. Cooke | 1,119 | 35.11 | |
Democratic | Renee Windsor-White | 975 | 30.77 | |
Democratic | Nina Brenner | 942 | 29.73 | |
Write-in | 133 | 0.42 | ||
Total votes | 3,169 | 100% |
Party | Candidate | Votes | % | |
---|---|---|---|---|
Republican | Jami Cate (incumbent) | 8,126 | 85.17 | |
Republican | Tyler S. Collins | 1,384 | 14.51 | |
Write-in | 31 | 0.32 | ||
Total votes | 9,541 | 100% |
Party | Candidate | Votes | % | |
---|---|---|---|---|
Republican | Jami Cate (incumbent) | 24,892 | 74.50 | |
Democratic | Mary K. Cooke | 8,458 | 25.32 | |
Write-in | 60 | 0.18 | ||
Total votes | 33,410 | 100% |
Party | Candidate | Votes | % | |
---|---|---|---|---|
Democratic | Michelle Emmons | 5,108 | 97.99 | |
Write-in | 105 | 2.01 | ||
Total votes | 5,213 | 100% |
Party | Candidate | Votes | % | |
---|---|---|---|---|
Republican | Charlie Conrad | 2,400 | 30.50 | |
Republican | Nichole De Graff | 2,301 | 29.25 | |
Republican | Bill R. Ledford | 1,926 | 24.48 | |
Republican | Jeff Gowing | 1,223 | 15.54 | |
Write-in | 18 | 0.23 | ||
Total votes | 7,868 | 100% |
Party | Candidate | Votes | % | |
---|---|---|---|---|
Republican | Charlie Conrad | 20,410 | 57.46 | |
Democratic | Michelle Emmons | 15,073 | 42.43 | |
Write-in | 40 | 0.11 | ||
Total votes | 35,523 | 100% |
Party | Candidate | Votes | % | |
---|---|---|---|---|
Democratic | Nancy Nathanson (incumbent) | 8,809 | 98.82 | |
Write-in | 105 | 1.18 | ||
Total votes | 8,914 | 100% |
Party | Candidate | Votes | % | |
---|---|---|---|---|
Republican | Timothy S. Sutherland | 3,321 | 98.14 | |
Write-in | 63 | 1.86 | ||
Total votes | 3,384 | 100% |
Party | Candidate | Votes | % | |
---|---|---|---|---|
Democratic | Nancy Nathanson (incumbent) | 23,543 | 65.21 | |
Republican | Timothy S. Sutherland | 12,501 | 34.63 | |
Write-in | 59 | 0.16 | ||
Total votes | 36,103 | 100% |
Party | Candidate | Votes | % | |
---|---|---|---|---|
Democratic | Julie Fahey (incumbent) | 6,239 | 98.53 | |
Write-in | 93 | 1.47 | ||
Total votes | 6,332 | 100% |
Party | Candidate | Votes | % | |
---|---|---|---|---|
Republican | Stan Stubblefield | 3,411 | 85.45 | |
Republican | Caleb Clark | 549 | 13.75 | |
Write-in | 32 | 0.80 | ||
Total votes | 3,992 | 100% |
Party | Candidate | Votes | % | |
---|---|---|---|---|
Democratic | Julie Fahey (incumbent) | 17,887 | 59.71 | |
Republican | Stan Stubblefield | 12,010 | 40.09 | |
Write-in | 59 | 0.20 | ||
Total votes | 29,956 | 100% |
Party | Candidate | Votes | % | |
---|---|---|---|---|
Democratic | Benjamin Watts | 4,943 | 98.04 | |
Write-in | 99 | 1.96 | ||
Total votes | 5,042 | 100% |
Party | Candidate | Votes | % | |
---|---|---|---|---|
Republican | Shelly Boshart Davis (incumbent) | 6,780 | 99.04 | |
Write-in | 66 | 0.96 | ||
Total votes | 6,846 | 100% |
Party | Candidate | Votes | % | |
---|---|---|---|---|
Republican | Shelly Boshart Davis (incumbent) | 19,995 | 60.00 | |
Democratic | Benjamin Watts | 13,300 | 39.90 | |
Write-in | 35 | 0.11 | ||
Total votes | 33,330 | 100% |
Party | Candidate | Votes | % | |
---|---|---|---|---|
Democratic | Dan Rayfield (incumbent) | 9,086 | 99.19 | |
Write-in | 74 | 0.81 | ||
Total votes | 9,160 | 100% |
Party | Candidate | Votes | % | |
---|---|---|---|---|
Republican | Keith Lembke | 2,319 | 97.72 | |
Write-in | 54 | 2.28 | ||
Total votes | 2,373 | 100% |
Party | Candidate | Votes | % | |
---|---|---|---|---|
Democratic | Dan Rayfield (incumbent) | 22,483 | 75.17 | |
Republican | Keith Lembke | 7,362 | 24.61 | |
Write-in | 65 | 0.22 | ||
Total votes | 29,910 | 100% |
Party | Candidate | Votes | % | |
---|---|---|---|---|
Democratic | Ed Diehl (write-in) | 57 | 13.73 | |
Write-in | 358 | 86.27 | ||
Total votes | 415 | 100% |
Party | Candidate | Votes | % | |
---|---|---|---|---|
Republican | Ed Diehl | 6,783 | 70.97 | |
Republican | Beth Jones | 2,736 | 28.63 | |
Write-in | 38 | 0.40 | ||
Total votes | 9,557 | 100% |
Party | Candidate | Votes | % | |
---|---|---|---|---|
Republican | Ed Diehl | 21,741 | 96.70 | |
Write-in | 742 | 3.30 | ||
Total votes | 22,483 | 100% |
Party | Candidate | Votes | % | |
---|---|---|---|---|
Democratic | Jesse S. Smith | 3,595 | 97.40 | |
Write-in | 96 | 2.60 | ||
Total votes | 3,691 | 100% |
Party | Candidate | Votes | % | |
---|---|---|---|---|
Republican | Rick Lewis (incumbent) | 7,048 | 99.06 | |
Write-in | 67 | 0.94 | ||
Total votes | 7,115 | 100% |
Party | Candidate | Votes | % | |
---|---|---|---|---|
Republican | Rick Lewis (incumbent) | 24,352 | 71.09 | |
Democratic | Jesse S. Smith | 9,863 | 28.79 | |
Write-in | 40 | 0.12 | ||
Total votes | 34,255 | 100% |
Party | Candidate | Votes | % | |
---|---|---|---|---|
Democratic | Tom Andersen | 2,592 | 36.46 | |
Democratic | Jackie Leung | 2,285 | 32.14 | |
Democratic | Brad Witt (incumbent) | 2,188 | 30.77 | |
Write-in | 45 | 0.63 | ||
Total votes | 7,110 | 100% |
Party | Candidate | Votes | % | |
---|---|---|---|---|
Republican | TJ Sullivan | 3,937 | 98.62 | |
Write-in | 55 | 1.38 | ||
Total votes | 3,992 | 100% |
Party | Candidate | Votes | % | |
---|---|---|---|---|
Democratic | Tom Andersen | 15,289 | 54.39 | |
Republican | TJ Sullivan | 12,779 | 45.46 | |
Write-in | 40 | 0.14 | ||
Total votes | 28,108 | 100% |
Party | Candidate | Votes | % | |
---|---|---|---|---|
Democratic | Paul Evans (incumbent) | 7,058 | 98.71 | |
Write-in | 92 | 1.29 | ||
Total votes | 7,150 | 100% |
Party | Candidate | Votes | % | |
---|---|---|---|---|
Republican | Dan Farrington | 5,047 | 98.61 | |
Write-in | 71 | 1.39 | ||
Total votes | 5,118 | 100% |
Party | Candidate | Votes | % | |
---|---|---|---|---|
Democratic | Paul Evans (incumbent) | 17,316 | 54.24 | |
Republican | Dan Farrington | 14,077 | 44.09 | |
Libertarian | Taylor A. Rickey | 502 | 1.57 | |
Write-in | 32 | 0.10 | ||
Total votes | 31,927 | 100% |
Party | Candidate | Votes | % | |
---|---|---|---|---|
Democratic | Ramiro Navarro Jr. | 3,394 | 63.80 | |
Democratic | Robert Husseman | 1,848 | 34.74 | |
Write-in | 78 | 1.47 | ||
Total votes | 5,320 | 100% |
Party | Candidate | Votes | % | |
---|---|---|---|---|
Republican | Kevin L. Mannix | 4,712 | 85.84 | |
Republican | Kyler T. McNaught | 749 | 13.65 | |
Write-in | 28 | 0.51 | ||
Total votes | 5,489 | 100% |
Party | Candidate | Votes | % | |
---|---|---|---|---|
Republican | Kevin L. Mannix | 13,115 | 51.38 | |
Democratic | Ramiro Navarro Jr. | 11,646 | 45.63 | |
Libertarian | Michael Morrow | 738 | 2.89 | |
Write-in | 26 | 0.10 | ||
Total votes | 25,525 | 100% |
Party | Candidate | Votes | % | |
---|---|---|---|---|
Democratic | Anthony Medina | 2,706 | 98.33 | |
Write-in | 46 | 1.67 | ||
Total votes | 2,752 | 100% |
Party | Candidate | Votes | % | |
---|---|---|---|---|
Republican | Tracy M. Cramer | 2,323 | 68.91 | |
Republican | Jim Lowder | 1,048 | 31.09 | |
Write-in | 23 | 0.68 | ||
Total votes | 3,371 | 100% |
Party | Candidate | Votes | % | |
---|---|---|---|---|
Republican | Tracy M. Cramer | 8,742 | 51.49 | |
Democratic | Anthony Medina | 8,200 | 48.29 | |
Write-in | 37 | 0.22 | ||
Total votes | 16,979 | 100% |
Party | Candidate | Votes | % | |
---|---|---|---|---|
Democratic | Kriss Wright | 3,423 | 53.33 | |
Democratic | Hollamon Elise Yarnell | 2,886 | 44.96 | |
Write-in | 110 | 1.71 | ||
Total votes | 6,419 | 100% |
Party | Candidate | Votes | % | |
---|---|---|---|---|
Republican | Anna M. Scharf (incumbent) | 7,446 | 98.49 | |
Write-in | 114 | 1.51 | ||
Total votes | 7,560 | 100% |
Party | Candidate | Votes | % | |
---|---|---|---|---|
Republican | Anna M. Scharf (incumbent) | 22,294 | 63.18 | |
Democratic | Kriss Wright | 12,900 | 36.56 | |
Write-in | 91 | 0.26 | ||
Total votes | 35,285 | 100% |
Party | Candidate | Votes | % | |
---|---|---|---|---|
Democratic | Victoria Ernst | 4,689 | 98.03 | |
Write-in | 94 | 1.97 | ||
Total votes | 4,783 | 100% |
Party | Candidate | Votes | % | |
---|---|---|---|---|
Republican | Lucetta A. Elmer | 5,291 | 98.20 | |
Write-in | 97 | 1.80 | ||
Total votes | 5,388 | 100% |
Party | Candidate | Votes | % | |
---|---|---|---|---|
Republican | Lucetta A. Elmer | 17,030 | 56.23 | |
Democratic | Victoria Ernst | 13,216 | 43.63 | |
Write-in | 43 | 0.14 | ||
Total votes | 30,289 | 100% |
Party | Candidate | Votes | % | |
---|---|---|---|---|
Democratic | Ben Bowman | 6,818 | 98.67 | |
Write-in | 92 | 1.33 | ||
Total votes | 6,910 | 100% |
Party | Candidate | Votes | % | |
---|---|---|---|---|
Republican | Bob Niemeyer | 2,212 | 54.03 | |
Republican | Gabriel Buehler | 1,835 | 44.82 | |
Write-in | 47 | 1.15 | ||
Total votes | 4,094 | 100% |
Party | Candidate | Votes | % | |
---|---|---|---|---|
Democratic | Ben Bowman | 20,636 | 65.31 | |
Republican | Bob Niemeyer | 10,907 | 34.52 | |
Write-in | 56 | 0.18 | ||
Total votes | 31,599 | 100% |
Party | Candidate | Votes | % | |
---|---|---|---|---|
Democratic | Courtney Neron (incumbent) | 5,953 | 98.76 | |
Write-in | 75 | 1.24 | ||
Total votes | 6,028 | 100% |
Party | Candidate | Votes | % | |
---|---|---|---|---|
Republican | Jason Fields | 3,592 | 64.71 | |
Republican | Glenn Lancaster | 1,910 | 34.41 | |
Write-in | 49 | 0.88 | ||
Total votes | 5,551 | 100% |
Party | Candidate | Votes | % | |
---|---|---|---|---|
Democratic | Courtney Neron (incumbent) | 17,606 | 53.24 | |
Republican | Jason Fields | 15,439 | 46.69 | |
Write-in | 24 | 0.07 | ||
Total votes | 33,069 | 100% |
Party | Candidate | Votes | % | |
---|---|---|---|---|
Democratic | Ken Helm (incumbent) | 5,781 | 60.06 | |
Democratic | Tammy Carpenter | 3,811 | 39.59 | |
Write-in | 33 | 0.34 | ||
Total votes | 9,625 | 100% |
Party | Candidate | Votes | % | |
---|---|---|---|---|
Republican | Sandra Nelson | 2,384 | 97.35 | |
Write-in | 65 | 2.65 | ||
Total votes | 2,449 | 100% |
Party | Candidate | Votes | % | |
---|---|---|---|---|
Democratic | Ken Helm (incumbent) | 22,375 | 71.21 | |
Republican | Sandra Nelson | 9,007 | 28.67 | |
Write-in | 37 | 0.12 | ||
Total votes | 31,419 | 100% |
Party | Candidate | Votes | % | |
---|---|---|---|---|
Democratic | Dacia Grayber (incumbent) | 10,997 | 99.46 | |
Write-in | 60 | 0.54 | ||
Total votes | 11,057 | 100% |
Party | Candidate | Votes | % | |
---|---|---|---|---|
Republican | Patrick Castles | 1,189 | 53.78 | |
Republican | Charles Mengis | 968 | 44.12 | |
Write-in | 37 | 1.69 | ||
Total votes | 2,194 | 100% |
Party | Candidate | Votes | % | |
---|---|---|---|---|
Democratic | Dacia Grayber (incumbent) | 30,483 | 81.98 | |
Republican | Patrick Castles | 6,662 | 17.92 | |
Write-in | 39 | 0.10 | ||
Total votes | 37,184 | 100% |
Party | Candidate | Votes | % | |
---|---|---|---|---|
Democratic | Susan McLain (incumbent) | 4,596 | 98.04 | |
Write-in | 92 | 1.96 | ||
Total votes | 4,688 | 100% |
Party | Candidate | Votes | % | |
---|---|---|---|---|
Republican | Gina Munster-Moore | 3,179 | 97.67 | |
Write-in | 76 | 2.33 | ||
Total votes | 3,255 | 100% |
Party | Candidate | Votes | % | |
---|---|---|---|---|
Democratic | Susan McLain (incumbent) | 13,592 | 53.57 | |
Republican | Gina Munster-Moore | 11,746 | 46.29 | |
Write-in | 35 | 0.14 | ||
Total votes | 25,373 | 100% |
Party | Candidate | Votes | % | |
---|---|---|---|---|
Democratic | Nathan Sosa (incumbent) | 4,839 | 98.65 | |
Write-in | 66 | 1.35 | ||
Total votes | 4,905 | 100% |
Party | Candidate | Votes | % | |
---|---|---|---|---|
Republican | Joe Everton | 2,036 | 62.76 | |
Republican | Todd Morrill | 1,182 | 36.44 | |
Write-in | 26 | 0.80 | ||
Total votes | 3,244 | 100% |
Party | Candidate | Votes | % | |
---|---|---|---|---|
Democratic | Nathan Sosa (incumbent) | 15,572 | 61.70 | |
Republican | Joe Everton | 9,632 | 38.16 | |
Write-in | 34 | 0.13 | ||
Total votes | 25,239 | 100% |
Party | Candidate | Votes | % | |
---|---|---|---|---|
Democratic | Anthony Sorace | 5,312 | 97.70 | |
Write-in | 125 | 2.30 | ||
Total votes | 5,437 | 100% |
Party | Candidate | Votes | % | |
---|---|---|---|---|
Republican | Brian Stout | 4,756 | 63.31 | |
Republican | Drew A. Layda | 2,720 | 36.21 | |
Write-in | 36 | 0.48 | ||
Total votes | 7,512 | 100% |
Party | Candidate | Votes | % | |
---|---|---|---|---|
Republican | Brian Stout | 22,026 | 59.31 | |
Democratic | Anthony Sorace | 15,031 | 40.48 | |
Write-in | 77 | 0.21 | ||
Total votes | 37,134 | 100% |
Party | Candidate | Votes | % | |
---|---|---|---|---|
Democratic | Logan Laity | 6,210 | 98.06 | |
Write-in | 123 | 1.94 | ||
Total votes | 6,333 | 100% |
Party | Candidate | Votes | % | |
---|---|---|---|---|
Republican | Cyrus Javadi | 3,676 | 58.22 | |
Republican | Glenn H. Gaither | 2,597 | 41.13 | |
Write-in | 41 | 0.65 | ||
Total votes | 6,314 | 100% |
Party | Candidate | Votes | % | |
---|---|---|---|---|
Republican | Cyrus Javadi | 17,846 | 51.15 | |
Democratic | Logan Laity | 17,002 | 48.73 | |
Write-in | 41 | 0.12 | ||
Total votes | 34,889 | 100% |
Party | Candidate | Votes | % | |
---|---|---|---|---|
Democratic | Maxine E. Dexter (incumbent) | 9,021 | 99.45 | |
Write-in | 50 | 0.55 | ||
Total votes | 9,071 | 100% |
Party | Candidate | Votes | % | |
---|---|---|---|---|
Republican | Stan Baumhofer | 878 | 98.87 | |
Write-in | 10 | 1.13 | ||
Total votes | 888 | 100% |
Party | Candidate | Votes | % | |
---|---|---|---|---|
Democratic | Maxine E. Dexter (incumbent) | 26,154 | 84.82 | |
Republican | Stan Baumhofer | 4,651 | 15.08 | |
Write-in | 30 | 0.10 | ||
Total votes | 30,835 | 100% |
Party | Candidate | Votes | % | |
---|---|---|---|---|
Democratic | Lisa Reynolds (incumbent) | 5,890 | 84.82 | |
Democratic | Jennifer Kinzey | 1,022 | 14.72 | |
Write-in | 32 | 0.46 | ||
Total votes | 6,944 | 100% |
Party | Candidate | Votes | % | |
---|---|---|---|---|
Republican | John Woods | 2,331 | 98.56 | |
Write-in | 34 | 1.44 | ||
Total votes | 2,365 | 100% |
Party | Candidate | Votes | % | |
---|---|---|---|---|
Democratic | Lisa Reynolds (incumbent) | 19,354 | 68.67 | |
Republican | John Woods | 8,801 | 31.23 | |
Write-in | 30 | 0.11 | ||
Total votes | 28,185 | 100% |
Party | Candidate | Votes | % | |
---|---|---|---|---|
Democratic | Farrah Chaichi | 2,857 | 58.82 | |
Democratic | Zeloszelos Marchandt | 1,953 | 40.28 | |
Write-in | 39 | 0.80 | ||
Total votes | 4,849 | 100% |
Party | Candidate | Votes | % | |
---|---|---|---|---|
Republican | Daniel R. Martin | 1,482 | 97.18 | |
Write-in | 43 | 2.82 | ||
Total votes | 1,525 | 100% |
Party | Candidate | Votes | % | |
---|---|---|---|---|
Democratic | Farrah Chaichi | 14,365 | 67.17 | |
Republican | Daniel R. Martin | 6,963 | 32.56 | |
Write-in | 58 | 0.27 | ||
Total votes | 21,386 | 100% |
Party | Candidate | Votes | % | |
---|---|---|---|---|
Democratic | Hai Pham | 5,694 | 98.77 | |
Write-in | 71 | 1.23 | ||
Total votes | 5,765 | 100% |
Party | Candidate | Votes | % | |
---|---|---|---|---|
Republican | Jeffrey S. Hindley | 3,248 | 98.28 | |
Write-in | 57 | 1.72 | ||
Total votes | 3,305 | 100% |
Party | Candidate | Votes | % | |
---|---|---|---|---|
Democratic | Hai Pham | 19,629 | 61.43 | |
Republican | Greer Trice | 12,272 | 38.41 | |
Write-in | 52 | 0.16 | ||
Total votes | 31,953 | 100% |
Party | Candidate | Votes | % | |
---|---|---|---|---|
Democratic | Jules Walters | 7,109 | 98.67 | |
Write-in | 96 | 1.33 | ||
Total votes | 7,205 | 100% |
Party | Candidate | Votes | % | |
---|---|---|---|---|
Republican | Aeric Estep | 3,959 | 98.53 | |
Write-in | 59 | 1.47 | ||
Total votes | 4,018 | 100% |
Party | Candidate | Votes | % | |
---|---|---|---|---|
Democratic | Jules Walters | 20,588 | 59.15 | |
Republican | Aeric Estep | 14,177 | 40.73 | |
Write-in | 39 | 0.11 | ||
Total votes | 34,804 | 100% |
Party | Candidate | Votes | % | |
---|---|---|---|---|
Democratic | Daniel Nguyen | 6,845 | 50.00 | |
Democratic | Neelam Gupta | 6,817 | 49.80 | |
Write-in | 28 | 0.20 | ||
Total votes | 13,690 | 100% |
Party | Candidate | Votes | % | |
---|---|---|---|---|
Republican | Alistair Firmin | 2,678 | 98.71 | |
Write-in | 35 | 1.29 | ||
Total votes | 2,713 | 100% |
Party | Candidate | Votes | % | |
---|---|---|---|---|
Democratic | Daniel Nguyen | 25,949 | 67.98 | |
Republican | Alistair Firmin | 12,200 | 31.96 | |
Write-in | 22 | 0.06 | ||
Total votes | 38,171 | 100% |
Party | Candidate | Votes | % | |
---|---|---|---|---|
Democratic | Janelle S. Bynum (incumbent) | 4,885 | 98.63 | |
Write-in | 68 | 1.37 | ||
Total votes | 4,953 | 100% |
Party | Candidate | Votes | % | |
---|---|---|---|---|
Republican | Kori Haynes | 2,876 | 98.56 | |
Write-in | 42 | 1.44 | ||
Total votes | 2,918 | 100% |
Party | Candidate | Votes | % | |
---|---|---|---|---|
Democratic | Janelle S. Bynum (incumbent) | 15,678 | 54.96 | |
Republican | Kori Haynes | 12,801 | 44.87 | |
Write-in | 48 | 0.17 | ||
Total votes | 28,527 | 100% |
Party | Candidate | Votes | % | |
---|---|---|---|---|
Democratic | Annessa Hartman | 4,433 | 58.22 | |
Democratic | Charles A. Gallia | 2,363 | 31.03 | |
Democratic | James Farley | 766 | 10.06 | |
Write-in | 52 | 0.68 | ||
Total votes | 7,614 | 100% |
Party | Candidate | Votes | % | |
---|---|---|---|---|
Republican | Adam Baker | 3,281 | 59.74 | |
Republican | Daniel Tooze Sr. | 2,186 | 39.80 | |
Write-in | 25 | 0.46 | ||
Total votes | 5,492 | 100% |
Party | Candidate | Votes | % | |
---|---|---|---|---|
Democratic | Annessa Hartman | 16,632 | 50.22 | |
Republican | Adam Baker | 16,451 | 49.67 | |
Write-in | 35 | 0.10 | ||
Total votes | 33,118 | 100% |
Party | Candidate | Votes | % | |
---|---|---|---|---|
Democratic | Mark F. Gamba | 10,270 | 69.42 | |
Democratic | Kaliko Castille | 4,233 | 28.61 | |
Democratic | Christopher A. Draus | 245 | 1.66 | |
Write-in | 46 | 0.31 | ||
Total votes | 14,794 | 100% |
Party | Candidate | Votes | % | |
---|---|---|---|---|
Republican | Rob Reynolds | 1,343 | 46.31 | |
Republican | Bob (Elvis) Clark | 1,239 | 42.72 | |
Republican | Rene Gomez | 280 | 9.66 | |
Write-in | 38 | 1.31 | ||
Total votes | 2,900 | 100% |
Party | Candidate | Votes | % | |
---|---|---|---|---|
Democratic | Mark F. Gamba | 29,187 | 78.21 | |
Republican | Rob Reynolds | 8,088 | 21.67 | |
Write-in | 45 | 0.12 | ||
Total votes | 37,320 | 100% |
Party | Candidate | Votes | % | |
---|---|---|---|---|
Democratic | Rob Nosse (incumbent) | 13,139 | 99.04 | |
Write-in | 127 | 0.96 | ||
Total votes | 13,266 | 100% |
Party | Candidate | Votes | % | |
---|---|---|---|---|
Republican | Scott Trahan | 441 | 96.50 | |
Write-in | 16 | 3.50 | ||
Total votes | 457 | 100% |
Party | Candidate | Votes | % | |
---|---|---|---|---|
Democratic | Rob Nosse (incumbent) | 34,777 | 91.52 | |
Republican | Scott Trahan | 2,540 | 6.68 | |
Libertarian | Shira Newman | 619 | 1.63 | |
Write-in | 65 | 0.17 | ||
Total votes | 38,001 | 100% |
Party | Candidate | Votes | % | |
---|---|---|---|---|
Democratic | Tawna Sanchez (incumbent) | 13,247 | 99.34 | |
Write-in | 88 | 0.66 | ||
Total votes | 13,335 | 100% |
Party | Candidate | Votes | % | |
---|---|---|---|---|
Republican | Tim LeMaster | 449 | 97.61 | |
Write-in | 11 | 2.39 | ||
Total votes | 460 | 100% |
Party | Candidate | Votes | % | |
---|---|---|---|---|
Democratic | Tawna Sanchez (incumbent) | 33,466 | 91.80 | |
Republican | Tim LeMaster | 2,943 | 8.07 | |
Write-in | 48 | 0.13 | ||
Total votes | 36,457 | 100% |
Party | Candidate | Votes | % | |
---|---|---|---|---|
Democratic | Travis Nelson (incumbent) | 10,271 | 91.35 | |
Democratic | Eric Delehoy | 948 | 8.43 | |
Write-in | 25 | 0.22 | ||
Total votes | 11,244 | 100% |
Party | Candidate | Votes | % | |
---|---|---|---|---|
Republican | Rolf Schuler (write-in) | 12 | 11.11 | |
Write-in | 96 | 88.89 | ||
Total votes | 108 | 100% |
Party | Candidate | Votes | % | |
---|---|---|---|---|
Democratic | Travis Nelson (incumbent) | 26,429 | 87.65 | |
Republican | Rolf Schuler | 3,444 | 11.42 | |
Constitution | Morgan Hinthorne | 232 | 0.77 | |
Write-in | 47 | 0.16 | ||
Total votes | 30,152 | 100% |
Party | Candidate | Votes | % | |
---|---|---|---|---|
Democratic | Thuy Tran | 10,657 | 72.61 | |
Democratic | Catherine Thomasson | 4,010 | 27.32 | |
Write-in | 11 | 0.07 | ||
Total votes | 14,678 | 100% |
Party | Candidate | Votes | % | |
---|---|---|---|---|
Republican | George Donnerberg (write-in) | 50 | 21.19 | |
Write-in | 186 | 78.81 | ||
Total votes | 236 | 100% |
Party | Candidate | Votes | % | |
---|---|---|---|---|
Democratic | Thuy Tran | 28,946 | 84.07 | |
Republican | George Donnerberg | 5,465 | 15.87 | |
Write-in | 21 | 0.06 | ||
Total votes | 34,432 | 100% |
Party | Candidate | Votes | % | |
---|---|---|---|---|
Democratic | Khanh Pham (incumbent) | 8,424 | 99.28 | |
Write-in | 61 | 0.72 | ||
Total votes | 8,485 | 100% |
Party | Candidate | Votes | % | |
---|---|---|---|---|
Republican | Timothy R. Sytsma | 789 | 95.99 | |
Write-in | 33 | 4.01 | ||
Total votes | 822 | 100% |
Party | Candidate | Votes | % | |
---|---|---|---|---|
Democratic | Khanh Pham (incumbent) | 24,289 | 83.78 | |
Republican | Timothy R. Sytsma | 4,658 | 16.07 | |
Write-in | 44 | 0.15 | ||
Total votes | 28,991 | 100% |
Party | Candidate | Votes | % | |
---|---|---|---|---|
Democratic | Andrea Valderrama (incumbent) | 4,891 | 99.37 | |
Write-in | 31 | 0.63 | ||
Total votes | 4,922 | 100% |
Party | Candidate | Votes | % | |
---|---|---|---|---|
Republican | William Stewart (write-in) | 14 | 7.14 | |
Write-in | 182 | 92.86 | ||
Total votes | 196 | 100% |
Party | Candidate | Votes | % | |
---|---|---|---|---|
Democratic | Andrea Valderrama (incumbent) | 15,136 | 68.56 | |
Republican | William Stewart | 6,894 | 31.23 | |
Write-in | 46 | 0.21 | ||
Total votes | 22,076 | 100% |
Party | Candidate | Votes | % | |
---|---|---|---|---|
Democratic | Hoa H. Nguyen | 3,854 | 98.72 | |
Write-in | 50 | 1.28 | ||
Total votes | 3,904 | 100% |
Party | Candidate | Votes | % | |
---|---|---|---|---|
Republican | John Masterman | 2,521 | 98.71 | |
Write-in | 33 | 1.29 | ||
Total votes | 2,554 | 100% |
Party | Candidate | Votes | % | |
---|---|---|---|---|
Democratic | Hoa H. Nguyen | 12,329 | 51.24 | |
Republican | John Masterman | 11,712 | 48.68 | |
Write-in | 20 | 0.08 | ||
Total votes | 24,061 | 100% |
Party | Candidate | Votes | % | |
---|---|---|---|---|
Democratic | Zach Hudson (incumbent) | 3,342 | 98.53 | |
Write-in | 50 | 1.47 | ||
Total votes | 3,392 | 100% |
Party | Candidate | Votes | % | |
---|---|---|---|---|
Republican | Randy E. Lauer | 2,301 | 99.10 | |
Write-in | 21 | 0.90 | ||
Total votes | 2,322 | 100% |
Party | Candidate | Votes | % | |
---|---|---|---|---|
Democratic | Zach Hudson (incumbent) | 10,955 | 52.08 | |
Republican | Randy E. Lauer | 10,052 | 47.79 | |
Write-in | 27 | 0.13 | ||
Total votes | 21,034 | 100% |
Party | Candidate | Votes | % | |
---|---|---|---|---|
Democratic | Ricki Ruiz (incumbent) | 4,175 | 98.89 | |
Write-in | 47 | 1.11 | ||
Total votes | 4,222 | 100% |
Party | Candidate | Votes | % | |
---|---|---|---|---|
Republican | Amelia Salvador | 2,715 | 98.69 | |
Write-in | 36 | 1.31 | ||
Total votes | 2,751 | 100% |
Party | Candidate | Votes | % | |
---|---|---|---|---|
Democratic | Ricki Ruiz (incumbent) | 12,157 | 51.78 | |
Republican | Amelia Salvador | 11,298 | 48.13 | |
Write-in | 21 | 0.09 | ||
Total votes | 23,476 | 100% |
Party | Candidate | Votes | % | |
---|---|---|---|---|
Democratic | Walt Trandum | 4,083 | 96.71 | |
Write-in | 139 | 3.29 | ||
Total votes | 4,222 | 100% |
Party | Candidate | Votes | % | |
---|---|---|---|---|
Republican | James Hieb (incumbent) | 5,292 | 60.30 | |
Republican | Lisa Davidson | 3,445 | 39.25 | |
Write-in | 39 | 0.44 | ||
Total votes | 8,776 | 100% |
Party | Candidate | Votes | % | |
---|---|---|---|---|
Republican | James Hieb (incumbent) | 23,471 | 66.02 | |
Democratic | Walt Trandum | 11,968 | 33.66 | |
Write-in | 113 | 0.32 | ||
Total votes | 35,552 | 100% |
Party | Candidate | Votes | % | |
---|---|---|---|---|
Democratic | Darcy Long | 5,981 | 98.10 | |
Write-in | 116 | 1.90 | ||
Total votes | 6,097 | 100% |
Party | Candidate | Votes | % | |
---|---|---|---|---|
Republican | Jeff Helfrich | 5,705 | 84.59 | |
Republican | James Born | 788 | 11.68 | |
Republican | Britt Storkson | 227 | 3.37 | |
Write-in | 24 | 0.36 | ||
Total votes | 6,744 | 100% |
Party | Candidate | Votes | % | |
---|---|---|---|---|
Republican | Jeff Helfrich | 16,994 | 52.46 | |
Democratic | Darcy Long | 15,360 | 47.42 | |
Write-in | 40 | 0.12 | ||
Total votes | 32,394 | 100% |
Party | Candidate | Votes | % | |
---|---|---|---|---|
Democratic | Emerson Levy | 6,907 | 99.08 | |
Write-in | 64 | 0.92 | ||
Total votes | 6,971 | 100% |
Party | Candidate | Votes | % | |
---|---|---|---|---|
Republican | Michael Sipe | 5,949 | 98.90 | |
Write-in | 66 | 1.10 | ||
Total votes | 6,015 | 100% |
Party | Candidate | Votes | % | |
---|---|---|---|---|
Democratic | Emerson Levy | 19,584 | 50.61 | |
Republican | Michael Sipe | 19,075 | 49.30 | |
Write-in | 35 | 0.09 | ||
Total votes | 38,694 | 100% |
Party | Candidate | Votes | % | |
---|---|---|---|---|
Democratic | Jason Kropf (incumbent) | 7,960 | 99.10 | |
Write-in | 72 | 0.90 | ||
Total votes | 8,032 | 100% |
Party | Candidate | Votes | % | |
---|---|---|---|---|
Republican | Judy Trego | 3,724 | 98.39 | |
Write-in | 61 | 1.61 | ||
Total votes | 3,785 | 100% |
Party | Candidate | Votes | % | |
---|---|---|---|---|
Democratic | Jason Kropf (incumbent) | 22,865 | 64.42 | |
Republican | Judy Trego | 12,604 | 35.51 | |
Write-in | 27 | 0.08 | ||
Total votes | 35,496 | 100% |
Party | Candidate | Votes | % | |
---|---|---|---|---|
Democratic | Brian Lepore | 3,539 | 97.44 | |
Write-in | 93 | 2.56 | ||
Total votes | 3,632 | 100% |
Party | Candidate | Votes | % | |
---|---|---|---|---|
Republican | E. Werner Reschke (incumbent) | 8,037 | 98.16 | |
Write-in | 151 | 1.84 | ||
Total votes | 8,188 | 100% |
Party | Candidate | Votes | % | |
---|---|---|---|---|
Republican | E. Werner Reschke (incumbent) | 24,371 | 68.74 | |
Democratic | Brian Lepore | 11,041 | 31.14 | |
Write-in | 44 | 0.12 | ||
Total votes | 35,456 | 100% |
Party | Candidate | Votes | % | |
---|---|---|---|---|
Democratic | Jonathan P. Chenjeri | 2,583 | 98.33 | |
Write-in | 44 | 1.67 | ||
Total votes | 2,627 | 100% |
Party | Candidate | Votes | % | |
---|---|---|---|---|
Republican | Emily McIntire | 6,752 | 98.71 | |
Write-in | 88 | 1.29 | ||
Total votes | 6,840 | 100% |
Party | Candidate | Votes | % | |
---|---|---|---|---|
Republican | Emily McIntire | 21,425 | 72.60 | |
Democratic | Jonathan P. Chenjeri | 8,037 | 27.23 | |
Write-in | 49 | 0.17 | ||
Total votes | 29,511 | 100% |
Party | Candidate | Votes | % | |
---|---|---|---|---|
Democratic | Greg Smith (write-in) | 93 | 32.86 | |
Write-in | 190 | 67.14 | ||
Total votes | 283 | 100% |
Party | Candidate | Votes | % | |
---|---|---|---|---|
Republican | Greg Smith (incumbent) | 5,431 | 98.01 | |
Write-in | 110 | 1.99 | ||
Total votes | 5,541 | 100% |
Party | Candidate | Votes | % | |
---|---|---|---|---|
Republican | Greg Smith (incumbent) | 17,384 | 97.44 | |
Write-in | 457 | 2.56 | ||
Total votes | 17,841 | 100% |
Party | Candidate | Votes | % | |
---|---|---|---|---|
Democratic | Bobby Levy (write-in) | 82 | 23.23 | |
Write-in | 271 | 76.77 | ||
Total votes | 353 | 100% |
Party | Candidate | Votes | % | |
---|---|---|---|---|
Republican | Bobby Levy (incumbent) | 8,803 | 92.15 | |
Republican | Skye Farnam | 711 | 7.44 | |
Write-in | 39 | 0.41 | ||
Total votes | 9,553 | 100% |
Party | Candidate | Votes | % | |
---|---|---|---|---|
Republican | Bobby Levy (incumbent) | 23,274 | 83.66 | |
Libertarian | Jesse Bonifer | 4,226 | 15.19 | |
Write-in | 319 | 1.15 | ||
Total votes | 27,819 | 100% |
Party | Candidate | Votes | % | |
---|---|---|---|---|
Democratic | Lawrence Jones | 3,583 | 97.52 | |
Write-in | 91 | 2.48 | ||
Total votes | 3,674 | 100% |
Party | Candidate | Votes | % | |
---|---|---|---|---|
Republican | Vikki Breese-Iverson (incumbent) | 9,379 | 98.80 | |
Write-in | 114 | 1.20 | ||
Total votes | 9,493 | 100% |
Party | Candidate | Votes | % | |
---|---|---|---|---|
Republican | Vikki Breese-Iverson (incumbent) | 26,528 | 72.42 | |
Democratic | Lawrence Jones | 10,059 | 27.46 | |
Write-in | 45 | 0.12 | ||
Total votes | 36,632 | 100% |
Party | Candidate | Votes | % | |
---|---|---|---|---|
Democratic | Mark Owens (write-in) | 138 | 34.33 | |
Write-in | 264 | 65.67 | ||
Total votes | 402 | 100% |
Party | Candidate | Votes | % | |
---|---|---|---|---|
Republican | Mark Owens (incumbent) | 9,665 | 99.14 | |
Write-in | 84 | 0.86 | ||
Total votes | 9,749 | 100% |
Party | Candidate | Votes | % | |
---|---|---|---|---|
Republican | Mark Owens (incumbent) | 24,496 | 89.19 | |
Progressive | Antonio Sunseri | 2,837 | 10.33 | |
Write-in | 131 | 0.48 | ||
Total votes | 27,464 | 100% |
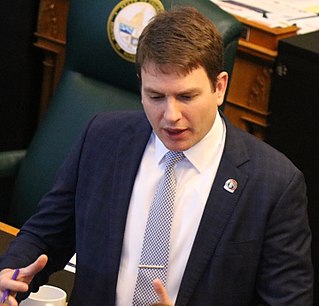
Brian James Boquist is an Independent, formerly Republican, politician from Oregon; he currently serves in the Oregon Senate representing District 12. Previously, he was in the Oregon House of Representatives, representing District 23 in the mid-Willamette Valley from 2005 to 2009.
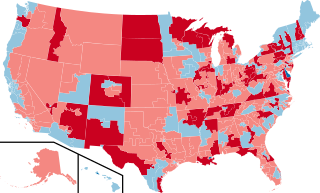
The 2010 United States House of Representatives elections were held on November 2, 2010, as part of the 2010 midterm elections during President Barack Obama's first term in office. Voters of the 50 U.S. states chose 435 U.S. Representatives to serve in the 112th United States Congress. Also, voters of the U.S. territories, commonwealths and District of Columbia chose their non-voting delegates. U.S. Senate elections and various state and local elections were held on the same date.
Cliff Stewart Bentz is an American lawyer, rancher, and politician serving as the U.S. representative for Oregon's 2nd congressional district. A member of the Republican Party, he is the ranking member on the House Natural Resources Committee Subcommittee on Water, Oceans and Wildlife and sits on the House Judiciary Committee. He previously served in the Oregon Senate, representing the 30th district in Eastern Oregon. He also served in the Oregon House of Representatives, representing the 60th district, which encompasses Malheur, Baker, Harney, and Grant counties, and part of Lake County, and includes the cities of Baker City, Burns, and Ontario.
Valerie Anne Hoyle is an American politician serving as the U.S. representative for Oregon's 4th congressional district since 2023. Until 2023, she served as the commissioner of Oregon's Bureau of Labor and Industries (BOLI).
The 2012 United States House of Representatives elections in Oregon were held on Tuesday, November 6, 2012 to elect the five U.S. representatives from the state of Oregon, apportioned according to the 2010 United States census. The elections coincided with the elections of other federal and state offices, including a quadrennial presidential election. All five incumbents, four Democrats and one Republican, were re-elected to another term.
The 2014 United States House of Representatives elections in Oregon were held on Tuesday, November 4, 2014 to elect the five U.S. representatives from the state of Oregon, one from each of the state's five congressional districts. The elections coincided with the elections of other federal and state offices, including the governor of Oregon and a United States senator. Primary elections were held on May 20, 2014.
Andrea Rose Salinas is an American politician serving as the U.S. representative for Oregon's 6th congressional district since 2023. Oregon's 6th congressional district includes all of Yamhill and Polk counties, the part of Marion County that includes Salem and Woodburn, a small piece of Beaverton, and the suburban communities to the southwest of Portland, including Tigard, Tualatin and Sherwood.
Jamie McLeod-Skinner is an American attorney, engineer, and politician who was the Democratic nominee for Oregon's 5th congressional district in the 2022 election. In an upset, McLeod-Skinner defeated seven-term incumbent Blue Dog representative Kurt Schrader in the Democratic primary for Oregon's 5th, in a race in which she was considered the more progressive candidate. She later lost the general election to Republican former Happy Valley Mayor Lori Chavez-DeRemer.
The 2020 United States House of Representatives elections in Oregon was held on November 3, 2020, to elect the five U.S. representatives from the state of Oregon, one from each of the state's five congressional districts. The elections coincided with the 2020 U.S. presidential election, as well as other elections to the House of Representatives, elections to the United States Senate and various state and local elections.
The 2020 Oregon Democratic presidential primary took place on May 19, 2020 in the Democratic Party primaries for the 2020 presidential election and was the only contest on that date. The Kentucky primary, previously also scheduled for May 19, was delayed due to the coronavirus pandemic, while Oregon already had a total vote-by-mail primary. The Oregon primary was a closed primary and awarded 74 delegates to the 2020 Democratic National Convention, of whom 61 were pledged delegates allocated on the basis of the primary results.
The 2018 elections for the Oregon Legislative Assembly determined the composition of both houses for the 80th Oregon Legislative Assembly. The Republican and Democratic parties held primary elections on May 15, 2018 with general elections on November 6, 2018.
The 2022 United States House of Representatives elections in Oregon were held on November 8, 2022, to elect the six U.S. representatives from the state of Oregon, one from each of the state's six congressional districts. Primaries for these seats were held on May 17, 2022. The elections coincided with the elections and primaries of other federal and state offices.
The 2022 Tennessee State Senate election was held on November 8, 2022, to elect 17 of the 33 seats for the Tennessee's State Senate. The elections coincided with the Governor, U.S. House, and State House elections. The primary elections were held on August 4, 2022.
The 2022 Iowa Senate elections were held on November 8, 2022 to elect members of the Iowa Senate from 25 odd-numbered districts. Senators serve four-year terms in single-member constituencies, with half of the seats up for election each cycle. Primary elections were held on June 7.
Elections for the Iowa House of Representatives were held on November 8, 2022. This was the first election for the Iowa House using the new legislative maps that were enacted following the 2020 census. Republicans expanded their majority in the chamber after a number of their members were defeated in primaries.
The 2022 Colorado House of Representatives elections took place on November 8, 2022, with the primary elections being held on June 28, 2022. Voters in all 65 districts of the state House elected their representative for a two-year term. It coincided with other Colorado elections of the same year and the biennial United States elections.
The 2022 Arkansas House of Representatives elections was held on November 8, 2022. Elections were held to elect representatives from all 100 House of Representatives districts across the U.S. state of Arkansas. It was held alongside numerous other federal, state, and local elections, including the 2022 Arkansas Senate election.
The 2022 Colorado Senate elections took place on November 8, 2022, with the primary elections held on June 28, 2022. Voters in 17 out of the 35 districts of the Colorado Senate elected their representative for a four-year term. It coincided with other Colorado elections of the same year and the biennial United States elections.
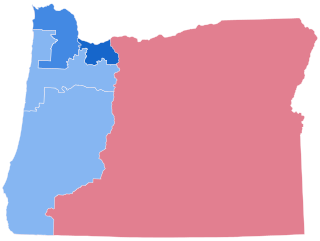
The 2022 Oregon State Senate election were held in the U.S. state of Oregon on November 8, 2022, to elect 15 of the 30 members of the State Senate of the 82nd Oregon Legislature, along with one special election.
Lori Michelle Chavez-DeRemer is an American politician from Oregon. As a member of the Republican Party, she represents Oregon's 5th congressional district in the United States House of Representatives. She is the first Republican woman to represent Oregon in the House.